OPEN-SOURCE SCRIPT
Valuation Multi-Asset [Open]
Description
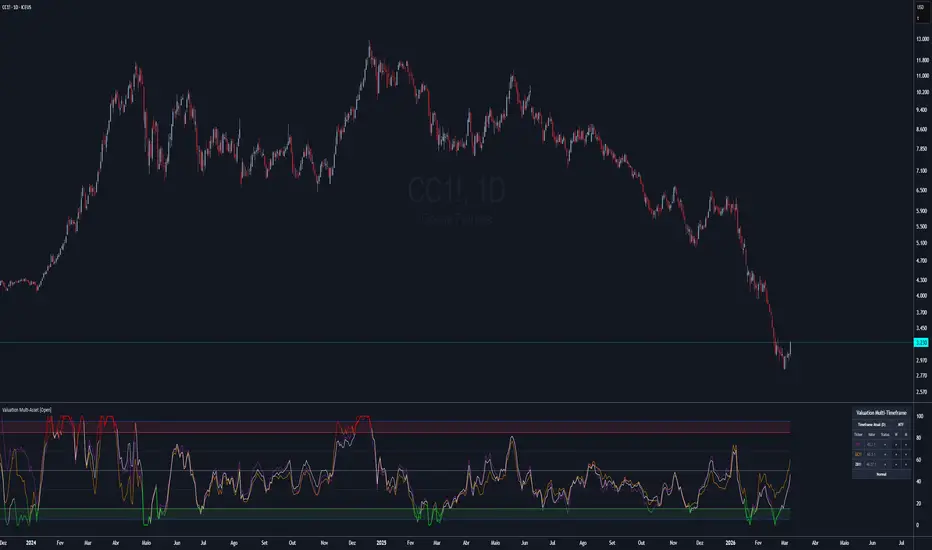
The Valuation Multi-Asset [Open] is a highly specialized Intermarket Analysis tool designed to determine the relative valuation of your chart's asset by comparing its performance against up to 6 global benchmarks simultaneously.
By releasing this V1.4 edition as an Open-Source tool, traders and Pine Script developers can study advanced concepts such as dynamic multi-timeframe (request.security) arrays, matrix-style data normalization, and complex real-time table drawing.
Underlying Concepts & Methodology
The script operates on the principle of asset correlation and historical mean reversion.
Ratio Calculation: It computes the pure price ratio between the Chart Asset and the selected Benchmark Assets (e.g., DXY, Gold, Bonds).
Smoothing & Normalization: It applies an Exponential Moving Average (EMA) to filter noise, and then normalizes the result over a long-term historical lookback period (default is 156 weeks/3 years).
Scoring (0-100): The normalized data is ranked into a Valuation Index.
< 15 (Green): Historically Undervalued (Cheap) relative to the benchmark.
> 85 (Red): Historically Overvalued (Expensive) relative to the benchmark.
Key Features
Expanded Capacity: Monitor up to 6 simultaneous assets on a single chart to build a complete macro correlation matrix.
MTF Dashboard: A built-in HUD summarizes the Valuation bias (Cheap/Neutral/Expensive) across Daily, Weekly, and Monthly timeframes.
ETF Reference Table: Includes a handy on-chart cheat sheet of major ETFs to use as benchmarks.
How to Use
Contextual Bias: Use the MTF dashboard to get a quick read. If 5 out of 6 comparisons say your asset is "Cheap" on the Weekly timeframe, the probability of a macro mean-reversion (Long trade) increases drastically.
[English Translation of User Interface]
To comply with House Rules regarding non-English UI, here is the translation of the script's settings menu:
1. Seleção de Ativos (Asset Selection)
Usar Timeframe Personalizado = Use Custom Timeframe
Mostrar Ativo (1-6) = Show Asset (Slots 1 to 6)
Símbolo = Symbol (Ticker)
2. Tabela de Referência de ETFs (ETF Reference Table)
Mostrar Tabela Ref. = Show Reference Table
Posição / Categoria = Table Position / Filter Category
3. Parâmetros do Índice (Index Parameters)
Comprimento EMA = Smoothing EMA Length
Comprimento R do VIndex = Valuation Index Lookback Period
4. Níveis de Valuation (Valuation Levels)
Sobrevaloração / Subvaloração = Overvaluation / Undervaluation (Thresholds)
Nível Neutro = Neutral Level
5. Configurações de Tabela (Table Settings)
Tamanho do Texto = Text Size
Tema = Theme (Dark/Light)
Usar Cores Personalizadas = Use Custom Colors
6. Análise Multi-Timeframe (MTF Analysis)
Mostrar D / W / M = Show Daily / Weekly / Monthly Columns
[Português]
Descrição
O Valuation Multi-Asset agora é Open-Source! Esta ferramenta de Análise Intermercado calcula a correlação relativa do seu ativo contra até 6 benchmarks globais (como Dólar, Ouro, SP500).
Ele normaliza os dados históricos e cria um placar de 0 a 100 para te dizer estatisticamente se o seu ativo está "Caro" ou "Barato" em relação ao resto do mundo.
Funcionalidades
6 Slots de Ativos: Monitore uma cesta completa de correlações.
Painel MTF: Resumo de valuation para os tempos Diário, Semanal e Mensal em uma única tabela.
Código Aberto: Estude a manipulação avançada de tabelas e request.security.
The Valuation Multi-Asset [Open] is a highly specialized Intermarket Analysis tool designed to determine the relative valuation of your chart's asset by comparing its performance against up to 6 global benchmarks simultaneously.
By releasing this V1.4 edition as an Open-Source tool, traders and Pine Script developers can study advanced concepts such as dynamic multi-timeframe (request.security) arrays, matrix-style data normalization, and complex real-time table drawing.
Underlying Concepts & Methodology
The script operates on the principle of asset correlation and historical mean reversion.
Ratio Calculation: It computes the pure price ratio between the Chart Asset and the selected Benchmark Assets (e.g., DXY, Gold, Bonds).
Smoothing & Normalization: It applies an Exponential Moving Average (EMA) to filter noise, and then normalizes the result over a long-term historical lookback period (default is 156 weeks/3 years).
Scoring (0-100): The normalized data is ranked into a Valuation Index.
< 15 (Green): Historically Undervalued (Cheap) relative to the benchmark.
> 85 (Red): Historically Overvalued (Expensive) relative to the benchmark.
Key Features
Expanded Capacity: Monitor up to 6 simultaneous assets on a single chart to build a complete macro correlation matrix.
MTF Dashboard: A built-in HUD summarizes the Valuation bias (Cheap/Neutral/Expensive) across Daily, Weekly, and Monthly timeframes.
ETF Reference Table: Includes a handy on-chart cheat sheet of major ETFs to use as benchmarks.
How to Use
Contextual Bias: Use the MTF dashboard to get a quick read. If 5 out of 6 comparisons say your asset is "Cheap" on the Weekly timeframe, the probability of a macro mean-reversion (Long trade) increases drastically.
[English Translation of User Interface]
To comply with House Rules regarding non-English UI, here is the translation of the script's settings menu:
1. Seleção de Ativos (Asset Selection)
Usar Timeframe Personalizado = Use Custom Timeframe
Mostrar Ativo (1-6) = Show Asset (Slots 1 to 6)
Símbolo = Symbol (Ticker)
2. Tabela de Referência de ETFs (ETF Reference Table)
Mostrar Tabela Ref. = Show Reference Table
Posição / Categoria = Table Position / Filter Category
3. Parâmetros do Índice (Index Parameters)
Comprimento EMA = Smoothing EMA Length
Comprimento R do VIndex = Valuation Index Lookback Period
4. Níveis de Valuation (Valuation Levels)
Sobrevaloração / Subvaloração = Overvaluation / Undervaluation (Thresholds)
Nível Neutro = Neutral Level
5. Configurações de Tabela (Table Settings)
Tamanho do Texto = Text Size
Tema = Theme (Dark/Light)
Usar Cores Personalizadas = Use Custom Colors
6. Análise Multi-Timeframe (MTF Analysis)
Mostrar D / W / M = Show Daily / Weekly / Monthly Columns
[Português]
Descrição
O Valuation Multi-Asset agora é Open-Source! Esta ferramenta de Análise Intermercado calcula a correlação relativa do seu ativo contra até 6 benchmarks globais (como Dólar, Ouro, SP500).
Ele normaliza os dados históricos e cria um placar de 0 a 100 para te dizer estatisticamente se o seu ativo está "Caro" ou "Barato" em relação ao resto do mundo.
Funcionalidades
6 Slots de Ativos: Monitore uma cesta completa de correlações.
Painel MTF: Resumo de valuation para os tempos Diário, Semanal e Mensal em uma única tabela.
Código Aberto: Estude a manipulação avançada de tabelas e request.security.
نص برمجي مفتوح المصدر
بروح TradingView الحقيقية، قام مبتكر هذا النص البرمجي بجعله مفتوح المصدر، بحيث يمكن للمتداولين مراجعة وظائفه والتحقق منها. شكرا للمؤلف! بينما يمكنك استخدامه مجانًا، تذكر أن إعادة نشر الكود يخضع لقواعد الموقع الخاصة بنا.

إخلاء المسؤولية
لا يُقصد بالمعلومات والمنشورات أن تكون، أو تشكل، أي نصيحة مالية أو استثمارية أو تجارية أو أنواع أخرى من النصائح أو التوصيات المقدمة أو المعتمدة من TradingView. اقرأ المزيد في شروط الاستخدام.
نص برمجي مفتوح المصدر
بروح TradingView الحقيقية، قام مبتكر هذا النص البرمجي بجعله مفتوح المصدر، بحيث يمكن للمتداولين مراجعة وظائفه والتحقق منها. شكرا للمؤلف! بينما يمكنك استخدامه مجانًا، تذكر أن إعادة نشر الكود يخضع لقواعد الموقع الخاصة بنا.
إخلاء المسؤولية
لا يُقصد بالمعلومات والمنشورات أن تكون، أو تشكل، أي نصيحة مالية أو استثمارية أو تجارية أو أنواع أخرى من النصائح أو التوصيات المقدمة أو المعتمدة من TradingView. اقرأ المزيد في شروط الاستخدام.