OPEN-SOURCE SCRIPT
RSI Swing Structure Indicator (HH, LH, HL, LL + Alerts)
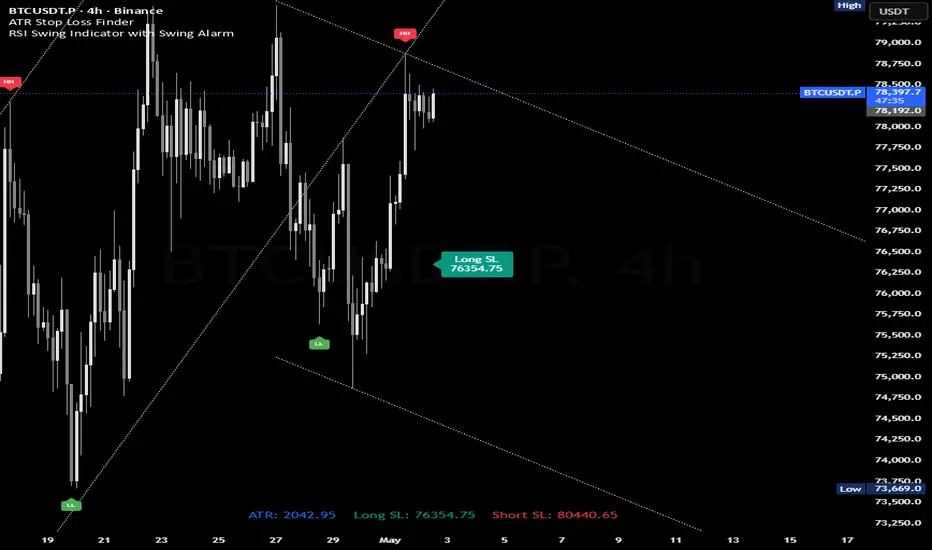
This indicator visualizes market structure using RSI-based swing detection.
It automatically identifies swing highs and lows based on overbought and oversold conditions and classifies them into:
HH (Higher High)
LH (Lower High)
HL (Higher Low)
LL (Lower Low)
How it works
The script uses the RSI to detect momentum extremes:
When RSI reaches the overbought zone, a swing high is formed
When RSI reaches the oversold zone, a swing low is formed
As long as RSI remains in these zones, the swing continues to update dynamically with price.
Once the opposite zone is reached, a new swing is confirmed and the structure is evaluated.
Key Features
Automatic detection of market structure (HH, LH, HL, LL)
Dynamic swing tracking while RSI remains in extreme zones
Optional swing lines connecting highs and lows
Clean chart visualization with minimal noise
Fully configurable RSI settings
Alerts
Built-in alert conditions for:
HH (Higher High)
LH (Lower High)
HL (Higher Low)
LL (Lower Low)
Any new swing event
This allows you to react instantly to structure changes in the market.
Best Use Cases
Trend confirmation and structure analysis
Identifying continuation vs. reversal setups
Combining with EMA, volume, or orderflow strategies
Intraday and swing trading
Tips
Use higher timeframes (e.g. 1H, 4H) for more reliable structure
Combine with trend filters (like EMA 50/100/200) for higher probability setups
Avoid using in low volatility or ranging markets without confirmation
It automatically identifies swing highs and lows based on overbought and oversold conditions and classifies them into:
HH (Higher High)
LH (Lower High)
HL (Higher Low)
LL (Lower Low)
How it works
The script uses the RSI to detect momentum extremes:
When RSI reaches the overbought zone, a swing high is formed
When RSI reaches the oversold zone, a swing low is formed
As long as RSI remains in these zones, the swing continues to update dynamically with price.
Once the opposite zone is reached, a new swing is confirmed and the structure is evaluated.
Key Features
Automatic detection of market structure (HH, LH, HL, LL)
Dynamic swing tracking while RSI remains in extreme zones
Optional swing lines connecting highs and lows
Clean chart visualization with minimal noise
Fully configurable RSI settings
Alerts
Built-in alert conditions for:
HH (Higher High)
LH (Lower High)
HL (Higher Low)
LL (Lower Low)
Any new swing event
This allows you to react instantly to structure changes in the market.
Best Use Cases
Trend confirmation and structure analysis
Identifying continuation vs. reversal setups
Combining with EMA, volume, or orderflow strategies
Intraday and swing trading
Tips
Use higher timeframes (e.g. 1H, 4H) for more reliable structure
Combine with trend filters (like EMA 50/100/200) for higher probability setups
Avoid using in low volatility or ranging markets without confirmation
نص برمجي مفتوح المصدر
بروح TradingView الحقيقية، قام مبتكر هذا النص البرمجي بجعله مفتوح المصدر، بحيث يمكن للمتداولين مراجعة وظائفه والتحقق منها. شكرا للمؤلف! بينما يمكنك استخدامه مجانًا، تذكر أن إعادة نشر الكود يخضع لقواعد الموقع الخاصة بنا.

إخلاء المسؤولية
لا يُقصد بالمعلومات والمنشورات أن تكون، أو تشكل، أي نصيحة مالية أو استثمارية أو تجارية أو أنواع أخرى من النصائح أو التوصيات المقدمة أو المعتمدة من TradingView. اقرأ المزيد في شروط الاستخدام.
نص برمجي مفتوح المصدر
بروح TradingView الحقيقية، قام مبتكر هذا النص البرمجي بجعله مفتوح المصدر، بحيث يمكن للمتداولين مراجعة وظائفه والتحقق منها. شكرا للمؤلف! بينما يمكنك استخدامه مجانًا، تذكر أن إعادة نشر الكود يخضع لقواعد الموقع الخاصة بنا.
إخلاء المسؤولية
لا يُقصد بالمعلومات والمنشورات أن تكون، أو تشكل، أي نصيحة مالية أو استثمارية أو تجارية أو أنواع أخرى من النصائح أو التوصيات المقدمة أو المعتمدة من TradingView. اقرأ المزيد في شروط الاستخدام.