Goldbach Levels by AZ
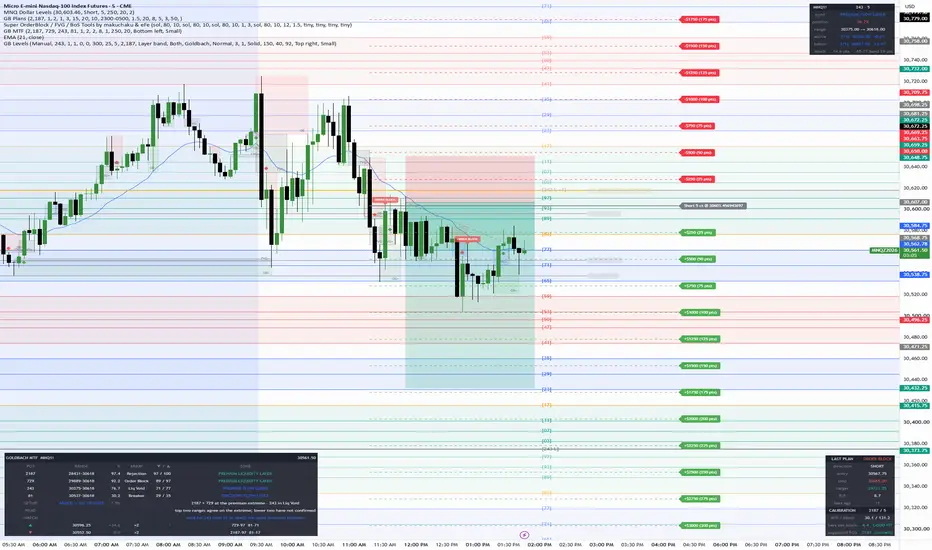
GOLDBACH LEVELS — dealing-range grid
Draws a Power-of-Three (PO3) dealing range and its Goldbach partition levels, colour-coded by layer, with a read-out of where price sits in the range.
WHAT IT DRAWS
A dealing range is a fixed block of price, sized by a PO3 number (27, 81, 243, 729, 2187, 6561), anchored so that the range low is an exact multiple of that number. Inside the range the script marks the Goldbach percentage levels:
0 · 3 · 7 · 11 · 17 · 23 · 29 · 35 · 41 · 47 · 50 · 53 · 59 · 65 · 71 · 77 · 83 · 89 · 93 · 97 · 100
These are grouped into three layers, each with its own colour and light shading:
LIQUIDITY (0–17 and 83–100): rejection block 3/97, last line of defence 7/93, order block 11/89, and the inversion point 17/83
FLOW (23–35 and 65–77): the sweet spot 29/71 and the non-Goldbach levels either side of it
REBALANCE (41–59): internal rebalance 41/59, internal rejection 47/53, equilibrium 50
The 6% blocks between layers (17–23, 35–41, 59–65, 77–83) contain no named level and are left unshaded. The read-out reports them as DEAD ZONE.
Because every PO3 is three times the previous one, ranges of different sizes nest exactly. The 729 on a 1-minute chart and the 729 shown as the parent on a 5-minute chart are the same grid.
CHOOSING THE RANGE SIZE
Four modes:
Auto by volatility (default): picks the PO3 whose 6% block takes about five bars of the current chart to cross, using a slow ATR. The choice is locked for the trading day and only moves when volatility has clearly shifted, so levels never jump mid-session. Different timeframes land on different sizes, and each chart's parent range is the next chart's working range.
Auto by timeframe: a fixed table — 1m/5m 27, 15m 81, 1H 243, 4H and daily 729, weekly 2187, monthly 6561.
Manual: any PO3 number.
Fractal: the working range becomes the layer band of a larger parent range that price is currently in, subdivided with the same Goldbach partition. Cut the parent by layer band or by adjacent Goldbach levels.
A separate toggle overlays the fractal fib inside whichever band price is in, in any mode.
OTHER SETTINGS
Number of ranges to draw above and below the active one
Shift the grid by a fraction of the PO3, or anchor it to a chosen historic price instead of zero
Every level group can be switched on or off individually; a premium/discount filter shows only one side
Optional midlevels (the consequent encroachment between adjacent Goldbach levels)
Labels as Goldbach numbers, layer names, both, or none; colours, line style, width and extension are all adjustable
Decimate input for forex (10000) and other instruments where one point is not one unit
READ-OUT TABLE
Symbol and active range · the band price is in (PREMIUM / DISCOUNT + layer, or DEAD ZONE) · position in the range as a percentage · range low and high · nearest level above and below with the distance in points · the size of one Goldbach block and of the current band.
ALERTS
Two alert() calls with dynamic messages, plus matching alertcondition() entries: a Goldbach level crossed on close (the message names the level), and price entering a new band.
NOTES
This script draws structure only. It does not generate signals or make predictions, and the levels carry no claim of predictive value — they are a consistent way of describing where price is within a fixed range. Works on any instrument and timeframe. Best used with the same PO3 mode on every chart you compare, so that the ranges agree.
Draws a Power-of-Three (PO3) dealing range and its Goldbach partition levels, colour-coded by layer, with a read-out of where price sits in the range.
WHAT IT DRAWS
A dealing range is a fixed block of price, sized by a PO3 number (27, 81, 243, 729, 2187, 6561), anchored so that the range low is an exact multiple of that number. Inside the range the script marks the Goldbach percentage levels:
0 · 3 · 7 · 11 · 17 · 23 · 29 · 35 · 41 · 47 · 50 · 53 · 59 · 65 · 71 · 77 · 83 · 89 · 93 · 97 · 100
These are grouped into three layers, each with its own colour and light shading:
LIQUIDITY (0–17 and 83–100): rejection block 3/97, last line of defence 7/93, order block 11/89, and the inversion point 17/83
FLOW (23–35 and 65–77): the sweet spot 29/71 and the non-Goldbach levels either side of it
REBALANCE (41–59): internal rebalance 41/59, internal rejection 47/53, equilibrium 50
The 6% blocks between layers (17–23, 35–41, 59–65, 77–83) contain no named level and are left unshaded. The read-out reports them as DEAD ZONE.
Because every PO3 is three times the previous one, ranges of different sizes nest exactly. The 729 on a 1-minute chart and the 729 shown as the parent on a 5-minute chart are the same grid.
CHOOSING THE RANGE SIZE
Four modes:
Auto by volatility (default): picks the PO3 whose 6% block takes about five bars of the current chart to cross, using a slow ATR. The choice is locked for the trading day and only moves when volatility has clearly shifted, so levels never jump mid-session. Different timeframes land on different sizes, and each chart's parent range is the next chart's working range.
Auto by timeframe: a fixed table — 1m/5m 27, 15m 81, 1H 243, 4H and daily 729, weekly 2187, monthly 6561.
Manual: any PO3 number.
Fractal: the working range becomes the layer band of a larger parent range that price is currently in, subdivided with the same Goldbach partition. Cut the parent by layer band or by adjacent Goldbach levels.
A separate toggle overlays the fractal fib inside whichever band price is in, in any mode.
OTHER SETTINGS
Number of ranges to draw above and below the active one
Shift the grid by a fraction of the PO3, or anchor it to a chosen historic price instead of zero
Every level group can be switched on or off individually; a premium/discount filter shows only one side
Optional midlevels (the consequent encroachment between adjacent Goldbach levels)
Labels as Goldbach numbers, layer names, both, or none; colours, line style, width and extension are all adjustable
Decimate input for forex (10000) and other instruments where one point is not one unit
READ-OUT TABLE
Symbol and active range · the band price is in (PREMIUM / DISCOUNT + layer, or DEAD ZONE) · position in the range as a percentage · range low and high · nearest level above and below with the distance in points · the size of one Goldbach block and of the current band.
ALERTS
Two alert() calls with dynamic messages, plus matching alertcondition() entries: a Goldbach level crossed on close (the message names the level), and price entering a new band.
NOTES
This script draws structure only. It does not generate signals or make predictions, and the levels carry no claim of predictive value — they are a consistent way of describing where price is within a fixed range. Works on any instrument and timeframe. Best used with the same PO3 mode on every chart you compare, so that the ranges agree.

إخلاء المسؤولية
لا يُقصد بالمعلومات والمنشورات أن تكون، أو تشكل، أي نصيحة مالية أو استثمارية أو تجارية أو أنواع أخرى من النصائح أو التوصيات المقدمة أو المعتمدة من TradingView. اقرأ المزيد في شروط الاستخدام.
إخلاء المسؤولية
لا يُقصد بالمعلومات والمنشورات أن تكون، أو تشكل، أي نصيحة مالية أو استثمارية أو تجارية أو أنواع أخرى من النصائح أو التوصيات المقدمة أو المعتمدة من TradingView. اقرأ المزيد في شروط الاستخدام.