Gold-DXY Correlation - Light
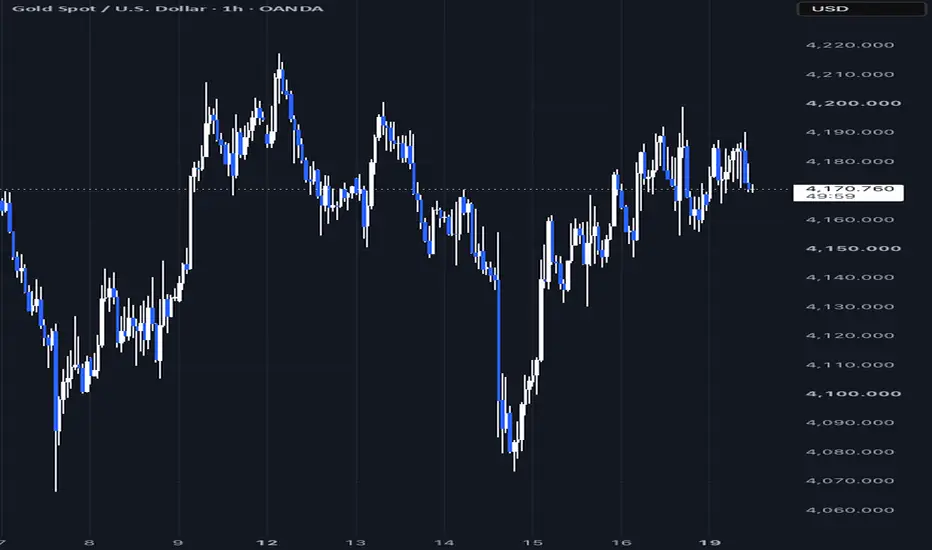
A clean rolling correlation between Gold (XAU/USD) and the US Dollar Index (DXY), computed on returns — the only mathematically sound way to measure correlation between two price series of different magnitudes. Sub-pane plot with a zero line, ±0.5 regime bands and a compact dashboard. Works on any pair of symbols, not just Gold/DXY.
WHAT IT DOES
• Takes the current chart (or a chosen primary symbol) and a reference symbol (default TVC:DXY).
• Converts both to returns (simple by default, log optional) — correlation on raw prices between series of different scales is meaningless.
• Computes a rolling correlation over a configurable window (default 50 bars).
• Colours the plot by regime: green below −0.5 (the usual Gold/DXY relationship), orange between −0.5 and +0.5 (decorrelated / transition), red above +0.5 (unusual — both moving together).
• Dashboard with the current value, regime label and symbol pair. Four alerts: flips to strong negative, strong positive, crosses zero up, crosses zero down.
WHY IT MATTERS
Gold and the Dollar are usually inversely related. When that relationship weakens or flips it is rarely random: a macro shift, a safe-haven episode, a central-bank surprise. Reading the correlation regime tells you whether the Dollar chart is currently a useful leading reference for Gold, or whether Gold is trading on its own drivers. The same logic applies to SPX / US10Y, BTC / DXY, EUR/USD / DXY, Copper / DXY.
HOW TO USE
1. Add the indicator on a Gold chart; leave "Use current chart as primary" on.
2. Or uncheck it and set any primary / reference pair.
3. Window: 50 bars by default; 100 on higher timeframes for a slower regime read, 20 on very short timeframes.
4. Green = normal regime, the Dollar is a valid reference; orange = Gold on its own drivers; red = unusual, both assets moving together — reduce assumptions.
5. Alerts notify you of regime flips in real time.
SETTINGS
Primary symbol · reference symbol · correlation length · log returns on/off · zero line and ±0.5 bands on/off · dashboard position and size.
NOTES
Uses TradingView's native data and ta.correlation on completed bars — no lookahead, no repainting. Pine Script v6, zero warnings.
No indicator is infallible. Correlation describes the recent past, not the next bar.
WHAT IT DOES
• Takes the current chart (or a chosen primary symbol) and a reference symbol (default TVC:DXY).
• Converts both to returns (simple by default, log optional) — correlation on raw prices between series of different scales is meaningless.
• Computes a rolling correlation over a configurable window (default 50 bars).
• Colours the plot by regime: green below −0.5 (the usual Gold/DXY relationship), orange between −0.5 and +0.5 (decorrelated / transition), red above +0.5 (unusual — both moving together).
• Dashboard with the current value, regime label and symbol pair. Four alerts: flips to strong negative, strong positive, crosses zero up, crosses zero down.
WHY IT MATTERS
Gold and the Dollar are usually inversely related. When that relationship weakens or flips it is rarely random: a macro shift, a safe-haven episode, a central-bank surprise. Reading the correlation regime tells you whether the Dollar chart is currently a useful leading reference for Gold, or whether Gold is trading on its own drivers. The same logic applies to SPX / US10Y, BTC / DXY, EUR/USD / DXY, Copper / DXY.
HOW TO USE
1. Add the indicator on a Gold chart; leave "Use current chart as primary" on.
2. Or uncheck it and set any primary / reference pair.
3. Window: 50 bars by default; 100 on higher timeframes for a slower regime read, 20 on very short timeframes.
4. Green = normal regime, the Dollar is a valid reference; orange = Gold on its own drivers; red = unusual, both assets moving together — reduce assumptions.
5. Alerts notify you of regime flips in real time.
SETTINGS
Primary symbol · reference symbol · correlation length · log returns on/off · zero line and ±0.5 bands on/off · dashboard position and size.
NOTES
Uses TradingView's native data and ta.correlation on completed bars — no lookahead, no repainting. Pine Script v6, zero warnings.
No indicator is infallible. Correlation describes the recent past, not the next bar.

Measured, not assumed. Full studies with sample sizes and confidence intervals: deltaterminal.io/research
إخلاء المسؤولية
لا يُقصد بالمعلومات والمنشورات أن تكون، أو تشكل، أي نصيحة مالية أو استثمارية أو تجارية أو أنواع أخرى من النصائح أو التوصيات المقدمة أو المعتمدة من TradingView. اقرأ المزيد في شروط الاستخدام.
Measured, not assumed. Full studies with sample sizes and confidence intervals: deltaterminal.io/research
إخلاء المسؤولية
لا يُقصد بالمعلومات والمنشورات أن تكون، أو تشكل، أي نصيحة مالية أو استثمارية أو تجارية أو أنواع أخرى من النصائح أو التوصيات المقدمة أو المعتمدة من TradingView. اقرأ المزيد في شروط الاستخدام.