OPEN-SOURCE SCRIPT
MASU+ Fib [BTT] (Update)
══════════════════════════════════════════
TRADINGVIEW DESCRIPTION
══════════════════════════════════════════
TITLE:
MASU+ Fib v2.0 [BTT]
SHORT DESCRIPTION:
Non-repainting Fibonacci retracement strategy with 5-layer confluence, MA ribbon, order flow, volatility regime, and MTF alignment. v2.0 fixes repainting.
══════════════════════════════════════════
FULL DESCRIPTION:
══════════════════════════════════════════
█ UPDATE v2.0 — REPAINTING FIX
This is a critical update. The previous version had a repainting issue that produced unrealistic backtest results, including trades opening and closing within seconds with impossibly tight SL/TP levels.
Root cause: calc_on_every_tick was enabled, allowing the strategy to execute on simulated intra-bar ticks during backtesting.
Fixed in v2.0:
— calc_on_every_tick = false
— All entries gated by barstate.isconfirmed (closed bars only)
— Trailing stop properly converted to ticks (/ syminfo.mintick)
— Dashboard uses barstate.islastconfirmedhistory
If you are using v1, please update immediately. Backtest results will be lower but now reflect real-world performance.
█ WHAT IS THIS?
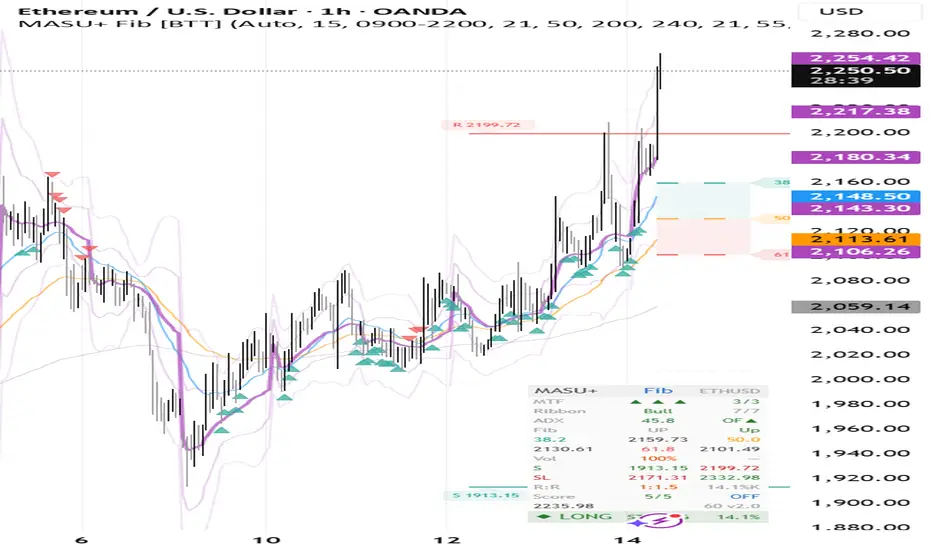
A multi-strategy system that combines trend following, breakout detection, and mean reversion with Fibonacci retracement analysis. Instead of Smart Money Concepts, this version uses dynamic Fibonacci swing detection to identify high-probability entry zones at the 38.2%, 50%, and 61.8% retracement levels.
█ FIBONACCI ENGINE
The strategy automatically detects swing highs and lows using a configurable lookback window, then calculates live Fibonacci retracement levels. Entry signals require price to touch a Fib level AND show a confirming candle pattern:
For longs (upswing retracement):
— Price pulls back to 38.2%, 50%, or 61.8% level
— Candle shows a bullish bounce: lower wick ≥ 25% of candle range, or bullish close above the Fib level
For shorts (downswing retracement):
— Price rallies to 38.2%, 50%, or 61.8% level
— Candle shows bearish rejection: upper wick ≥ 25% of candle range, or bearish close below the Fib level
Visual: Fib levels drawn as colored dashed lines with zone shading between 38.2–50% and 50–61.8%. Extension target at 61.8% above swing high.
█ THREE ENTRY STRATEGIES
The system runs three independent entry engines simultaneously:
Trend Following — EMA 21/50 crossover confirmed by EMA 200 direction and volume spike. Fires in trending markets (ADX > threshold).
Breakout — Price breaks above/below the Donchian channel (highest high / lowest low) with volume confirmation and EMA 200 alignment.
Mean Reversion — Price at Bollinger Band extreme with RSI reversal signal. Fires only in ranging markets (ADX ≤ threshold).
Each entry must pass all 5 confluence filters before execution.
█ 5-LAYER CONFLUENCE FILTERS
Every trade requires alignment across independent analysis layers:
1. MTF Filter — Higher timeframe (default 4H) EMA trend confirmation
2. MA Ribbon — 8-layer Fibonacci ribbon (8/13/21/34/55/89/144/233) with alignment threshold
3. Order Flow — VWAP position + CVD divergence + buy/sell volume delta
4. Fibonacci — Retracement support/resistance + bounce/rejection candle patterns
5. ADX — Minimum trend strength threshold
Confluence score: 0–5. Trades fire only when all enabled filters agree.
█ ORDER FLOW ANALYSIS
Built-in institutional flow detection:
— Session VWAP with ±1σ, ±2σ, ±3σ bands
— Cumulative Volume Delta (CVD) divergence detection
— Buy/sell volume ratio with configurable threshold
— Optional Volume Profile with Point of Control (POC)
█ VOLATILITY REGIME
Automatic market regime classification using dual metrics:
— Bollinger Band width expansion/contraction vs moving average
— ATR percentile ranking over 100 bars
The system identifies trending (expansion + high ATR) vs ranging (contraction + low ATR) environments and routes signals to the appropriate strategy engine.
█ RISK MANAGEMENT
— ATR-based stop loss (default 2.0× ATR)
— ATR-based take profit (default 3.0× ATR)
— Optional trailing stop (default 1.5× ATR) — properly tick-normalized in v2.0
— Kelly Criterion position sizing displayed on dashboard
— Session time filter with configurable trading hours
█ DASHBOARD
Light-themed compact panel (bottom-right) showing:
— MTF trend alignment (15m / 1h / 4h) with score
— MA Ribbon status and alignment count
— ADX value + Order Flow direction
— Fibonacci status (Support / Resist / Up / Down) with live levels
— Volatility percentile + volume pressure
— Support / Resistance levels
— SL / TP values
— Risk/Reward ratio + Kelly %
— Confluence score
— Current session + active signal
█ VISUALIZATION
— Fibonacci zone lines with shaded retracement bands
— Labeled price levels at 38.2%, 50%, 61.8%, and extension
— Diamond entry markers (green buy, red sell)
— Fib bounce/rejection triangles
— Signal background pulse
— Gradient trend candles (RSI-based color intensity)
— EMA lines (21, 50, 200)
— VWAP bands (toggleable)
— Dynamic Support/Resistance lines
— Active TP/SL lines when in position
█ USAGE
— Works on any instrument and timeframe
— Optimized for 15m–4H
— All filters independently toggleable
— Fibonacci parameters fully configurable (swing lookback, zone width, which levels to use)
— Does NOT repaint — backtest = live performance
█ CHANGELOG
v2.0 (current):
— Fixed repainting: calc_on_every_tick=false + barstate.isconfirmed
— Fixed trailing stop tick conversion
— Dashboard anti-repaint (islastconfirmedhistory)
— Version indicator in dashboard
v1.0:
— Initial release with Fibonacci engine replacing SMC
TRADINGVIEW DESCRIPTION
══════════════════════════════════════════
TITLE:
MASU+ Fib v2.0 [BTT]
SHORT DESCRIPTION:
Non-repainting Fibonacci retracement strategy with 5-layer confluence, MA ribbon, order flow, volatility regime, and MTF alignment. v2.0 fixes repainting.
══════════════════════════════════════════
FULL DESCRIPTION:
══════════════════════════════════════════
█ UPDATE v2.0 — REPAINTING FIX
This is a critical update. The previous version had a repainting issue that produced unrealistic backtest results, including trades opening and closing within seconds with impossibly tight SL/TP levels.
Root cause: calc_on_every_tick was enabled, allowing the strategy to execute on simulated intra-bar ticks during backtesting.
Fixed in v2.0:
— calc_on_every_tick = false
— All entries gated by barstate.isconfirmed (closed bars only)
— Trailing stop properly converted to ticks (/ syminfo.mintick)
— Dashboard uses barstate.islastconfirmedhistory
If you are using v1, please update immediately. Backtest results will be lower but now reflect real-world performance.
█ WHAT IS THIS?
A multi-strategy system that combines trend following, breakout detection, and mean reversion with Fibonacci retracement analysis. Instead of Smart Money Concepts, this version uses dynamic Fibonacci swing detection to identify high-probability entry zones at the 38.2%, 50%, and 61.8% retracement levels.
█ FIBONACCI ENGINE
The strategy automatically detects swing highs and lows using a configurable lookback window, then calculates live Fibonacci retracement levels. Entry signals require price to touch a Fib level AND show a confirming candle pattern:
For longs (upswing retracement):
— Price pulls back to 38.2%, 50%, or 61.8% level
— Candle shows a bullish bounce: lower wick ≥ 25% of candle range, or bullish close above the Fib level
For shorts (downswing retracement):
— Price rallies to 38.2%, 50%, or 61.8% level
— Candle shows bearish rejection: upper wick ≥ 25% of candle range, or bearish close below the Fib level
Visual: Fib levels drawn as colored dashed lines with zone shading between 38.2–50% and 50–61.8%. Extension target at 61.8% above swing high.
█ THREE ENTRY STRATEGIES
The system runs three independent entry engines simultaneously:
Trend Following — EMA 21/50 crossover confirmed by EMA 200 direction and volume spike. Fires in trending markets (ADX > threshold).
Breakout — Price breaks above/below the Donchian channel (highest high / lowest low) with volume confirmation and EMA 200 alignment.
Mean Reversion — Price at Bollinger Band extreme with RSI reversal signal. Fires only in ranging markets (ADX ≤ threshold).
Each entry must pass all 5 confluence filters before execution.
█ 5-LAYER CONFLUENCE FILTERS
Every trade requires alignment across independent analysis layers:
1. MTF Filter — Higher timeframe (default 4H) EMA trend confirmation
2. MA Ribbon — 8-layer Fibonacci ribbon (8/13/21/34/55/89/144/233) with alignment threshold
3. Order Flow — VWAP position + CVD divergence + buy/sell volume delta
4. Fibonacci — Retracement support/resistance + bounce/rejection candle patterns
5. ADX — Minimum trend strength threshold
Confluence score: 0–5. Trades fire only when all enabled filters agree.
█ ORDER FLOW ANALYSIS
Built-in institutional flow detection:
— Session VWAP with ±1σ, ±2σ, ±3σ bands
— Cumulative Volume Delta (CVD) divergence detection
— Buy/sell volume ratio with configurable threshold
— Optional Volume Profile with Point of Control (POC)
█ VOLATILITY REGIME
Automatic market regime classification using dual metrics:
— Bollinger Band width expansion/contraction vs moving average
— ATR percentile ranking over 100 bars
The system identifies trending (expansion + high ATR) vs ranging (contraction + low ATR) environments and routes signals to the appropriate strategy engine.
█ RISK MANAGEMENT
— ATR-based stop loss (default 2.0× ATR)
— ATR-based take profit (default 3.0× ATR)
— Optional trailing stop (default 1.5× ATR) — properly tick-normalized in v2.0
— Kelly Criterion position sizing displayed on dashboard
— Session time filter with configurable trading hours
█ DASHBOARD
Light-themed compact panel (bottom-right) showing:
— MTF trend alignment (15m / 1h / 4h) with score
— MA Ribbon status and alignment count
— ADX value + Order Flow direction
— Fibonacci status (Support / Resist / Up / Down) with live levels
— Volatility percentile + volume pressure
— Support / Resistance levels
— SL / TP values
— Risk/Reward ratio + Kelly %
— Confluence score
— Current session + active signal
█ VISUALIZATION
— Fibonacci zone lines with shaded retracement bands
— Labeled price levels at 38.2%, 50%, 61.8%, and extension
— Diamond entry markers (green buy, red sell)
— Fib bounce/rejection triangles
— Signal background pulse
— Gradient trend candles (RSI-based color intensity)
— EMA lines (21, 50, 200)
— VWAP bands (toggleable)
— Dynamic Support/Resistance lines
— Active TP/SL lines when in position
█ USAGE
— Works on any instrument and timeframe
— Optimized for 15m–4H
— All filters independently toggleable
— Fibonacci parameters fully configurable (swing lookback, zone width, which levels to use)
— Does NOT repaint — backtest = live performance
█ CHANGELOG
v2.0 (current):
— Fixed repainting: calc_on_every_tick=false + barstate.isconfirmed
— Fixed trailing stop tick conversion
— Dashboard anti-repaint (islastconfirmedhistory)
— Version indicator in dashboard
v1.0:
— Initial release with Fibonacci engine replacing SMC
نص برمجي مفتوح المصدر
بروح TradingView الحقيقية، قام مبتكر هذا النص البرمجي بجعله مفتوح المصدر، بحيث يمكن للمتداولين مراجعة وظائفه والتحقق منها. شكرا للمؤلف! بينما يمكنك استخدامه مجانًا، تذكر أن إعادة نشر الكود يخضع لقواعد الموقع الخاصة بنا.

إخلاء المسؤولية
لا يُقصد بالمعلومات والمنشورات أن تكون، أو تشكل، أي نصيحة مالية أو استثمارية أو تجارية أو أنواع أخرى من النصائح أو التوصيات المقدمة أو المعتمدة من TradingView. اقرأ المزيد في شروط الاستخدام.
نص برمجي مفتوح المصدر
بروح TradingView الحقيقية، قام مبتكر هذا النص البرمجي بجعله مفتوح المصدر، بحيث يمكن للمتداولين مراجعة وظائفه والتحقق منها. شكرا للمؤلف! بينما يمكنك استخدامه مجانًا، تذكر أن إعادة نشر الكود يخضع لقواعد الموقع الخاصة بنا.
إخلاء المسؤولية
لا يُقصد بالمعلومات والمنشورات أن تكون، أو تشكل، أي نصيحة مالية أو استثمارية أو تجارية أو أنواع أخرى من النصائح أو التوصيات المقدمة أو المعتمدة من TradingView. اقرأ المزيد في شروط الاستخدام.