OPEN-SOURCE SCRIPT
MTF LIVE SMA Heatmap
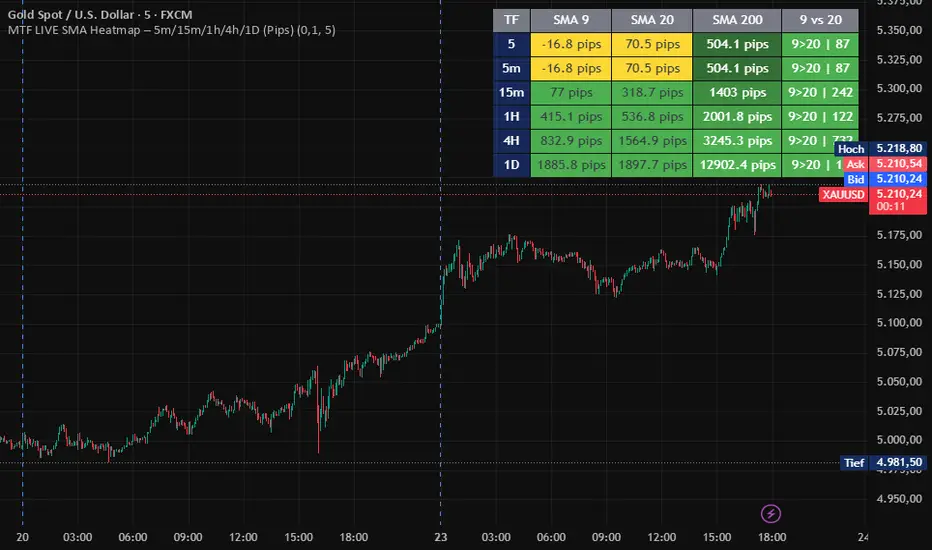
This tool displays a multi‑timeframe heatmap for SMA 9, SMA 20, and SMA 200.
It combines trend direction, pip distance, and market structure in a compact table.
Features
Pip distance between price and SMA (automatically calculated for each symbol)
Yellow highlight when price is between SMA 9 and SMA 20
Green when price is above both SMAs
Red when price is below both SMAs
SMA‑200 heatmap based on percentage distance (with neutral zone)
Trend comparison 9 vs 20 (9>20, 20>9, or neutral)
Additional row for the current timeframe
Supports Forex, Gold, Silver, Indices, Crypto, and Energies
Pip Engine
A universal pip engine automatically detects the correct pip size for each symbol
(e.g., XAU = 0.10, XAG = 0.01, BTC = 1.0, EURUSD = 0.0001, etc.).
Use Cases
Perfect for:
Trend filtering
Multi‑TF confirmation
Scalping / intraday trading
Identifying transition zones (yellow area)
SMA cluster analysis
9to20 Pip Distance
It combines trend direction, pip distance, and market structure in a compact table.
Features
Pip distance between price and SMA (automatically calculated for each symbol)
Yellow highlight when price is between SMA 9 and SMA 20
Green when price is above both SMAs
Red when price is below both SMAs
SMA‑200 heatmap based on percentage distance (with neutral zone)
Trend comparison 9 vs 20 (9>20, 20>9, or neutral)
Additional row for the current timeframe
Supports Forex, Gold, Silver, Indices, Crypto, and Energies
Pip Engine
A universal pip engine automatically detects the correct pip size for each symbol
(e.g., XAU = 0.10, XAG = 0.01, BTC = 1.0, EURUSD = 0.0001, etc.).
Use Cases
Perfect for:
Trend filtering
Multi‑TF confirmation
Scalping / intraday trading
Identifying transition zones (yellow area)
SMA cluster analysis
9to20 Pip Distance
نص برمجي مفتوح المصدر
بروح TradingView الحقيقية، قام مبتكر هذا النص البرمجي بجعله مفتوح المصدر، بحيث يمكن للمتداولين مراجعة وظائفه والتحقق منها. شكرا للمؤلف! بينما يمكنك استخدامه مجانًا، تذكر أن إعادة نشر الكود يخضع لقواعد الموقع الخاصة بنا.

إخلاء المسؤولية
لا يُقصد بالمعلومات والمنشورات أن تكون، أو تشكل، أي نصيحة مالية أو استثمارية أو تجارية أو أنواع أخرى من النصائح أو التوصيات المقدمة أو المعتمدة من TradingView. اقرأ المزيد في شروط الاستخدام.
نص برمجي مفتوح المصدر
بروح TradingView الحقيقية، قام مبتكر هذا النص البرمجي بجعله مفتوح المصدر، بحيث يمكن للمتداولين مراجعة وظائفه والتحقق منها. شكرا للمؤلف! بينما يمكنك استخدامه مجانًا، تذكر أن إعادة نشر الكود يخضع لقواعد الموقع الخاصة بنا.
إخلاء المسؤولية
لا يُقصد بالمعلومات والمنشورات أن تكون، أو تشكل، أي نصيحة مالية أو استثمارية أو تجارية أو أنواع أخرى من النصائح أو التوصيات المقدمة أو المعتمدة من TradingView. اقرأ المزيد في شروط الاستخدام.