تم تحديثه
The Islnd Tap and Fill
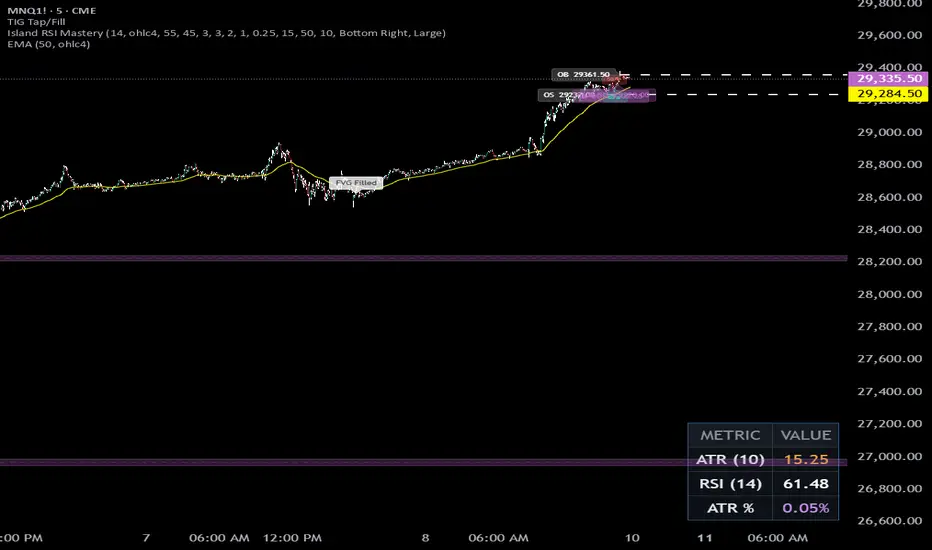
The Islnd Tap and Fill indicator automatically identifies and visualizes Bullish and Bearish Gaps using a three‑candle pattern.
It plots colored zones extended to the right, draws an optional midline with price labels, and tracks each gap’s lifecycle.
When price first trades back into a gap, the indicator marks a “Tap”; when price fully closes through the gap, it removes the zone and associated markings and prints an “FVG Filled” label.
This provides a clear, structured view of where price has left and later revisited imbalanced areas, supporting precise entry, management, and exit decisions.
It plots colored zones extended to the right, draws an optional midline with price labels, and tracks each gap’s lifecycle.
When price first trades back into a gap, the indicator marks a “Tap”; when price fully closes through the gap, it removes the zone and associated markings and prints an “FVG Filled” label.
This provides a clear, structured view of where price has left and later revisited imbalanced areas, supporting precise entry, management, and exit decisions.
ملاحظات الأخبار
Improved v2.0
إخلاء المسؤولية
لا يُقصد بالمعلومات والمنشورات أن تكون، أو تشكل، أي نصيحة مالية أو استثمارية أو تجارية أو أنواع أخرى من النصائح أو التوصيات المقدمة أو المعتمدة من TradingView. اقرأ المزيد في شروط الاستخدام.
إخلاء المسؤولية
لا يُقصد بالمعلومات والمنشورات أن تكون، أو تشكل، أي نصيحة مالية أو استثمارية أو تجارية أو أنواع أخرى من النصائح أو التوصيات المقدمة أو المعتمدة من TradingView. اقرأ المزيد في شروط الاستخدام.