تم تحديثه
Fractal Structure & Momentum v0.3
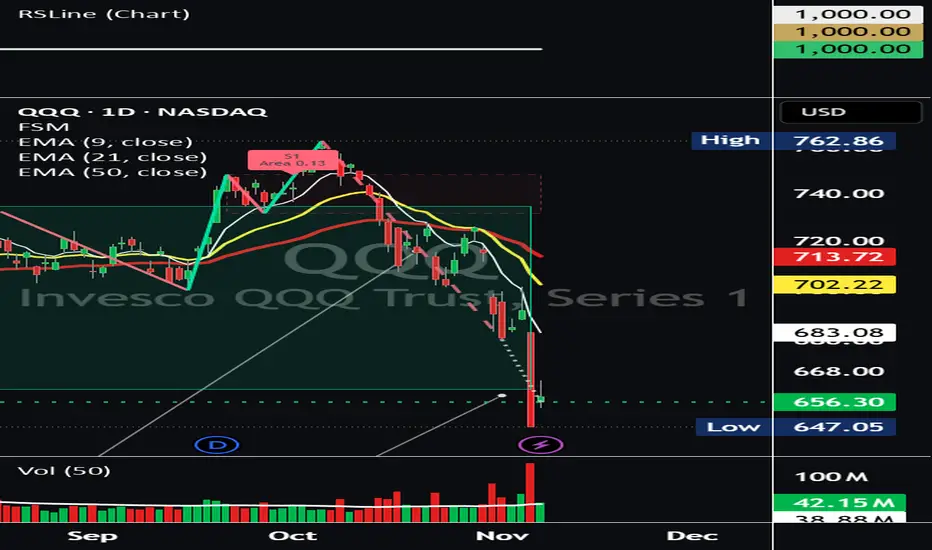
**Fractal Structure & Momentum (FSM)**
FSM maps price swings, consolidation zones and momentum changes directly on the price chart. It brings structural patterns, completed Weekly context, relative strength and setup invalidation levels into one framework for swing and position trading.
**How it works**
The indicator merges overlapping candle ranges directionally, identifies confirmed fractal turning points and connects qualifying endpoints into swings. Overlap between three completed swings forms a consolidation zone. An optional coarser swing guide provides a broader view of price structure.
Bright teal and coral distinguish rising and falling swings. Blue and lavender identify the coarser guide. Developing paths use dashed or dotted lines. Colors, widths and drawing visibility are adjustable.
**Understanding the labels**
B labels identify buy-side patterns; S labels identify sell-side patterns:
- **B1 / S1 — Momentum divergence:** Price reaches a new swing extreme while directional MACD histogram area decreases compared with the previous same-direction swing.
- **B2 / S2 — First respectful pullback:** The first subsequent same-side endpoint holds the preceding B1 low or S1 high. Equal prices qualify.
- **B3 / S3 — Consolidation retest:** After leaving a consolidation core, the first retest holds above its upper boundary for B3 or below its lower boundary for S3. Equal boundaries qualify.
Multiple qualifying patterns can share a combined label.
The optional **Area** value compares the current swing’s directional MACD histogram area with the previous same-direction swing. An Area ratio of 0.50 means half as much directional area. MACD defaults to 12/26/9.
**Weekly, market and relative-strength context**
Signal tooltips preserve the context available when each event was detected:
- **Weekly structure:** Completed Weekly endpoints identify higher-high/higher-low, lower-high/lower-low or mixed structure. Weekly consolidation boundaries and recent issued momentum-divergence signals provide additional context. On lower timeframes, the calculation uses the preceding completed Weekly snapshot.
- **Market caution:** QQQ below its Daily 50 EMA produces a caution condition. All structural signals remain available. The market symbol and EMA length are adjustable.
- **Relative strength:** Compares the stock’s performance against QQQ, SOXX, SPY or a custom benchmark. The default window is 20 chart bars, with both prices expressed in USD. A local-price comparison is also available.
Optional compact tags show Weekly agreement, market caution and relative-strength direction. Source timestamps appear in tooltips because international markets can close at different times. Weekly alignment can remain mixed or unavailable while sufficient structure develops.
**Setup invalidation**
The indicator can display the latest active invalidation boundary for each side. By default, the boundary is the detected pattern’s low or high. An optional setting uses the relevant consolidation boundary for B3/S3 patterns.
A buy-side setup is invalidated by a close strictly below its boundary. A sell-side setup is invalidated by a close strictly above it. Equal closes and wick-only excursions preserve the setup.
Boundaries remain fixed after issuance. A new same-side setup replaces the previous one. Delayed structural confirmation can produce a setup that is already beyond its boundary at detection; this receives a separate flag.
**Optional earlier warnings**
Experimental **EW B? / EW S?** observations highlight developing reversal evidence before an opposite structural endpoint is accepted.
Default conditions combine a developing move of at least 2 ATR, a reversal of at least 0.75 ATR, and a matching change in closing price and MACD histogram direction. ATR defaults to 14 periods.
Earlier warnings and their alert conditions are disabled by default. They can fail, expire or finish without becoming a confirmed B/S pattern. Existing question-mark endpoint previews remain separately adjustable.
**Signal timing and changing drawings**
Labels default to the candle where the structural event becomes available, positioned at the structural endpoint’s price. Confirmation can arrive substantially after the original turning point, particularly on Weekly charts.
The optional historical-anchor setting places labels at earlier turning points and retains markers on the actual detection candles. Alerts always use the closed detection candle.
Developing paths and question-mark previews can change. Later fractals can also revise swing, consolidation and coarse-guide geometry. Issued event records retain their original coordinates, detection time, captured context and invalidation boundary within the calculation run. Changes to settings, loaded history or provider data can alter a full recalculation.
**Using FSM**
Start with standard Daily or Weekly candles and the default settings. Hover over signal labels for timing and context. Additional diagnostics are available in the Data Window, while the chart legend stays compact.
Alerts cover structural patterns, Weekly agreement, market caution, setup invalidation, structural revisions and optional earlier warnings.
FSM remains an experimental structural-analysis indicator. Trading performance and signal accuracy have yet to be established.
FSM maps price swings, consolidation zones and momentum changes directly on the price chart. It brings structural patterns, completed Weekly context, relative strength and setup invalidation levels into one framework for swing and position trading.
**How it works**
The indicator merges overlapping candle ranges directionally, identifies confirmed fractal turning points and connects qualifying endpoints into swings. Overlap between three completed swings forms a consolidation zone. An optional coarser swing guide provides a broader view of price structure.
Bright teal and coral distinguish rising and falling swings. Blue and lavender identify the coarser guide. Developing paths use dashed or dotted lines. Colors, widths and drawing visibility are adjustable.
**Understanding the labels**
B labels identify buy-side patterns; S labels identify sell-side patterns:
- **B1 / S1 — Momentum divergence:** Price reaches a new swing extreme while directional MACD histogram area decreases compared with the previous same-direction swing.
- **B2 / S2 — First respectful pullback:** The first subsequent same-side endpoint holds the preceding B1 low or S1 high. Equal prices qualify.
- **B3 / S3 — Consolidation retest:** After leaving a consolidation core, the first retest holds above its upper boundary for B3 or below its lower boundary for S3. Equal boundaries qualify.
Multiple qualifying patterns can share a combined label.
The optional **Area** value compares the current swing’s directional MACD histogram area with the previous same-direction swing. An Area ratio of 0.50 means half as much directional area. MACD defaults to 12/26/9.
**Weekly, market and relative-strength context**
Signal tooltips preserve the context available when each event was detected:
- **Weekly structure:** Completed Weekly endpoints identify higher-high/higher-low, lower-high/lower-low or mixed structure. Weekly consolidation boundaries and recent issued momentum-divergence signals provide additional context. On lower timeframes, the calculation uses the preceding completed Weekly snapshot.
- **Market caution:** QQQ below its Daily 50 EMA produces a caution condition. All structural signals remain available. The market symbol and EMA length are adjustable.
- **Relative strength:** Compares the stock’s performance against QQQ, SOXX, SPY or a custom benchmark. The default window is 20 chart bars, with both prices expressed in USD. A local-price comparison is also available.
Optional compact tags show Weekly agreement, market caution and relative-strength direction. Source timestamps appear in tooltips because international markets can close at different times. Weekly alignment can remain mixed or unavailable while sufficient structure develops.
**Setup invalidation**
The indicator can display the latest active invalidation boundary for each side. By default, the boundary is the detected pattern’s low or high. An optional setting uses the relevant consolidation boundary for B3/S3 patterns.
A buy-side setup is invalidated by a close strictly below its boundary. A sell-side setup is invalidated by a close strictly above it. Equal closes and wick-only excursions preserve the setup.
Boundaries remain fixed after issuance. A new same-side setup replaces the previous one. Delayed structural confirmation can produce a setup that is already beyond its boundary at detection; this receives a separate flag.
**Optional earlier warnings**
Experimental **EW B? / EW S?** observations highlight developing reversal evidence before an opposite structural endpoint is accepted.
Default conditions combine a developing move of at least 2 ATR, a reversal of at least 0.75 ATR, and a matching change in closing price and MACD histogram direction. ATR defaults to 14 periods.
Earlier warnings and their alert conditions are disabled by default. They can fail, expire or finish without becoming a confirmed B/S pattern. Existing question-mark endpoint previews remain separately adjustable.
**Signal timing and changing drawings**
Labels default to the candle where the structural event becomes available, positioned at the structural endpoint’s price. Confirmation can arrive substantially after the original turning point, particularly on Weekly charts.
The optional historical-anchor setting places labels at earlier turning points and retains markers on the actual detection candles. Alerts always use the closed detection candle.
Developing paths and question-mark previews can change. Later fractals can also revise swing, consolidation and coarse-guide geometry. Issued event records retain their original coordinates, detection time, captured context and invalidation boundary within the calculation run. Changes to settings, loaded history or provider data can alter a full recalculation.
**Using FSM**
Start with standard Daily or Weekly candles and the default settings. Hover over signal labels for timing and context. Additional diagnostics are available in the Data Window, while the chart legend stays compact.
Alerts cover structural patterns, Weekly agreement, market caution, setup invalidation, structural revisions and optional earlier warnings.
FSM remains an experimental structural-analysis indicator. Trading performance and signal accuracy have yet to be established.
ملاحظات الأخبار
**Update: Clearer, simpler hover descriptions**Signal descriptions now use everyday language to make the indicator easier to understand.
- Each pattern includes a short explanation, such as **“Possible rebound”** or **“Pullback held.”**
- **Price low / Price high** identifies the original turning point. **Signal appeared** shows when the indicator had enough information to confirm it.
- Weekly direction now reads **Up**, **Down** or **No clear trend**.
- Market conditions and performance against your chosen benchmark have shorter explanations.
- Developing patterns and early warnings have clearer descriptions and follow-up messages.
- Label-placement settings now use **“When signal appears”** and **“At the earlier price turn.”**
For exact timestamps, weekly price ranges, momentum measurements and currency details, enable **“Show extra details when hovering”** in settings. This option is off by default.
Signal calculations and alert conditions are unchanged.

@StocksMathPoker on X
1amInvesting.com
1amInvesting.com
إخلاء المسؤولية
لا يُقصد بالمعلومات والمنشورات أن تكون، أو تشكل، أي نصيحة مالية أو استثمارية أو تجارية أو أنواع أخرى من النصائح أو التوصيات المقدمة أو المعتمدة من TradingView. اقرأ المزيد في شروط الاستخدام.
@StocksMathPoker on X
1amInvesting.com
1amInvesting.com
إخلاء المسؤولية
لا يُقصد بالمعلومات والمنشورات أن تكون، أو تشكل، أي نصيحة مالية أو استثمارية أو تجارية أو أنواع أخرى من النصائح أو التوصيات المقدمة أو المعتمدة من TradingView. اقرأ المزيد في شروط الاستخدام.