Swiftedge Oderflow Tool
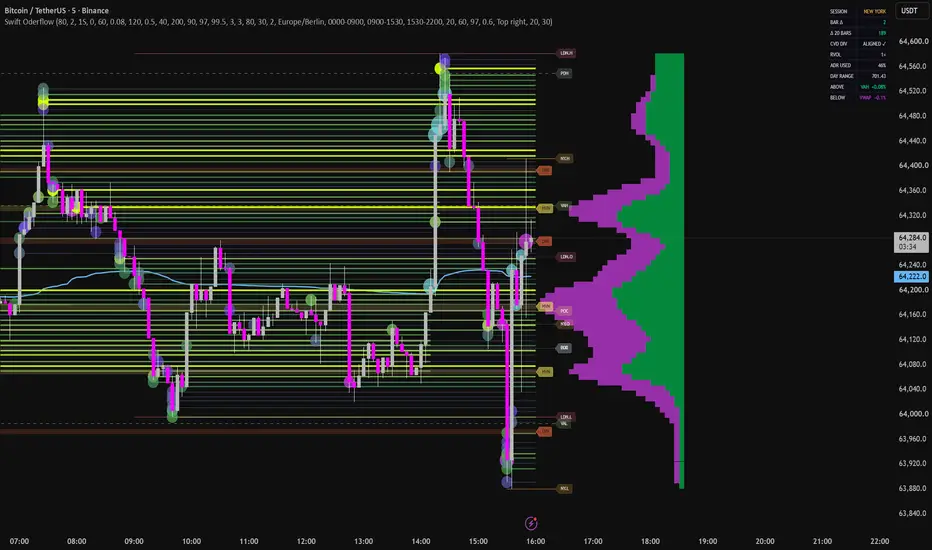
Swiftedge Oderflow Tool
OVERVIEW
This indicator is an all-in-one orderflow toolkit that visualizes where significant traded volume has built up, whether those levels have been revisited, and how current activity compares to recent norms. It combines six modules that share one calculation engine:
Liquidity lines — horizontal levels born on the candle that built the volume, running until price trades back through them
Trade bubbles — outsized volume prints, colored by delta
A buy/sell split volume profile anchored at the price axis
HVN / LVN reaction zones detected from the profile
Session levels (Asia / London / New York), daily levels (PDH / PDL / PDC), session VWAP and a developing value area (POC / VAH / VAL)
A dashboard with bar delta, CVD divergence, relative volume, ADR usage and the nearest level above/below price
Every module can be toggled independently, so the indicator can run as a minimal liquidity map or a full cockpit.
HOW IT WORKS
Volume distribution. Each chart bar is decomposed into lower-timeframe candles (1-minute by default, configurable down to seconds where your plan provides them). Each LTF candle's volume is booked to a price bin at its close, and classified as buy or sell volume by its candle direction. Where LTF data is unavailable (older history), the bar's volume is spread evenly across its high-low range as a fallback.
Liquidity lines. A price bin that accumulates a significant share of volume (relative-strength threshold, configurable) spawns a line. The line is anchored to the bar that contributed the most volume to that level, and is plotted at the level's volume-weighted price — not at a rounded grid price. While the level remains untouched it extends to the right edge of the chart. When price trades through the level, its accumulated strength is "burned" (configurable percentage per bar); once it falls below the threshold the line is closed at that bar. Untouched liquidity therefore persists visibly, while consumed liquidity ends exactly where it was consumed. Color and line width scale with the level's peak strength, normalized against the 95th percentile of visible levels; old mitigated lines fade progressively.
Visible-range adaptation. The engine reads the chart's visible range and recalculates on every scroll or zoom. Level resolution (bin size) is derived from the visible price span, so the map keeps a consistent density at any zoom level. A warm-up window (one quarter of the visible span) is processed before the left edge so lines do not start "cold".
Bubbles. A bar whose volume exceeds a configurable percentile of recent bars (defaults: 90 / 97 / 99.5 for small / medium / large) prints a circle at its close, colored by the bar's delta sign.
Volume profile. Built from the visible bars, with each bar's volume spread across its full high-low range, split into buy and sell volume, and smoothed with a 1-2-1 kernel (configurable passes). It is drawn against a fixed wall at the right edge, growing inward, with the buy portion (green) and sell portion (magenta) stacked per row.
HVN / LVN zones. From the smoothed profile, HVNs are the largest local peaks (with a minimum substance filter) and LVNs are the deepest local valleys that sit between populated areas (range edges are excluded). The top N of each (default 3) are drawn as translucent horizontal zones across the visible range with small tags at the right edge.
Sessions, daily levels, VWAP, value area. Session open/high/low are tracked per configurable session windows and timezone and reset daily. PDH / PDL / PDC come from the completed prior daily candle (fetched with lookahead on closed data only — no future leak). VWAP accumulates hlc3 × volume from the daily open. The developing value area builds today's volume distribution and expands from the POC until 70% of volume is captured, yielding POC / VAH / VAL.
Absorption flags. A diamond marks bars with volume above a high percentile but an unusually small range (fraction of ATR14): heavy business transacted without price progress — a classic absorption footprint. Below-bar green diamonds indicate positive delta, above-bar magenta diamonds negative delta.
Dashboard. Bar delta and N-bar delta sum (from the LTF decomposition), a CVD-vs-price divergence check over a configurable lookback, relative volume vs its 20-bar average, day range as a percentage of the average daily range, the active session, and the nearest tracked level above and below current price with distance in percent.
HOW TO USE IT
Untouched liquidity lines act as a map of levels the market has built but not yet retested; strong (bright, thick) untouched lines are natural magnets and reaction candidates.
A line ending shows you exactly where and when that liquidity was consumed.
HVN zones mark acceptance (price tends to slow down and two-way trade there); LVN zones mark rejection/vacuum areas (price tends to move through them quickly or turn at their edge).
Session highs/lows and PDH/PDL are widely watched reference levels; combined with the liquidity map you can see whether volume actually built at them.
The dashboard's divergence row flags when price makes progress that cumulative delta does not confirm.
Use the companion CVD panel script for the delta curve in a separate pane.
SETTINGS NOTES
Defaults are tuned for liquid crypto and index futures on intraday timeframes (1-15 min). The lower timeframe input controls distribution precision: "1" (minute) works broadly; second-based timeframes increase precision on recent data where your subscription provides them. Session times default to a European timezone and should be adjusted to your market.
LIMITATIONS — PLEASE READ
TradingView does not provide order book (L2) or bid/ask tape data to Pine. All volume placement and delta in this indicator are approximations built from lower-timeframe OHLCV data. This is a principled approximation, not actual resting orders or true tape delta.
The indicator draws in the visible range and recalculates when you scroll or zoom; drawings therefore adapt to the window you are viewing. The heavy rendering runs once per bar close, so the newest bar's lines can update with up to one bar of delay.
Lower-timeframe history is limited by TradingView; on older history the fallback distribution (bar range spread) is used, which is coarser.
Volume must be provided by your data feed; on symbols without volume the indicator cannot work.
This is a visualization and context tool. It generates no signals and no performance claims are made or implied.
OVERVIEW
This indicator is an all-in-one orderflow toolkit that visualizes where significant traded volume has built up, whether those levels have been revisited, and how current activity compares to recent norms. It combines six modules that share one calculation engine:
Liquidity lines — horizontal levels born on the candle that built the volume, running until price trades back through them
Trade bubbles — outsized volume prints, colored by delta
A buy/sell split volume profile anchored at the price axis
HVN / LVN reaction zones detected from the profile
Session levels (Asia / London / New York), daily levels (PDH / PDL / PDC), session VWAP and a developing value area (POC / VAH / VAL)
A dashboard with bar delta, CVD divergence, relative volume, ADR usage and the nearest level above/below price
Every module can be toggled independently, so the indicator can run as a minimal liquidity map or a full cockpit.
HOW IT WORKS
Volume distribution. Each chart bar is decomposed into lower-timeframe candles (1-minute by default, configurable down to seconds where your plan provides them). Each LTF candle's volume is booked to a price bin at its close, and classified as buy or sell volume by its candle direction. Where LTF data is unavailable (older history), the bar's volume is spread evenly across its high-low range as a fallback.
Liquidity lines. A price bin that accumulates a significant share of volume (relative-strength threshold, configurable) spawns a line. The line is anchored to the bar that contributed the most volume to that level, and is plotted at the level's volume-weighted price — not at a rounded grid price. While the level remains untouched it extends to the right edge of the chart. When price trades through the level, its accumulated strength is "burned" (configurable percentage per bar); once it falls below the threshold the line is closed at that bar. Untouched liquidity therefore persists visibly, while consumed liquidity ends exactly where it was consumed. Color and line width scale with the level's peak strength, normalized against the 95th percentile of visible levels; old mitigated lines fade progressively.
Visible-range adaptation. The engine reads the chart's visible range and recalculates on every scroll or zoom. Level resolution (bin size) is derived from the visible price span, so the map keeps a consistent density at any zoom level. A warm-up window (one quarter of the visible span) is processed before the left edge so lines do not start "cold".
Bubbles. A bar whose volume exceeds a configurable percentile of recent bars (defaults: 90 / 97 / 99.5 for small / medium / large) prints a circle at its close, colored by the bar's delta sign.
Volume profile. Built from the visible bars, with each bar's volume spread across its full high-low range, split into buy and sell volume, and smoothed with a 1-2-1 kernel (configurable passes). It is drawn against a fixed wall at the right edge, growing inward, with the buy portion (green) and sell portion (magenta) stacked per row.
HVN / LVN zones. From the smoothed profile, HVNs are the largest local peaks (with a minimum substance filter) and LVNs are the deepest local valleys that sit between populated areas (range edges are excluded). The top N of each (default 3) are drawn as translucent horizontal zones across the visible range with small tags at the right edge.
Sessions, daily levels, VWAP, value area. Session open/high/low are tracked per configurable session windows and timezone and reset daily. PDH / PDL / PDC come from the completed prior daily candle (fetched with lookahead on closed data only — no future leak). VWAP accumulates hlc3 × volume from the daily open. The developing value area builds today's volume distribution and expands from the POC until 70% of volume is captured, yielding POC / VAH / VAL.
Absorption flags. A diamond marks bars with volume above a high percentile but an unusually small range (fraction of ATR14): heavy business transacted without price progress — a classic absorption footprint. Below-bar green diamonds indicate positive delta, above-bar magenta diamonds negative delta.
Dashboard. Bar delta and N-bar delta sum (from the LTF decomposition), a CVD-vs-price divergence check over a configurable lookback, relative volume vs its 20-bar average, day range as a percentage of the average daily range, the active session, and the nearest tracked level above and below current price with distance in percent.
HOW TO USE IT
Untouched liquidity lines act as a map of levels the market has built but not yet retested; strong (bright, thick) untouched lines are natural magnets and reaction candidates.
A line ending shows you exactly where and when that liquidity was consumed.
HVN zones mark acceptance (price tends to slow down and two-way trade there); LVN zones mark rejection/vacuum areas (price tends to move through them quickly or turn at their edge).
Session highs/lows and PDH/PDL are widely watched reference levels; combined with the liquidity map you can see whether volume actually built at them.
The dashboard's divergence row flags when price makes progress that cumulative delta does not confirm.
Use the companion CVD panel script for the delta curve in a separate pane.
SETTINGS NOTES
Defaults are tuned for liquid crypto and index futures on intraday timeframes (1-15 min). The lower timeframe input controls distribution precision: "1" (minute) works broadly; second-based timeframes increase precision on recent data where your subscription provides them. Session times default to a European timezone and should be adjusted to your market.
LIMITATIONS — PLEASE READ
TradingView does not provide order book (L2) or bid/ask tape data to Pine. All volume placement and delta in this indicator are approximations built from lower-timeframe OHLCV data. This is a principled approximation, not actual resting orders or true tape delta.
The indicator draws in the visible range and recalculates when you scroll or zoom; drawings therefore adapt to the window you are viewing. The heavy rendering runs once per bar close, so the newest bar's lines can update with up to one bar of delay.
Lower-timeframe history is limited by TradingView; on older history the fallback distribution (bar range spread) is used, which is coarser.
Volume must be provided by your data feed; on symbols without volume the indicator cannot work.
This is a visualization and context tool. It generates no signals and no performance claims are made or implied.

Free live order book heatmap, footprint and CVD for BTC, gold and 7 more markets: swiftedge.uk/bitcoin-order-book-heatmap
إخلاء المسؤولية
لا يُقصد بالمعلومات والمنشورات أن تكون، أو تشكل، أي نصيحة مالية أو استثمارية أو تجارية أو أنواع أخرى من النصائح أو التوصيات المقدمة أو المعتمدة من TradingView. اقرأ المزيد في شروط الاستخدام.
Free live order book heatmap, footprint and CVD for BTC, gold and 7 more markets: swiftedge.uk/bitcoin-order-book-heatmap
إخلاء المسؤولية
لا يُقصد بالمعلومات والمنشورات أن تكون، أو تشكل، أي نصيحة مالية أو استثمارية أو تجارية أو أنواع أخرى من النصائح أو التوصيات المقدمة أو المعتمدة من TradingView. اقرأ المزيد في شروط الاستخدام.