MTC - Forex Estimated Price Areas
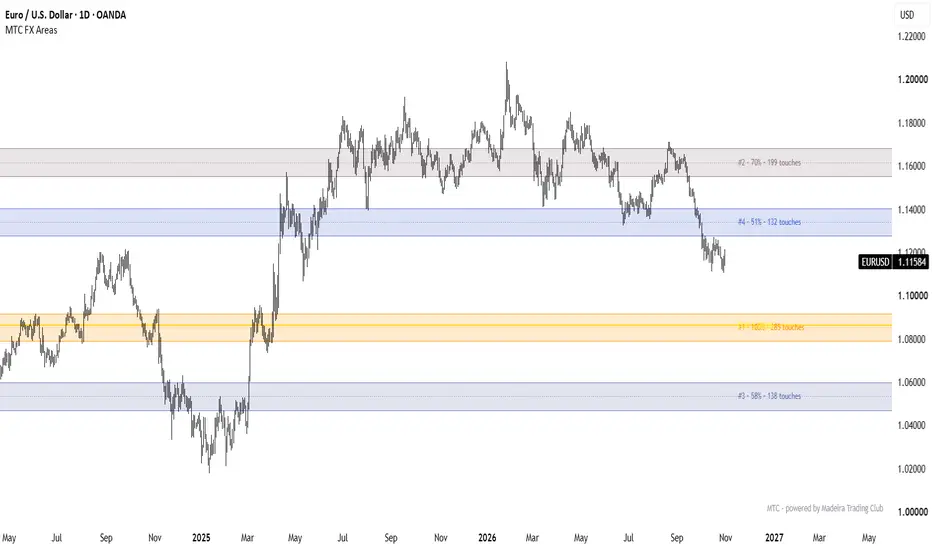
MTC - Forex Estimated Price Areas
Powered by Madeira Trading Club
What it does: the indicator looks back over a chosen number of months and splits that price range into small horizontal rows. It counts how many times price touched each row. The rows that were touched most form the Estimated Price Areas: the levels where the market spent the most time or kept coming back to. These often act as support, resistance, or magnets for price. The strongest single price is marked as the POC (Point of Control).
Lookback
Lookback (months) [60]: how many months of history are used for the calculation.
Window start [Rolling]
Rolling: exactly N months back from the last bar.
Start of month: from the 1st day of the month N months ago, so the window always starts on a whole month.
Max bars in the window [50000]: a safety limit for low timeframes. On 1H, 60 months is about 31,000 bars. If your chart loads less history than you ask for, the indicator uses whatever is available.
Calculation
Row size [Number of rows]: how the price range is divided.
Number of rows: the range is split into a fixed number of rows.
Fixed pips: every row has the same height in pips.
Number of rows [120]: used in Number of rows mode. More rows give more precise but thinner areas.
Row size (pips) [10]: used in Fixed pips mode.
Pip size (0 = auto) [0]: on forex, auto uses 0.0001 (0.01 on JPY pairs). Set it by hand for other instruments, for example 0.0001 for 6E futures.
What counts as a touch [High-Low range]
High-Low range: every row the candle traded through. This is the general picture of where price spent its time.
Body (open-close): only the candle body, which ignores wicks.
Close: only the closing price, so the areas show where the market accepted price.
Wicks only: only upper and lower wicks, so the areas show rejection.
Highs & lows: only the candle extremes, so the areas show turning points.
Weight [Equal]: how much each candle counts.
Equal: every candle counts the same.
Volume: candles with more volume count more.
Recency: recent candles count more. The weight grows linearly from the start of the window to the last bar.
Volume × recency: both combined.
Smoothing (rows each side) [2]: averages each row with its neighbours to remove noise. Use 0 for the raw count.
Recalculate on every tick [Off]: when off, the indicator updates once per closed bar, which is lighter on the chart.
Zones
Max number of zones [5]: the maximum number of areas drawn, strongest first.
Min strength (% of the most touched row) [40]: a row must have at least this percentage of the touches of the strongest row to become a zone.
Zone edge (% of the zone peak) [70]: each zone grows up and down from its peak while the neighbouring rows stay above this percentage. Lower values give wider zones.
Max zone height (rows) [6]: the maximum height of a zone.
Min gap between zones (rows) [3]: the minimum distance between two zones, so they don’t overlap.
Zone style
Color mode [Strength gradient]
Strength gradient: from the Weak color to the Strong color, according to the zone’s strength.
Single color: all zones use the same color.
Above / below price: one color for zones above the current price (resistance) and another for zones below it (support).
Strong zones / Weak zones [orange / blue]: the gradient colors.
Single color [purple].
Zones above price / below price [red / green].
Fill transparency [80]: 0 is solid, 100 is invisible.
Border [On], Border style [Solid], Border width [1], Border transparency [30].
Extend zones to the right [On]: zones continue into the future.
Draw zones from [Lookback start]: zones start where the window starts. With Last N bars they start N bars back, for a cleaner chart.
N bars [150]: used with Last N bars.
Mid line [On], Mid line style [Dotted], Mid line width [1]: a line through the middle of each zone.
Zone labels
Show zone labels [On].
Rank [On]: #1 is the most touched zone.
Strength % [On]: the zone’s strength compared with the strongest row.
Number of touches [On]: how many candles touched the zone.
Price range [Off]: the bottom and top price of the zone.
Distance to price (pips) [Off]: how far the zone is from the current price.
Prefix [empty]: text shown before the label, for example “Zone”.
Position [Right]: right of the last bar, or at the left edge of the zone.
Right offset (bars) [5]: the distance from the last bar when the position is Right.
Size [Small].
Text uses zone color [On]: when off, the label uses Text color [gray].
Label background [Off], Background color [light gray].
POC (most touched price)
Show POC line [On]: a line at the single most touched price of the whole window.
Color [yellow], Style [Solid], Width [2].
POC label [On]: shows “POC” with its price.
Touch profile (histogram)
Show touch profile [Off]: draws a horizontal histogram of the touches on the right side of the chart. It works like a volume profile, but counts touches.
Max width (bars) [40]: the length of the longest bar in the histogram.
Offset from last bar (bars) [10]: the gap between the last candle and the histogram.
Color [gray].
Rows inside zones use zone color [On]: highlights the histogram rows that belong to a zone.
Summary table
Show table [Off]: a table listing each zone with its price area, strength, number of touches, and distance in pips. Positive distance means the zone is above price, negative means below.
Position [Top right], Text size [Small].
Branding
Show “powered by Madeira Trading Club” [On], Position [Bottom right], Text color [gray].
Tips
For swing trading, use the 4H or Daily chart with 60 months.
For intraday trading, use 1H with 6 to 12 months.
Use Wicks only to find rejection areas and Close to find acceptance areas.
Combine Recency weight with a long lookback, so recent price action counts more without losing the long-term levels.
Powered by Madeira Trading Club
What it does: the indicator looks back over a chosen number of months and splits that price range into small horizontal rows. It counts how many times price touched each row. The rows that were touched most form the Estimated Price Areas: the levels where the market spent the most time or kept coming back to. These often act as support, resistance, or magnets for price. The strongest single price is marked as the POC (Point of Control).
Lookback
Lookback (months) [60]: how many months of history are used for the calculation.
Window start [Rolling]
Rolling: exactly N months back from the last bar.
Start of month: from the 1st day of the month N months ago, so the window always starts on a whole month.
Max bars in the window [50000]: a safety limit for low timeframes. On 1H, 60 months is about 31,000 bars. If your chart loads less history than you ask for, the indicator uses whatever is available.
Calculation
Row size [Number of rows]: how the price range is divided.
Number of rows: the range is split into a fixed number of rows.
Fixed pips: every row has the same height in pips.
Number of rows [120]: used in Number of rows mode. More rows give more precise but thinner areas.
Row size (pips) [10]: used in Fixed pips mode.
Pip size (0 = auto) [0]: on forex, auto uses 0.0001 (0.01 on JPY pairs). Set it by hand for other instruments, for example 0.0001 for 6E futures.
What counts as a touch [High-Low range]
High-Low range: every row the candle traded through. This is the general picture of where price spent its time.
Body (open-close): only the candle body, which ignores wicks.
Close: only the closing price, so the areas show where the market accepted price.
Wicks only: only upper and lower wicks, so the areas show rejection.
Highs & lows: only the candle extremes, so the areas show turning points.
Weight [Equal]: how much each candle counts.
Equal: every candle counts the same.
Volume: candles with more volume count more.
Recency: recent candles count more. The weight grows linearly from the start of the window to the last bar.
Volume × recency: both combined.
Smoothing (rows each side) [2]: averages each row with its neighbours to remove noise. Use 0 for the raw count.
Recalculate on every tick [Off]: when off, the indicator updates once per closed bar, which is lighter on the chart.
Zones
Max number of zones [5]: the maximum number of areas drawn, strongest first.
Min strength (% of the most touched row) [40]: a row must have at least this percentage of the touches of the strongest row to become a zone.
Zone edge (% of the zone peak) [70]: each zone grows up and down from its peak while the neighbouring rows stay above this percentage. Lower values give wider zones.
Max zone height (rows) [6]: the maximum height of a zone.
Min gap between zones (rows) [3]: the minimum distance between two zones, so they don’t overlap.
Zone style
Color mode [Strength gradient]
Strength gradient: from the Weak color to the Strong color, according to the zone’s strength.
Single color: all zones use the same color.
Above / below price: one color for zones above the current price (resistance) and another for zones below it (support).
Strong zones / Weak zones [orange / blue]: the gradient colors.
Single color [purple].
Zones above price / below price [red / green].
Fill transparency [80]: 0 is solid, 100 is invisible.
Border [On], Border style [Solid], Border width [1], Border transparency [30].
Extend zones to the right [On]: zones continue into the future.
Draw zones from [Lookback start]: zones start where the window starts. With Last N bars they start N bars back, for a cleaner chart.
N bars [150]: used with Last N bars.
Mid line [On], Mid line style [Dotted], Mid line width [1]: a line through the middle of each zone.
Zone labels
Show zone labels [On].
Rank [On]: #1 is the most touched zone.
Strength % [On]: the zone’s strength compared with the strongest row.
Number of touches [On]: how many candles touched the zone.
Price range [Off]: the bottom and top price of the zone.
Distance to price (pips) [Off]: how far the zone is from the current price.
Prefix [empty]: text shown before the label, for example “Zone”.
Position [Right]: right of the last bar, or at the left edge of the zone.
Right offset (bars) [5]: the distance from the last bar when the position is Right.
Size [Small].
Text uses zone color [On]: when off, the label uses Text color [gray].
Label background [Off], Background color [light gray].
POC (most touched price)
Show POC line [On]: a line at the single most touched price of the whole window.
Color [yellow], Style [Solid], Width [2].
POC label [On]: shows “POC” with its price.
Touch profile (histogram)
Show touch profile [Off]: draws a horizontal histogram of the touches on the right side of the chart. It works like a volume profile, but counts touches.
Max width (bars) [40]: the length of the longest bar in the histogram.
Offset from last bar (bars) [10]: the gap between the last candle and the histogram.
Color [gray].
Rows inside zones use zone color [On]: highlights the histogram rows that belong to a zone.
Summary table
Show table [Off]: a table listing each zone with its price area, strength, number of touches, and distance in pips. Positive distance means the zone is above price, negative means below.
Position [Top right], Text size [Small].
Branding
Show “powered by Madeira Trading Club” [On], Position [Bottom right], Text color [gray].
Tips
For swing trading, use the 4H or Daily chart with 60 months.
For intraday trading, use 1H with 6 to 12 months.
Use Wicks only to find rejection areas and Close to find acceptance areas.
Combine Recency weight with a long lookback, so recent price action counts more without losing the long-term levels.

إخلاء المسؤولية
لا يُقصد بالمعلومات والمنشورات أن تكون، أو تشكل، أي نصيحة مالية أو استثمارية أو تجارية أو أنواع أخرى من النصائح أو التوصيات المقدمة أو المعتمدة من TradingView. اقرأ المزيد في شروط الاستخدام.
إخلاء المسؤولية
لا يُقصد بالمعلومات والمنشورات أن تكون، أو تشكل، أي نصيحة مالية أو استثمارية أو تجارية أو أنواع أخرى من النصائح أو التوصيات المقدمة أو المعتمدة من TradingView. اقرأ المزيد في شروط الاستخدام.