Yield Curve Monitor [QuantAlgo]
More exclusive indicators from QuantAlgo
Subscribe to QuantAlgo Essential for $49.99/month to get exclusive indicators by this author. You pay right on TradingView and can use them on your charts straight away.
Explore QuantAlgo Essential🟢 Overview
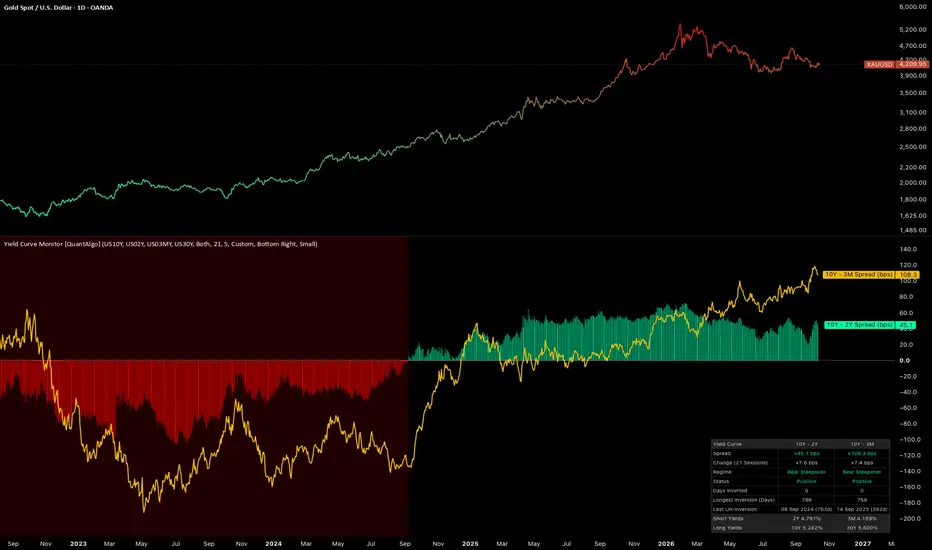
The Yield Curve Monitor is a macro dashboard that tracks the slope of the government bond yield curve through two widely followed spreads, the 10-year minus 2-year and the 10-year minus 3-month. It records each inversion’s length, the longest inversion on record, and the date and days since the curve last turned positive, while classifying each spread’s recent move as a bull or bear steepener or flattener. Whether you trade equities, bonds, or crypto, the indicator keeps both the state of the curve and the direction it is moving in view on any chart.

🟢 What is the Yield Curve?
The yield curve plots government bond yields across maturities, from short-term bills to long-term bonds. In normal conditions longer maturities pay more than shorter ones, so the curve slopes upward and the spread between a long and a short yield is positive. When short-term yields rise above long-term yields, the spread turns negative and the curve is inverted, a condition widely watched as a warning sign for the economy. The 10-year minus 3-month spread is the measure behind the Federal Reserve Bank of New York’s yield curve recession model, while the 10-year minus 2-year spread is widely quoted in market commentary.
Beyond whether the curve is inverted, traders also read how it is moving. A steepener widens the spread and a flattener narrows it. Each is called bull when yields are falling and bear when yields are rising, since bond prices rise as yields fall. Together these form four regimes:
1. Bull Steepener: Short-term yields fall faster than long-term yields.
2. Bear Steepener: Long-term yields rise faster than short-term yields.
3. Bull Flattener: Long-term yields fall faster than short-term yields.
4. Bear Flattener: Short-term yields rise faster than long-term yields.

🟢 Key Features
▶ Two Benchmark Spreads
Each spread is the 10-year yield minus a shorter tenor, multiplied by 100 to read in basis points. Plotted Spreads chooses what the pane draws:
1. 10Y - 2Y draws the 10-year minus 2-year spread as columns, colored by whether the spread is positive or inverted.
2. 10Y - 3M draws the 10-year minus 3-month spread as a line.
3. Both draws the columns and the line together.
The yield inputs are set to US Treasuries and accept yield symbols from other countries, so the same monitor can follow another country’s curve. A 30-year yield sits in the dashboard beside the 10-year, so the far end of the curve reads alongside both spreads.

▶ Curve Regime Classification
The Regime row reads each spread’s move over the Change Lookback, counted in daily sessions, so 21 covers about a month and 63 about a quarter. Steepening or flattening comes from whether the spread widened or narrowed over that span. Bull or bear comes from whether the average of its two yields fell or rose.
Regime Threshold sets the smallest spread change, in basis points, that registers as a regime. Anything smaller reads Neutral, so minor shifts do not show up as a change in direction. When the spread moves but the average yield holds unchanged, the row reads a plain Steepener or Flattener. Steepening regimes appear in the positive spread color and flattening regimes in the inverted color, with the size of the move shown in the Change row above.

▶ Inversion Tracking
An inversion begins on the first bar that closes with a spread below zero and ends on the first bar that closes with it back at zero or above. Its length is counted in calendar days between those two bars.
Each spread keeps its own record of the current inversion, the longest one in the loaded history, and the date the curve last turned positive along with the days that have passed since. This keeps both the start and the end of each cycle in view. Inversion shading tints the pane background while the plotted spread is below zero, so every inversion across the history stands out at a glance.

▶ Curve Dashboard
The dashboard sets both spreads side by side in a single table that can be placed in any of nine positions.
1. Spread: The current value in basis points, colored by its sign.
2. Change: The move over the Change Lookback, with the session count shown in the row label.
3. Regime: The current steepener or flattener reading, or Neutral.
4. Status: Positive above zero, Flat at zero, and Inverted below zero.
5. Days Inverted: The length of the inversion in progress.
6. Longest Inversion (Days): The longest stretch below zero across the loaded history.
7. Last Un-Inversion: The date the spread last returned to zero or above, followed by the days since in parentheses.
8. Short Yields: The 2-year and 3-month yields, each placed under its own spread.
9. Long Yields: The 10-year and 30-year yields.

▶ Built-in Alerts
Six ready-made alert conditions cover the key turns in both spreads under every Plotted Spreads setting. Each fires when a bar closes.
1. 10Y - 2Y Inverted: Fires when the 10Y - 2Y spread closes below zero.
2. 10Y - 2Y Un-Inverted: Fires when the 10Y - 2Y spread closes back at zero or above.
3. 10Y - 3M Inverted: Fires when the 10Y - 3M spread closes below zero.
4. 10Y - 3M Un-Inverted: Fires when the 10Y - 3M spread closes back at zero or above.
5. 10Y - 2Y Regime Change: Fires when the 10Y - 2Y spread closes in a new regime.
6. 10Y - 3M Regime Change: Fires when the 10Y - 3M spread closes in a new regime.

The Yield Curve Monitor is a macro dashboard that tracks the slope of the government bond yield curve through two widely followed spreads, the 10-year minus 2-year and the 10-year minus 3-month. It records each inversion’s length, the longest inversion on record, and the date and days since the curve last turned positive, while classifying each spread’s recent move as a bull or bear steepener or flattener. Whether you trade equities, bonds, or crypto, the indicator keeps both the state of the curve and the direction it is moving in view on any chart.
🟢 What is the Yield Curve?
The yield curve plots government bond yields across maturities, from short-term bills to long-term bonds. In normal conditions longer maturities pay more than shorter ones, so the curve slopes upward and the spread between a long and a short yield is positive. When short-term yields rise above long-term yields, the spread turns negative and the curve is inverted, a condition widely watched as a warning sign for the economy. The 10-year minus 3-month spread is the measure behind the Federal Reserve Bank of New York’s yield curve recession model, while the 10-year minus 2-year spread is widely quoted in market commentary.
Beyond whether the curve is inverted, traders also read how it is moving. A steepener widens the spread and a flattener narrows it. Each is called bull when yields are falling and bear when yields are rising, since bond prices rise as yields fall. Together these form four regimes:
1. Bull Steepener: Short-term yields fall faster than long-term yields.
2. Bear Steepener: Long-term yields rise faster than short-term yields.
3. Bull Flattener: Long-term yields fall faster than short-term yields.
4. Bear Flattener: Short-term yields rise faster than long-term yields.
🟢 Key Features
▶ Two Benchmark Spreads
Each spread is the 10-year yield minus a shorter tenor, multiplied by 100 to read in basis points. Plotted Spreads chooses what the pane draws:
1. 10Y - 2Y draws the 10-year minus 2-year spread as columns, colored by whether the spread is positive or inverted.
2. 10Y - 3M draws the 10-year minus 3-month spread as a line.
3. Both draws the columns and the line together.
The yield inputs are set to US Treasuries and accept yield symbols from other countries, so the same monitor can follow another country’s curve. A 30-year yield sits in the dashboard beside the 10-year, so the far end of the curve reads alongside both spreads.
▶ Curve Regime Classification
The Regime row reads each spread’s move over the Change Lookback, counted in daily sessions, so 21 covers about a month and 63 about a quarter. Steepening or flattening comes from whether the spread widened or narrowed over that span. Bull or bear comes from whether the average of its two yields fell or rose.
Regime Threshold sets the smallest spread change, in basis points, that registers as a regime. Anything smaller reads Neutral, so minor shifts do not show up as a change in direction. When the spread moves but the average yield holds unchanged, the row reads a plain Steepener or Flattener. Steepening regimes appear in the positive spread color and flattening regimes in the inverted color, with the size of the move shown in the Change row above.
▶ Inversion Tracking
An inversion begins on the first bar that closes with a spread below zero and ends on the first bar that closes with it back at zero or above. Its length is counted in calendar days between those two bars.
Each spread keeps its own record of the current inversion, the longest one in the loaded history, and the date the curve last turned positive along with the days that have passed since. This keeps both the start and the end of each cycle in view. Inversion shading tints the pane background while the plotted spread is below zero, so every inversion across the history stands out at a glance.
▶ Curve Dashboard
The dashboard sets both spreads side by side in a single table that can be placed in any of nine positions.
1. Spread: The current value in basis points, colored by its sign.
2. Change: The move over the Change Lookback, with the session count shown in the row label.
3. Regime: The current steepener or flattener reading, or Neutral.
4. Status: Positive above zero, Flat at zero, and Inverted below zero.
5. Days Inverted: The length of the inversion in progress.
6. Longest Inversion (Days): The longest stretch below zero across the loaded history.
7. Last Un-Inversion: The date the spread last returned to zero or above, followed by the days since in parentheses.
8. Short Yields: The 2-year and 3-month yields, each placed under its own spread.
9. Long Yields: The 10-year and 30-year yields.
▶ Built-in Alerts
Six ready-made alert conditions cover the key turns in both spreads under every Plotted Spreads setting. Each fires when a bar closes.
1. 10Y - 2Y Inverted: Fires when the 10Y - 2Y spread closes below zero.
2. 10Y - 2Y Un-Inverted: Fires when the 10Y - 2Y spread closes back at zero or above.
3. 10Y - 3M Inverted: Fires when the 10Y - 3M spread closes below zero.
4. 10Y - 3M Un-Inverted: Fires when the 10Y - 3M spread closes back at zero or above.
5. 10Y - 2Y Regime Change: Fires when the 10Y - 2Y spread closes in a new regime.
6. 10Y - 3M Regime Change: Fires when the 10Y - 3M spread closes in a new regime.

🟢 Access our best trading & investing tools: joinquantalgo.com/plans
🟢 Free Special Edition indicators: joinquantalgo.com/special-editions
🟢 Discord: discord.gg/hJaFyGEAyX
🟢 Free Special Edition indicators: joinquantalgo.com/special-editions
🟢 Discord: discord.gg/hJaFyGEAyX
إخلاء المسؤولية
لا يُقصد بالمعلومات والمنشورات أن تكون، أو تشكل، أي نصيحة مالية أو استثمارية أو تجارية أو أنواع أخرى من النصائح أو التوصيات المقدمة أو المعتمدة من TradingView. اقرأ المزيد في شروط الاستخدام.
🟢 Access our best trading & investing tools: joinquantalgo.com/plans
🟢 Free Special Edition indicators: joinquantalgo.com/special-editions
🟢 Discord: discord.gg/hJaFyGEAyX
🟢 Free Special Edition indicators: joinquantalgo.com/special-editions
🟢 Discord: discord.gg/hJaFyGEAyX
إخلاء المسؤولية
لا يُقصد بالمعلومات والمنشورات أن تكون، أو تشكل، أي نصيحة مالية أو استثمارية أو تجارية أو أنواع أخرى من النصائح أو التوصيات المقدمة أو المعتمدة من TradingView. اقرأ المزيد في شروط الاستخدام.