BERNA (Boundary-Encoded Resonance Network Architecture)
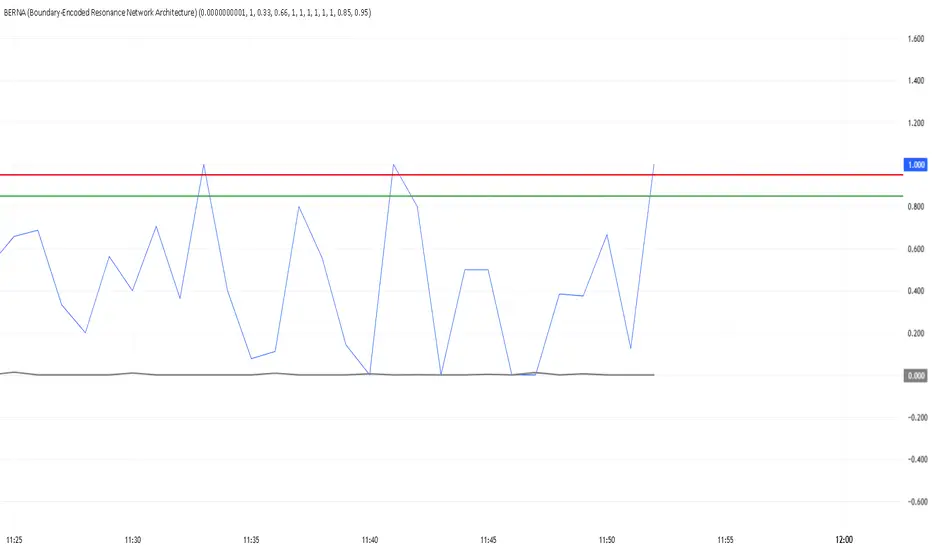
BERNA — Boundary-Encoded Resonance Network Architecture
BERNA is a research-grade indicator that estimates the remaining structural capacity of the current market regime.
Unlike trend, volatility, or momentum tools, BERNA does not measure price direction — it measures how much of the regime’s internal capacity has already been consumed.
This script implements the BERNA model published on Zenodo (Bülent Duman, 2026).
It is intentionally minimal and uses only OHLC data.
What BERNA measures
BERNA outputs a structural capacity state:
τ = Σ / Θ (normalized structural stress)
Λ = Θ − Σ (remaining structural capacity)
Interpretation:
High Λ / low τ → the regime has structural endurance
Rising τ → capacity is being consumed
τ → 1 (Λ → 0) → rupture proximity (capacity exhaustion)
This makes BERNA a forward-looking structural capacity variable, not a price oscillator.
What is inside this script
This implementation contains the following components:
Efficiency proxy (DERYA-like, but not the full public DERYA)
BERNA uses a simple microstructure efficiency proxy computed as:
E = |close − open| / (high − low)
This is conceptually “DERYA-like” but it is not the full DERYA framework.
No external/public DERYA source code is embedded here.
Standard technical primitives used
This script uses only basic primitives commonly found in technical analysis:
Absolute value and range normalization
Thresholding (regime binning)
Power transform on range (rng^p)
There is no EMA, RSI, MACD, ATR, ADX, Fisher, Kaufman, or other indicator embedded.
All computations are internal and deterministic.
3-state structural regime binning (K = 3)
The efficiency proxy E is discretized into three regimes using user thresholds:
Low efficiency
Mid efficiency
High efficiency
Each regime has its own capacity Θ and stress multiplier β.
Structural stress accumulation (Σ) and rupture proximity
Stress increment is defined as:
dΣ = β · (1 − E) · (range^p)
Σ accumulates inside a regime and is capped by Θ.
In this prototype, Σ resets on regime change by construction (regime-gated accumulation).
The rupture proximity is expressed through τ and Λ.
How to use BERNA
BERNA is designed as a regime-health and fragility overlay, not a buy/sell trigger.
Typical uses:
Detect when an ongoing move is structurally late-stage (τ high, Λ low)
Avoid initiating trades when capacity is nearly exhausted
Compare structural resilience across assets and regimes
Use alongside price/trend/volume systems for context
Do not use BERNA alone as a trading signal.
BERNA tells you “how much structure is left”, not “where price will go.”
Visuals
Efficiency (E) shows the bar-level microstructure efficiency proxy
τ shows normalized structural stress (capacity consumption)
Λ shows remaining structural capacity
Dotted lines mark warning and critical rupture proximity levels
Important notes
BERNA is not RSI, MACD, ATR, ADX, Fisher, Kaufman, or a volatility model
BERNA does not predict price direction
BERNA does not issue entry/exit signals
BERNA is a structural capacity diagnostic
This script does not embed any external/public indicator code; all logic is implemented directly in Pine.
Risk and disclaimer
This script is provided for research and analytical purposes only.
It is not financial advice and must not be used as a standalone trading system.
Markets are uncertain.
All trading decisions and risks remain entirely the responsibility of the user.
BERNA: Boundary-Encoded Resonance Network Architecture
A Structural Failure Theory of Financial Regimes Based on Endogenous Capacity Depletion
Author: Duman, Bülent
Affiliation: Independent Researcher
Reference: zenodo.org/records/18287969
BERNA is a research-grade indicator that estimates the remaining structural capacity of the current market regime.
Unlike trend, volatility, or momentum tools, BERNA does not measure price direction — it measures how much of the regime’s internal capacity has already been consumed.
This script implements the BERNA model published on Zenodo (Bülent Duman, 2026).
It is intentionally minimal and uses only OHLC data.
What BERNA measures
BERNA outputs a structural capacity state:
τ = Σ / Θ (normalized structural stress)
Λ = Θ − Σ (remaining structural capacity)
Interpretation:
High Λ / low τ → the regime has structural endurance
Rising τ → capacity is being consumed
τ → 1 (Λ → 0) → rupture proximity (capacity exhaustion)
This makes BERNA a forward-looking structural capacity variable, not a price oscillator.
What is inside this script
This implementation contains the following components:
Efficiency proxy (DERYA-like, but not the full public DERYA)
BERNA uses a simple microstructure efficiency proxy computed as:
E = |close − open| / (high − low)
This is conceptually “DERYA-like” but it is not the full DERYA framework.
No external/public DERYA source code is embedded here.
Standard technical primitives used
This script uses only basic primitives commonly found in technical analysis:
Absolute value and range normalization
Thresholding (regime binning)
Power transform on range (rng^p)
There is no EMA, RSI, MACD, ATR, ADX, Fisher, Kaufman, or other indicator embedded.
All computations are internal and deterministic.
3-state structural regime binning (K = 3)
The efficiency proxy E is discretized into three regimes using user thresholds:
Low efficiency
Mid efficiency
High efficiency
Each regime has its own capacity Θ and stress multiplier β.
Structural stress accumulation (Σ) and rupture proximity
Stress increment is defined as:
dΣ = β · (1 − E) · (range^p)
Σ accumulates inside a regime and is capped by Θ.
In this prototype, Σ resets on regime change by construction (regime-gated accumulation).
The rupture proximity is expressed through τ and Λ.
How to use BERNA
BERNA is designed as a regime-health and fragility overlay, not a buy/sell trigger.
Typical uses:
Detect when an ongoing move is structurally late-stage (τ high, Λ low)
Avoid initiating trades when capacity is nearly exhausted
Compare structural resilience across assets and regimes
Use alongside price/trend/volume systems for context
Do not use BERNA alone as a trading signal.
BERNA tells you “how much structure is left”, not “where price will go.”
Visuals
Efficiency (E) shows the bar-level microstructure efficiency proxy
τ shows normalized structural stress (capacity consumption)
Λ shows remaining structural capacity
Dotted lines mark warning and critical rupture proximity levels
Important notes
BERNA is not RSI, MACD, ATR, ADX, Fisher, Kaufman, or a volatility model
BERNA does not predict price direction
BERNA does not issue entry/exit signals
BERNA is a structural capacity diagnostic
This script does not embed any external/public indicator code; all logic is implemented directly in Pine.
Risk and disclaimer
This script is provided for research and analytical purposes only.
It is not financial advice and must not be used as a standalone trading system.
Markets are uncertain.
All trading decisions and risks remain entirely the responsibility of the user.
BERNA: Boundary-Encoded Resonance Network Architecture
A Structural Failure Theory of Financial Regimes Based on Endogenous Capacity Depletion
Author: Duman, Bülent
Affiliation: Independent Researcher
Reference: zenodo.org/records/18287969

إخلاء المسؤولية
لا يُقصد بالمعلومات والمنشورات أن تكون، أو تشكل، أي نصيحة مالية أو استثمارية أو تجارية أو أنواع أخرى من النصائح أو التوصيات المقدمة أو المعتمدة من TradingView. اقرأ المزيد في شروط الاستخدام.
إخلاء المسؤولية
لا يُقصد بالمعلومات والمنشورات أن تكون، أو تشكل، أي نصيحة مالية أو استثمارية أو تجارية أو أنواع أخرى من النصائح أو التوصيات المقدمة أو المعتمدة من TradingView. اقرأ المزيد في شروط الاستخدام.