تم تحديثه
Grandoc's Top Down Analysis Projection
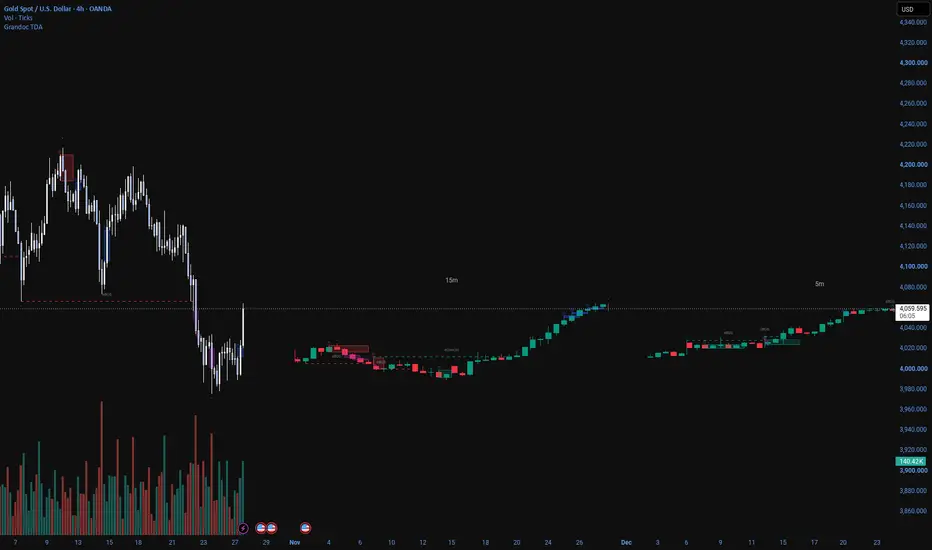
Grandoc's Top Down Analysis Projection — Experimental release
OVERVIEW
This indicator is built to support top-down analysis (TDA). You stay on the higher-timeframe chart (any timeframe you choose) and the indicator projects two lower timeframes — 15m and 5m by default — as small candles to the right of the last candle. Each projection carries its own market structure and zones, so you can read the higher-timeframe context and see what is unfolding on the lower timeframes on one screen, without switching charts.
It is the reverse of my earlier projection indicator, which works the other way round: there you sit on the lower timeframe and look up at the higher timeframe. Here you sit on the higher timeframe and look down.
There are no buy or sell signals and no alerts in this version. The indicator only organises price information so you can do your own analysis.
WHAT IT DRAWS
On the main (chart timeframe) candles:
• External structure: swing points marked HH / HL / LH / LL (small dots by default, or letters), plus eBOS and eCHoCH break lines.
• Raided swings: when a later wick trades beyond a marked swing, its dot turns from a solid "•" to a hollow "○" (in Letters mode the letter fades instead).
• Optional internal structure: iBOS / iCHoCH lines in faint colours (off by default).
• Optional zigzag joining wick highs and lows with strict alternation (off by default).
• Optional key levels: broken external swing levels as short stubs or until touched (off by default).
• Order blocks (OB) and plain fair value gaps (FVG).
To the right of the last candle:
• Projection 1 and Projection 2: the latest lower-timeframe candles (3 to 200 each, 30 by default), each labelled with its timeframe, with their own swing markers, eBOS/eCHoCH lines, OBs and FVGs.
• Optionally, either lower timeframe's external swings and breaks can also be drawn directly on the main chart in separate colours.
Hovering the small "ⓘ" at the top-left corner of a zone shows its type, timeframe and top/bottom prices. Swing markers and break labels also show their price on hover.
HOW IT WORKS
Market structure
• An external swing high/low is a candle whose high/low is not exceeded by the set number of candles on each side (Swing length, default 5).
• External levels only move on breaks. While a trend is running, small swings inside the range are ignored; after a break, the extreme of the leg becomes the new protected level.
• A break needs a candle CLOSE beyond the level. A break in the direction of the trend is labelled eBOS; a break against the trend is labelled eCHoCH.
• Internal structure uses its own, shorter swing length (default 2) to mark minor breaks inside the external range as iBOS / iCHoCH.
Order blocks
• An OB is created when external structure breaks (or also on internal breaks, if you select that trigger).
• "Extreme of leg" (default) uses the opposite-colour candle with the lowest low (bullish OB) or highest high (bearish OB) inside the leg that produced the break.
• "Last opposite candle before displacement" uses the last opposite-colour candle before the impulsive move started.
• The zone covers that candle's full high-to-low range.
Fair value gaps
• A plain three-candle gap: a bullish FVG when candle 3's low is above candle 1's high, a bearish FVG when candle 3's high is below candle 1's low. There is no inversion (IFVG) logic; inversions are left to the user to read.
Lower-timeframe data and drawing
• Lower-timeframe candles are requested with request.security_lower_tf, which returns the intrabar open/high/low/close/time of each chart candle. These are stored in a rolling buffer and the newest ones are drawn as boxes (bodies) and lines (wicks).
• Projections are positioned by time (xloc.bar_time) rather than by bar index, so they can be placed to the right of the last candle without being limited by how far into the future a bar index can go.
• The same structure, OB and FVG logic is run on the projected candles, using the "Swing length on projections" setting (default 3).
• Everything is recalculated and redrawn on the last loaded candle only. In Bar Replay, that is the replay candle, so the indicator follows the replay as you step forward.
WHY THIS HELPS TOP-DOWN ANALYSIS
Top-down analysis means reading the market from the higher timeframe down: the higher timeframe gives the bias and the key zones, and the lower timeframes show how price is behaving inside that context and when a reaction is actually starting. The usual workflow is to keep switching charts (for example 4H, then 15m, then 5m), which breaks your focus and makes it easy to lose the higher-timeframe picture while you are looking for detail.
This indicator keeps the higher timeframe as your main chart and places the two lower timeframes beside it, to the right of the last candle, each with its own structure and zones. On one screen you can:
• See the higher-timeframe bias (its latest external eBOS/eCHoCH) and its order blocks and FVGs.
• See whether the 15m and 5m (or whatever you choose) agree with that bias, or are still moving against it.
• Watch how the lower timeframes behave when price reaches a higher-timeframe zone — for example a lower-timeframe eCHoCH forming inside a higher-timeframe order block, or a lower-timeframe FVG forming in the direction of the higher-timeframe structure.
• Notice when all three timeframes line up, and when they disagree, without leaving the higher-timeframe chart.
It is the reverse of looking at a lower-timeframe chart with higher-timeframe levels overlaid: here the higher timeframe stays in charge and the lower timeframes are brought to it.
HOW TO USE IT
1. Open the higher timeframe you want to read (for example Daily or 4H).
2. Set Projection 1 and Projection 2 to two LOWER timeframes. Examples: Daily chart with 4H and 1H; 4H chart with 15m and 5m; 1H chart with 5m and 1m.
3. Read the higher-timeframe structure and zones on the main candles first: what is the current external direction, and where are the nearest order blocks and FVGs?
4. Move to Projection 1 (the middle timeframe): is its latest external break with or against the higher timeframe? Is price reacting at a higher-timeframe zone?
5. Move to Projection 2 (the lowest timeframe) for the finest detail of what is happening right now.
6. Use "Draw this TF structure on chart" if you want a lower timeframe's swings and breaks laid directly over the higher-timeframe candles.
7. If the projections look crowded, raise Candle width, Candle spacing, Distance or Gap in the Layout settings, or lower the Candle count.
The indicator does not tell you what to do; it is a visual aid for your own reading of the market.
SETTINGS
Defaults are deliberately minimalist: external structure, dots, OB and FVG with the newest 3 per side, and two projections. Everything else is off until you switch it on.
History
• Bars to analyze (500; 50–3000): chart candles scanned for structure, OBs and FVGs, counted back from the last loaded candle (the replay candle in Bar Replay). More history means more drawings and slower loading.
External Structure
• Swing length (5): candles on each side a high/low must beat to count as a swing.
• Show HH / HL / LH / LL (on): marks external swing points.
• Marker style (Dots): small "•" dots or HH/HL/LH/LL letters.
• Marker size (Tiny), Marker transparency (0), Marker offset (0.2 × average candle range): look and distance of the marker from the wick.
• Hollow dot when raided (on): the dot becomes "○" once a later wick trades beyond the swing.
• HH / HL / LH / LL colours.
• Show eBOS / eCHoCH (on), Bull/Bear colours, Line style (Dashed), Line width (1), Text horizontal (Middle), Text vertical (Above), Text size (Tiny), Text colour (gray).
Internal Structure (off by default)
• Show iBOS / iCHoCH (off), Internal swing length (2), faint Bull/Bear colours, Line style (Dotted), Line width, text position, size and colour. Internal structure is drawn on the main chart only.
Zigzag (off by default)
• Show zigzag (off), Zigzag swing length (2), Colour, Width, Style. Two highs in a row keep the higher one; two lows in a row keep the lower one. Main chart only.
Key Levels (off by default)
• Show key levels (off): price levels of broken external swing highs/lows (the levels behind each eBOS/eCHoCH). Main chart only.
• Mode (Short stub): Short stub draws a short line starting at the swing point, Stub length bars long. Until touched draws the line from the swing to the candle where price returns to the level, or extends it right if price has not returned yet.
• Stub length (bars) (10, range 1-100): length of each line in Short stub mode. Not used in Until touched mode.
• Max per side (3, range 1-50): only the most recent N broken highs and N broken lows are drawn.
• Colour / Width / Style (orange / 1 / solid): line look.
Order Blocks
• Show OB (on).
• OB trigger (External only): or External + internal for additional pullback OBs.
• OB candle (Extreme of leg): or Last opposite candle before displacement.
• Keep all (off): keep every OB found in the history window (newest kept if the drawing limit is reached).
• Max per side (3): newest bullish and bearish OBs kept when Keep all is off.
• Extend right (off): fixed box on the origin candle, or a box running to the right.
• Bull/Bear fill colours, Border style, Fixed box length (5 candles).
Fair Value Gaps
• Show FVG (on), Keep all (off), Max per side (3), Extend right (off; fixed box spans the 3 origin candles), Bull/Bear fill colours, Border style.
Projection 1 (default 15m) and Projection 2 (default 5m)
• Enable (on), Timeframe, Candle count (60; 3–200), Up/Down candle colours.
• Swings on projection, eBOS/eCHoCH on projection, OB on projection, FVG on projection (all on).
• Draw this TF structure on chart (off), with its own Chart bull/bear colours.
Projection Layout
• Distance from last candle (20 bars), Gap between projections (15 bars), Candle width (2 bars), Candle spacing (1 bar).
• Swing length on projections (3).
• LTF history for chart structure (300): lower-timeframe candles used when a projection's structure is drawn on the main chart.
Projections reuse the OB/FVG choices and colours above, but show only the newest few zones per side (up to 4 when both OB and FVG are on) so the mini charts stay readable. Internal structure, zigzag and key levels are not drawn on projections.
LIMITATIONS AND NOTES
• Each projection timeframe must be LOWER than the chart timeframe. If it is equal or higher, that projection switches itself off without an error.
• TradingView allows at most 500 boxes, 500 lines and 500 labels per indicator. Room is reserved for the projections first; the oldest chart drawings are dropped when the limit is reached, and projected candle counts are trimmed silently if needed. "Keep all" is therefore still bound by this limit.
• Lower-timeframe history is limited. request.security_lower_tf only returns a limited number of intrabars, and the indicator only collects lower-timeframe data from the most recent ~600 chart candles. On a large timeframe gap, or on symbols/sessions with little data, a projection may show fewer candles than requested.
• Swing points need the set number of candles on each side before they are confirmed, so the newest swings appear with a delay.
• Realtime behaviour: on the live (unclosed) chart candle, the indicator includes the developing data. Breaks, swings, zones, raided status and the last projected candles can change or disappear until that candle closes. Confirmed history does not change. Results on a live chart can therefore differ from what you see after the candle has closed.
• If the drawings ever appear detached from the candles, open the indicator's "More" menu in the legend and use "Pin to scale" with the main (right) price scale.
• Works on any symbol and timeframe that TradingView provides lower-timeframe data for.
EXPERIMENTAL
This is an experimental release. The logic and settings may change in future updates as it is refined. Please test it on your own charts, including in Bar Replay, and feel free to share feedback, issues or suggestions in the comments.
ACKNOWLEDGEMENTS
• Market structure (BOS / CHoCH, higher highs and lower lows), order blocks and fair value gaps are widely known, publicly discussed price-action concepts, popularised in Smart Money Concepts / ICT-style trading education. This script implements its own interpretation of those general ideas.
• Built with Pine Script v6 using TradingView's Pine Script documentation and reference manual (including request.security_lower_tf and the drawing objects).
• The code is original and written from scratch for this indicator; no code has been copied from other scripts.
DISCLAIMER
This indicator is for educational and informational purposes only. It is not financial advice and not a recommendation to buy or sell any instrument. It does not predict price and makes no claim of profitability. Past market behaviour does not guarantee future results. Always do your own analysis and manage your own risk.
OVERVIEW
This indicator is built to support top-down analysis (TDA). You stay on the higher-timeframe chart (any timeframe you choose) and the indicator projects two lower timeframes — 15m and 5m by default — as small candles to the right of the last candle. Each projection carries its own market structure and zones, so you can read the higher-timeframe context and see what is unfolding on the lower timeframes on one screen, without switching charts.
It is the reverse of my earlier projection indicator, which works the other way round: there you sit on the lower timeframe and look up at the higher timeframe. Here you sit on the higher timeframe and look down.
There are no buy or sell signals and no alerts in this version. The indicator only organises price information so you can do your own analysis.
WHAT IT DRAWS
On the main (chart timeframe) candles:
• External structure: swing points marked HH / HL / LH / LL (small dots by default, or letters), plus eBOS and eCHoCH break lines.
• Raided swings: when a later wick trades beyond a marked swing, its dot turns from a solid "•" to a hollow "○" (in Letters mode the letter fades instead).
• Optional internal structure: iBOS / iCHoCH lines in faint colours (off by default).
• Optional zigzag joining wick highs and lows with strict alternation (off by default).
• Optional key levels: broken external swing levels as short stubs or until touched (off by default).
• Order blocks (OB) and plain fair value gaps (FVG).
To the right of the last candle:
• Projection 1 and Projection 2: the latest lower-timeframe candles (3 to 200 each, 30 by default), each labelled with its timeframe, with their own swing markers, eBOS/eCHoCH lines, OBs and FVGs.
• Optionally, either lower timeframe's external swings and breaks can also be drawn directly on the main chart in separate colours.
Hovering the small "ⓘ" at the top-left corner of a zone shows its type, timeframe and top/bottom prices. Swing markers and break labels also show their price on hover.
HOW IT WORKS
Market structure
• An external swing high/low is a candle whose high/low is not exceeded by the set number of candles on each side (Swing length, default 5).
• External levels only move on breaks. While a trend is running, small swings inside the range are ignored; after a break, the extreme of the leg becomes the new protected level.
• A break needs a candle CLOSE beyond the level. A break in the direction of the trend is labelled eBOS; a break against the trend is labelled eCHoCH.
• Internal structure uses its own, shorter swing length (default 2) to mark minor breaks inside the external range as iBOS / iCHoCH.
Order blocks
• An OB is created when external structure breaks (or also on internal breaks, if you select that trigger).
• "Extreme of leg" (default) uses the opposite-colour candle with the lowest low (bullish OB) or highest high (bearish OB) inside the leg that produced the break.
• "Last opposite candle before displacement" uses the last opposite-colour candle before the impulsive move started.
• The zone covers that candle's full high-to-low range.
Fair value gaps
• A plain three-candle gap: a bullish FVG when candle 3's low is above candle 1's high, a bearish FVG when candle 3's high is below candle 1's low. There is no inversion (IFVG) logic; inversions are left to the user to read.
Lower-timeframe data and drawing
• Lower-timeframe candles are requested with request.security_lower_tf, which returns the intrabar open/high/low/close/time of each chart candle. These are stored in a rolling buffer and the newest ones are drawn as boxes (bodies) and lines (wicks).
• Projections are positioned by time (xloc.bar_time) rather than by bar index, so they can be placed to the right of the last candle without being limited by how far into the future a bar index can go.
• The same structure, OB and FVG logic is run on the projected candles, using the "Swing length on projections" setting (default 3).
• Everything is recalculated and redrawn on the last loaded candle only. In Bar Replay, that is the replay candle, so the indicator follows the replay as you step forward.
WHY THIS HELPS TOP-DOWN ANALYSIS
Top-down analysis means reading the market from the higher timeframe down: the higher timeframe gives the bias and the key zones, and the lower timeframes show how price is behaving inside that context and when a reaction is actually starting. The usual workflow is to keep switching charts (for example 4H, then 15m, then 5m), which breaks your focus and makes it easy to lose the higher-timeframe picture while you are looking for detail.
This indicator keeps the higher timeframe as your main chart and places the two lower timeframes beside it, to the right of the last candle, each with its own structure and zones. On one screen you can:
• See the higher-timeframe bias (its latest external eBOS/eCHoCH) and its order blocks and FVGs.
• See whether the 15m and 5m (or whatever you choose) agree with that bias, or are still moving against it.
• Watch how the lower timeframes behave when price reaches a higher-timeframe zone — for example a lower-timeframe eCHoCH forming inside a higher-timeframe order block, or a lower-timeframe FVG forming in the direction of the higher-timeframe structure.
• Notice when all three timeframes line up, and when they disagree, without leaving the higher-timeframe chart.
It is the reverse of looking at a lower-timeframe chart with higher-timeframe levels overlaid: here the higher timeframe stays in charge and the lower timeframes are brought to it.
HOW TO USE IT
1. Open the higher timeframe you want to read (for example Daily or 4H).
2. Set Projection 1 and Projection 2 to two LOWER timeframes. Examples: Daily chart with 4H and 1H; 4H chart with 15m and 5m; 1H chart with 5m and 1m.
3. Read the higher-timeframe structure and zones on the main candles first: what is the current external direction, and where are the nearest order blocks and FVGs?
4. Move to Projection 1 (the middle timeframe): is its latest external break with or against the higher timeframe? Is price reacting at a higher-timeframe zone?
5. Move to Projection 2 (the lowest timeframe) for the finest detail of what is happening right now.
6. Use "Draw this TF structure on chart" if you want a lower timeframe's swings and breaks laid directly over the higher-timeframe candles.
7. If the projections look crowded, raise Candle width, Candle spacing, Distance or Gap in the Layout settings, or lower the Candle count.
The indicator does not tell you what to do; it is a visual aid for your own reading of the market.
SETTINGS
Defaults are deliberately minimalist: external structure, dots, OB and FVG with the newest 3 per side, and two projections. Everything else is off until you switch it on.
History
• Bars to analyze (500; 50–3000): chart candles scanned for structure, OBs and FVGs, counted back from the last loaded candle (the replay candle in Bar Replay). More history means more drawings and slower loading.
External Structure
• Swing length (5): candles on each side a high/low must beat to count as a swing.
• Show HH / HL / LH / LL (on): marks external swing points.
• Marker style (Dots): small "•" dots or HH/HL/LH/LL letters.
• Marker size (Tiny), Marker transparency (0), Marker offset (0.2 × average candle range): look and distance of the marker from the wick.
• Hollow dot when raided (on): the dot becomes "○" once a later wick trades beyond the swing.
• HH / HL / LH / LL colours.
• Show eBOS / eCHoCH (on), Bull/Bear colours, Line style (Dashed), Line width (1), Text horizontal (Middle), Text vertical (Above), Text size (Tiny), Text colour (gray).
Internal Structure (off by default)
• Show iBOS / iCHoCH (off), Internal swing length (2), faint Bull/Bear colours, Line style (Dotted), Line width, text position, size and colour. Internal structure is drawn on the main chart only.
Zigzag (off by default)
• Show zigzag (off), Zigzag swing length (2), Colour, Width, Style. Two highs in a row keep the higher one; two lows in a row keep the lower one. Main chart only.
Key Levels (off by default)
• Show key levels (off): price levels of broken external swing highs/lows (the levels behind each eBOS/eCHoCH). Main chart only.
• Mode (Short stub): Short stub draws a short line starting at the swing point, Stub length bars long. Until touched draws the line from the swing to the candle where price returns to the level, or extends it right if price has not returned yet.
• Stub length (bars) (10, range 1-100): length of each line in Short stub mode. Not used in Until touched mode.
• Max per side (3, range 1-50): only the most recent N broken highs and N broken lows are drawn.
• Colour / Width / Style (orange / 1 / solid): line look.
Order Blocks
• Show OB (on).
• OB trigger (External only): or External + internal for additional pullback OBs.
• OB candle (Extreme of leg): or Last opposite candle before displacement.
• Keep all (off): keep every OB found in the history window (newest kept if the drawing limit is reached).
• Max per side (3): newest bullish and bearish OBs kept when Keep all is off.
• Extend right (off): fixed box on the origin candle, or a box running to the right.
• Bull/Bear fill colours, Border style, Fixed box length (5 candles).
Fair Value Gaps
• Show FVG (on), Keep all (off), Max per side (3), Extend right (off; fixed box spans the 3 origin candles), Bull/Bear fill colours, Border style.
Projection 1 (default 15m) and Projection 2 (default 5m)
• Enable (on), Timeframe, Candle count (60; 3–200), Up/Down candle colours.
• Swings on projection, eBOS/eCHoCH on projection, OB on projection, FVG on projection (all on).
• Draw this TF structure on chart (off), with its own Chart bull/bear colours.
Projection Layout
• Distance from last candle (20 bars), Gap between projections (15 bars), Candle width (2 bars), Candle spacing (1 bar).
• Swing length on projections (3).
• LTF history for chart structure (300): lower-timeframe candles used when a projection's structure is drawn on the main chart.
Projections reuse the OB/FVG choices and colours above, but show only the newest few zones per side (up to 4 when both OB and FVG are on) so the mini charts stay readable. Internal structure, zigzag and key levels are not drawn on projections.
LIMITATIONS AND NOTES
• Each projection timeframe must be LOWER than the chart timeframe. If it is equal or higher, that projection switches itself off without an error.
• TradingView allows at most 500 boxes, 500 lines and 500 labels per indicator. Room is reserved for the projections first; the oldest chart drawings are dropped when the limit is reached, and projected candle counts are trimmed silently if needed. "Keep all" is therefore still bound by this limit.
• Lower-timeframe history is limited. request.security_lower_tf only returns a limited number of intrabars, and the indicator only collects lower-timeframe data from the most recent ~600 chart candles. On a large timeframe gap, or on symbols/sessions with little data, a projection may show fewer candles than requested.
• Swing points need the set number of candles on each side before they are confirmed, so the newest swings appear with a delay.
• Realtime behaviour: on the live (unclosed) chart candle, the indicator includes the developing data. Breaks, swings, zones, raided status and the last projected candles can change or disappear until that candle closes. Confirmed history does not change. Results on a live chart can therefore differ from what you see after the candle has closed.
• If the drawings ever appear detached from the candles, open the indicator's "More" menu in the legend and use "Pin to scale" with the main (right) price scale.
• Works on any symbol and timeframe that TradingView provides lower-timeframe data for.
EXPERIMENTAL
This is an experimental release. The logic and settings may change in future updates as it is refined. Please test it on your own charts, including in Bar Replay, and feel free to share feedback, issues or suggestions in the comments.
ACKNOWLEDGEMENTS
• Market structure (BOS / CHoCH, higher highs and lower lows), order blocks and fair value gaps are widely known, publicly discussed price-action concepts, popularised in Smart Money Concepts / ICT-style trading education. This script implements its own interpretation of those general ideas.
• Built with Pine Script v6 using TradingView's Pine Script documentation and reference manual (including request.security_lower_tf and the drawing objects).
• The code is original and written from scratch for this indicator; no code has been copied from other scripts.
DISCLAIMER
This indicator is for educational and informational purposes only. It is not financial advice and not a recommendation to buy or sell any instrument. It does not predict price and makes no claim of profitability. Past market behaviour does not guarantee future results. Always do your own analysis and manage your own risk.
ملاحظات الأخبار
Clearer default layout: 60 candles per projection, larger distance (20) and gap (15) between the chart and projections. Expanded explanation of how the indicator supports top-down analysis.
Grandoc
إخلاء المسؤولية
لا يُقصد بالمعلومات والمنشورات أن تكون، أو تشكل، أي نصيحة مالية أو استثمارية أو تجارية أو أنواع أخرى من النصائح أو التوصيات المقدمة أو المعتمدة من TradingView. اقرأ المزيد في شروط الاستخدام.
Grandoc
إخلاء المسؤولية
لا يُقصد بالمعلومات والمنشورات أن تكون، أو تشكل، أي نصيحة مالية أو استثمارية أو تجارية أو أنواع أخرى من النصائح أو التوصيات المقدمة أو المعتمدة من TradingView. اقرأ المزيد في شروط الاستخدام.