DXY Candlestick Panel
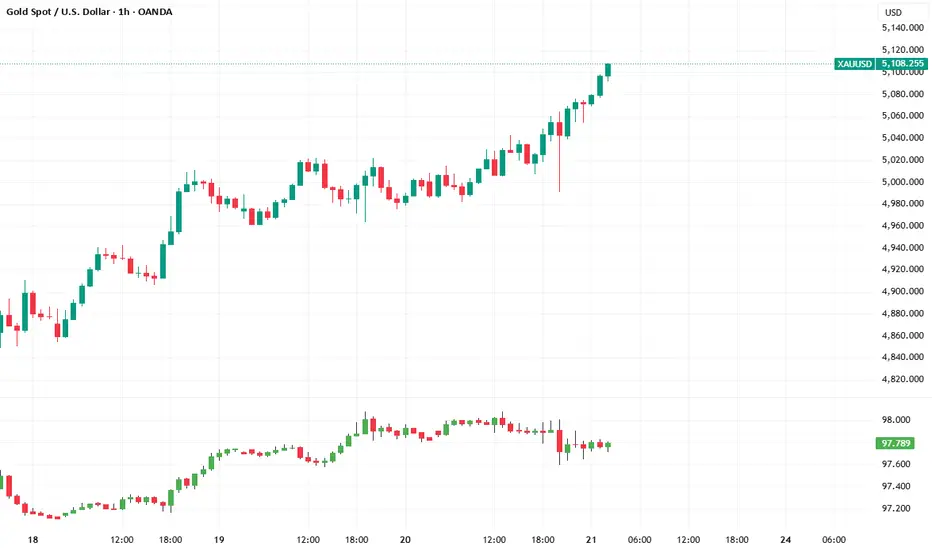
DXY Candlestick Panel is a secondary chart panel that displays live candlestick structure of the U.S. Dollar Index (DXY) directly inside your current chart layout.
Instead of switching layouts or using multi-chart view, this script allows traders to monitor DXY price action in a dedicated lower panel while trading correlated instruments such as XAU/USD, EUR/USD, or GBP/USD.
🔍 Core Concept
Many instruments — especially Gold and major Forex pairs — are heavily influenced by U.S. Dollar strength.
This script uses request.security() to fetch the full OHLC data of DXY on the same timeframe as your active chart and renders it as true candlesticks in a separate pane.
This allows:
Real-time correlation monitoring
Inverse relationship observation (e.g., Gold vs DXY)
Structure confirmation before entries
⚙ How It Works
1️⃣ User selects DXY symbol (default: TVC:DXY)
2️⃣ Script retrieves Open, High, Low, Close from the selected symbol
3️⃣ Candlesticks are plotted in a non-overlay panel
4️⃣ Candle colors automatically adjust based on bullish/bearish close
The panel updates dynamically with your current chart timeframe.
📊 Practical Use Cases
Gold traders monitoring DXY rejection before entry
Forex traders confirming dollar momentum
Avoiding trades when DXY moves strongly against your bias
Observing divergence between asset and dollar strength
🔎 Why Use This Instead of Multi-Layout?
While TradingView Premium offers multi-chart layouts, this script provides:
Lightweight correlation tracking inside a single chart
Faster visual reference
Clean workflow without switching screens
It is not a replacement for full multi-layout functionality, but a streamlined correlation tool for focused analysis.
⚠ Important Notes
The script mirrors the selected symbol exactly as provided by TradingView data.
Correlation does not imply causation; use confirmation and risk management.
Symbol ticker may vary depending on your broker/data provider.
📌 Features
Adjustable symbol input
True candlestick rendering (OHLC)
Automatic bullish/bearish coloring
Separate panel for clean structure analysis
Timeframe-synced with main chart
Disclaimer:
For educational purposes only. Always combine correlation analysis with proper trade planning.
Instead of switching layouts or using multi-chart view, this script allows traders to monitor DXY price action in a dedicated lower panel while trading correlated instruments such as XAU/USD, EUR/USD, or GBP/USD.
🔍 Core Concept
Many instruments — especially Gold and major Forex pairs — are heavily influenced by U.S. Dollar strength.
This script uses request.security() to fetch the full OHLC data of DXY on the same timeframe as your active chart and renders it as true candlesticks in a separate pane.
This allows:
Real-time correlation monitoring
Inverse relationship observation (e.g., Gold vs DXY)
Structure confirmation before entries
⚙ How It Works
1️⃣ User selects DXY symbol (default: TVC:DXY)
2️⃣ Script retrieves Open, High, Low, Close from the selected symbol
3️⃣ Candlesticks are plotted in a non-overlay panel
4️⃣ Candle colors automatically adjust based on bullish/bearish close
The panel updates dynamically with your current chart timeframe.
📊 Practical Use Cases
Gold traders monitoring DXY rejection before entry
Forex traders confirming dollar momentum
Avoiding trades when DXY moves strongly against your bias
Observing divergence between asset and dollar strength
🔎 Why Use This Instead of Multi-Layout?
While TradingView Premium offers multi-chart layouts, this script provides:
Lightweight correlation tracking inside a single chart
Faster visual reference
Clean workflow without switching screens
It is not a replacement for full multi-layout functionality, but a streamlined correlation tool for focused analysis.
⚠ Important Notes
The script mirrors the selected symbol exactly as provided by TradingView data.
Correlation does not imply causation; use confirmation and risk management.
Symbol ticker may vary depending on your broker/data provider.
📌 Features
Adjustable symbol input
True candlestick rendering (OHLC)
Automatic bullish/bearish coloring
Separate panel for clean structure analysis
Timeframe-synced with main chart
Disclaimer:
For educational purposes only. Always combine correlation analysis with proper trade planning.

إخلاء المسؤولية
لا يُقصد بالمعلومات والمنشورات أن تكون، أو تشكل، أي نصيحة مالية أو استثمارية أو تجارية أو أنواع أخرى من النصائح أو التوصيات المقدمة أو المعتمدة من TradingView. اقرأ المزيد في شروط الاستخدام.
إخلاء المسؤولية
لا يُقصد بالمعلومات والمنشورات أن تكون، أو تشكل، أي نصيحة مالية أو استثمارية أو تجارية أو أنواع أخرى من النصائح أو التوصيات المقدمة أو المعتمدة من TradingView. اقرأ المزيد في شروط الاستخدام.