MESA Phase-Adaptive Band Trend [SchizoQuant]
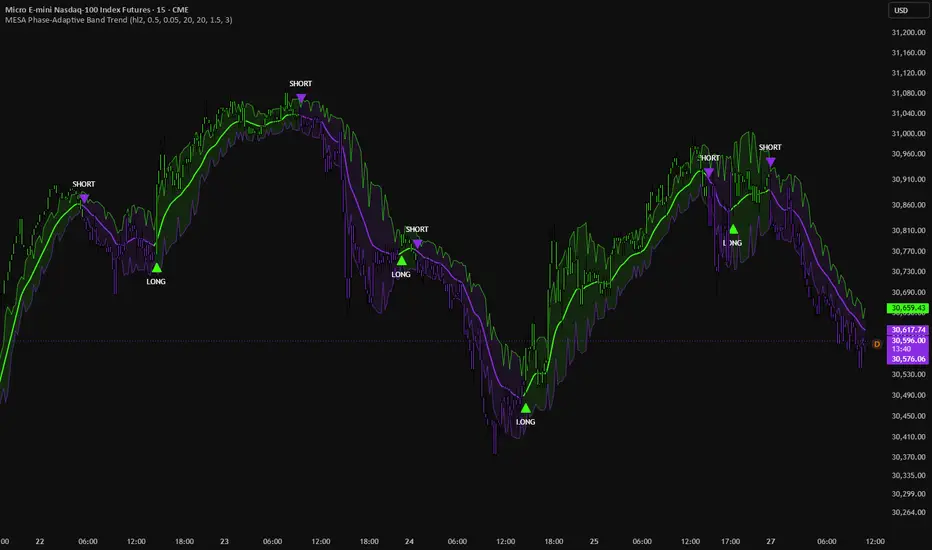
MESA Phase-Adaptive Band Trend is an adaptive trend-regime indicator that combines John F. Ehlers’ MESA/MAMA phase-estimation methodology with an EMA trend baseline and volatility-responsive bands.
Instead of using a conventional MAMA/FAMA pair as the final trend model, the indicator uses the underlying phase and dominant-cycle calculations from the MESA/MAMA framework to estimate how actively market phase is changing.
That phase response is then converted into an adaptive band multiplier.
When phase activity becomes stronger, the bands move toward the faster Active Multiplier.
When phase activity weakens, the bands move toward the slower Multiplier.
This creates a trend framework in which trend direction, phase behavior, and volatility are handled through separate mechanisms.
🟣 How It Works
The indicator is built from four main stages:
MESA / MAMA Phase Engine → Estimates dominant-cycle and phase behavior using Hilbert-transform-based calculations.
Phase Activity → Measures changes in market phase and converts them into a normalized adaptive response.
Trend Baseline → Uses an EMA as the central trend reference.
Adaptive Volatility Bands → Combines phase activity with return volatility to determine the bullish and bearish regime boundaries.
The resulting upper and lower bands define when the persistent trend regime changes.
🟣 MESA / MAMA Phase Engine
The phase engine is based on the MESA/MAMA methodology developed by John F. Ehlers.
Price is first passed through a weighted smoothing process.
The smoothed series is then processed through a Hilbert-transform sequence that calculates the detrender, quadrature component, in-phase component, and their phase-shifted counterparts.
These components are combined into smoothed in-phase and quadrature values.
The script then derives real and imaginary components from those values and uses their relationship to estimate the dominant market period.
The period estimate is constrained relative to its previous value so that it cannot change excessively from one bar to the next.
It is also bounded between 6 and 50 bars before additional smoothing is applied.
This produces the adaptive dominant-cycle estimate used by the phase calculation.
🟣 Phase Measurement
The relationship between the quadrature and in-phase components is used to estimate market phase.
The indicator then measures the change in phase from the previous bar.
This phase change determines the adaptive phase response.
Fast Limit defines the strongest response available to the system.
Slow Limit defines the minimum response during weaker phase movement.
The resulting response is normalized into a Phase Activity value between 0 and 1.
Higher Phase Activity represents stronger or faster phase movement.
Lower Phase Activity represents slower or weaker phase movement.
Although the phase engine is derived from the MESA/MAMA framework, the indicator does not construct a traditional MAMA/FAMA moving-average pair.
Instead, the phase information is used to control the sensitivity of the surrounding volatility bands.
🟣 Trend Baseline
The central trend line is calculated using an exponential moving average of the selected source.
Trend Length controls the responsiveness of this baseline.
Lower values allow the trend to react more quickly to recent price movement.
Higher values create a smoother and slower trend reference.
The EMA itself is not directly modified by the phase engine.
Instead, phase behavior controls the adaptive bands surrounding the trend.
🟣 Return Volatility
Volatility is measured using the standard deviation of one-bar percentage returns.
The current bands use the previous completed return-volatility value.
Volatility Length controls how much historical return data contributes to the volatility estimate.
Higher values create a steadier volatility measurement.
Lower values allow band width to react more quickly to recent changes in price dispersion.
🟣 Phase-Adaptive Bands
The band multiplier continuously moves between the user-defined Active Multiplier and Slow Multiplier.
When Phase Activity increases, the multiplier moves toward Active Multiplier.
When Phase Activity decreases, the multiplier moves toward Slow Multiplier.
The upper and lower bands are constructed around the EMA trend:
Upper Band = Trend + Adaptive Multiplier × Return Volatility × Trend
Lower Band = Trend - Adaptive Multiplier × Return Volatility × Trend
This creates two separate forms of adaptation.
MESA/MAMA phase behavior determines how sensitive the band system should be.
Return volatility determines the actual distance of the bands from the trend baseline.
🟣 Persistent Regime Logic
A bullish condition occurs when the current close is above the upper adaptive band.
A bearish condition occurs when the current close is below the lower adaptive band.
The existing regime remains active while price stays between the two bands.
Price above Upper Band → Bullish regime
Price below Lower Band → Bearish regime
Price between the bands → Previous regime remains active
LONG and SHORT markers therefore appear only when the active regime changes rather than on every bar that remains outside a band.
🟣 Main Settings
Source determines the price series used by the phase engine and EMA trend baseline.
Fast Limit controls the strongest phase response available to the adaptive process.
Slow Limit controls the minimum phase response during weaker phase activity.
Trend Length controls the EMA trend baseline.
Volatility Length controls the historical window used to estimate return dispersion.
Active Multiplier controls band width during stronger phase activity.
Slow Multiplier controls band width during weaker phase activity.
Show Bands displays or hides the adaptive upper and lower bands.
Show Fill displays or hides the shaded region between the bands.
Show Signals controls the visibility of LONG and SHORT regime-change markers.
Color Bars colors chart candles according to the currently active trend regime.
🟣 Design Purpose
Each component serves a separate role:
Weighted smoothing → Reduces short-term noise before phase analysis
MESA/MAMA phase engine → Estimates dominant-cycle and phase behavior
Dominant period → Stabilizes the adaptive phase calculation
Delta phase → Measures the rate of change in market phase
Phase response → Determines adaptive band sensitivity
EMA trend → Provides the central trend baseline
Return volatility → Determines adaptive band distance
Adaptive multiplier → Moves the system between faster and slower band sensitivity
Persistent regime → Maintains the active bullish or bearish trend state between boundary transitions
The main design characteristic is that trend direction, phase behavior, and volatility are handled independently.
The EMA defines the central trend.
The MESA/MAMA phase engine controls how responsive the bands should be.
Return volatility determines how far those bands are positioned from the trend.
This allows regime sensitivity to adapt to changing phase behavior without requiring the centerline itself to become aggressively adaptive.
🟣 Limitations
MESA Phase-Adaptive Band Trend is a trend-regime indicator and not a complete trading system.
LONG and SHORT markers identify changes in the indicator’s internal regime and do not imply guaranteed trading outcomes or future performance.
The MESA/MAMA phase calculations are derived from historical price behavior and their estimates evolve as new market data becomes available.
Phase behavior can vary significantly between assets, market conditions, and timeframes.
During quieter conditions, wider adaptive bands can delay regime changes.
During stronger phase activity, narrower bands can increase sensitivity to shorter-term price movement.
The volatility bands are based on historical return dispersion, so large recent price movements can widen the bands and increase the distance required for subsequent regime changes.
Like other band-based trend methods, abrupt reversals may require price to cross the opposite adaptive boundary before the persistent regime changes.
The script does not use higher-timeframe requests or lookahead logic.
Instead of using a conventional MAMA/FAMA pair as the final trend model, the indicator uses the underlying phase and dominant-cycle calculations from the MESA/MAMA framework to estimate how actively market phase is changing.
That phase response is then converted into an adaptive band multiplier.
When phase activity becomes stronger, the bands move toward the faster Active Multiplier.
When phase activity weakens, the bands move toward the slower Multiplier.
This creates a trend framework in which trend direction, phase behavior, and volatility are handled through separate mechanisms.
🟣 How It Works
The indicator is built from four main stages:
MESA / MAMA Phase Engine → Estimates dominant-cycle and phase behavior using Hilbert-transform-based calculations.
Phase Activity → Measures changes in market phase and converts them into a normalized adaptive response.
Trend Baseline → Uses an EMA as the central trend reference.
Adaptive Volatility Bands → Combines phase activity with return volatility to determine the bullish and bearish regime boundaries.
The resulting upper and lower bands define when the persistent trend regime changes.
🟣 MESA / MAMA Phase Engine
The phase engine is based on the MESA/MAMA methodology developed by John F. Ehlers.
Price is first passed through a weighted smoothing process.
The smoothed series is then processed through a Hilbert-transform sequence that calculates the detrender, quadrature component, in-phase component, and their phase-shifted counterparts.
These components are combined into smoothed in-phase and quadrature values.
The script then derives real and imaginary components from those values and uses their relationship to estimate the dominant market period.
The period estimate is constrained relative to its previous value so that it cannot change excessively from one bar to the next.
It is also bounded between 6 and 50 bars before additional smoothing is applied.
This produces the adaptive dominant-cycle estimate used by the phase calculation.
🟣 Phase Measurement
The relationship between the quadrature and in-phase components is used to estimate market phase.
The indicator then measures the change in phase from the previous bar.
This phase change determines the adaptive phase response.
Fast Limit defines the strongest response available to the system.
Slow Limit defines the minimum response during weaker phase movement.
The resulting response is normalized into a Phase Activity value between 0 and 1.
Higher Phase Activity represents stronger or faster phase movement.
Lower Phase Activity represents slower or weaker phase movement.
Although the phase engine is derived from the MESA/MAMA framework, the indicator does not construct a traditional MAMA/FAMA moving-average pair.
Instead, the phase information is used to control the sensitivity of the surrounding volatility bands.
🟣 Trend Baseline
The central trend line is calculated using an exponential moving average of the selected source.
Trend Length controls the responsiveness of this baseline.
Lower values allow the trend to react more quickly to recent price movement.
Higher values create a smoother and slower trend reference.
The EMA itself is not directly modified by the phase engine.
Instead, phase behavior controls the adaptive bands surrounding the trend.
🟣 Return Volatility
Volatility is measured using the standard deviation of one-bar percentage returns.
The current bands use the previous completed return-volatility value.
Volatility Length controls how much historical return data contributes to the volatility estimate.
Higher values create a steadier volatility measurement.
Lower values allow band width to react more quickly to recent changes in price dispersion.
🟣 Phase-Adaptive Bands
The band multiplier continuously moves between the user-defined Active Multiplier and Slow Multiplier.
When Phase Activity increases, the multiplier moves toward Active Multiplier.
When Phase Activity decreases, the multiplier moves toward Slow Multiplier.
The upper and lower bands are constructed around the EMA trend:
Upper Band = Trend + Adaptive Multiplier × Return Volatility × Trend
Lower Band = Trend - Adaptive Multiplier × Return Volatility × Trend
This creates two separate forms of adaptation.
MESA/MAMA phase behavior determines how sensitive the band system should be.
Return volatility determines the actual distance of the bands from the trend baseline.
🟣 Persistent Regime Logic
A bullish condition occurs when the current close is above the upper adaptive band.
A bearish condition occurs when the current close is below the lower adaptive band.
The existing regime remains active while price stays between the two bands.
Price above Upper Band → Bullish regime
Price below Lower Band → Bearish regime
Price between the bands → Previous regime remains active
LONG and SHORT markers therefore appear only when the active regime changes rather than on every bar that remains outside a band.
🟣 Main Settings
Source determines the price series used by the phase engine and EMA trend baseline.
Fast Limit controls the strongest phase response available to the adaptive process.
Slow Limit controls the minimum phase response during weaker phase activity.
Trend Length controls the EMA trend baseline.
Volatility Length controls the historical window used to estimate return dispersion.
Active Multiplier controls band width during stronger phase activity.
Slow Multiplier controls band width during weaker phase activity.
Show Bands displays or hides the adaptive upper and lower bands.
Show Fill displays or hides the shaded region between the bands.
Show Signals controls the visibility of LONG and SHORT regime-change markers.
Color Bars colors chart candles according to the currently active trend regime.
🟣 Design Purpose
Each component serves a separate role:
Weighted smoothing → Reduces short-term noise before phase analysis
MESA/MAMA phase engine → Estimates dominant-cycle and phase behavior
Dominant period → Stabilizes the adaptive phase calculation
Delta phase → Measures the rate of change in market phase
Phase response → Determines adaptive band sensitivity
EMA trend → Provides the central trend baseline
Return volatility → Determines adaptive band distance
Adaptive multiplier → Moves the system between faster and slower band sensitivity
Persistent regime → Maintains the active bullish or bearish trend state between boundary transitions
The main design characteristic is that trend direction, phase behavior, and volatility are handled independently.
The EMA defines the central trend.
The MESA/MAMA phase engine controls how responsive the bands should be.
Return volatility determines how far those bands are positioned from the trend.
This allows regime sensitivity to adapt to changing phase behavior without requiring the centerline itself to become aggressively adaptive.
🟣 Limitations
MESA Phase-Adaptive Band Trend is a trend-regime indicator and not a complete trading system.
LONG and SHORT markers identify changes in the indicator’s internal regime and do not imply guaranteed trading outcomes or future performance.
The MESA/MAMA phase calculations are derived from historical price behavior and their estimates evolve as new market data becomes available.
Phase behavior can vary significantly between assets, market conditions, and timeframes.
During quieter conditions, wider adaptive bands can delay regime changes.
During stronger phase activity, narrower bands can increase sensitivity to shorter-term price movement.
The volatility bands are based on historical return dispersion, so large recent price movements can widen the bands and increase the distance required for subsequent regime changes.
Like other band-based trend methods, abrupt reversals may require price to cross the opposite adaptive boundary before the persistent regime changes.
The script does not use higher-timeframe requests or lookahead logic.

🟣 Profitable Crypto Strategies | Free Trial — schizoquant.com
إخلاء المسؤولية
لا يُقصد بالمعلومات والمنشورات أن تكون، أو تشكل، أي نصيحة مالية أو استثمارية أو تجارية أو أنواع أخرى من النصائح أو التوصيات المقدمة أو المعتمدة من TradingView. اقرأ المزيد في شروط الاستخدام.
🟣 Profitable Crypto Strategies | Free Trial — schizoquant.com
إخلاء المسؤولية
لا يُقصد بالمعلومات والمنشورات أن تكون، أو تشكل، أي نصيحة مالية أو استثمارية أو تجارية أو أنواع أخرى من النصائح أو التوصيات المقدمة أو المعتمدة من TradingView. اقرأ المزيد في شروط الاستخدام.