OPEN-SOURCE SCRIPT
تم تحديثه RS Score (1-100) vs NQ/ES/YM - TP
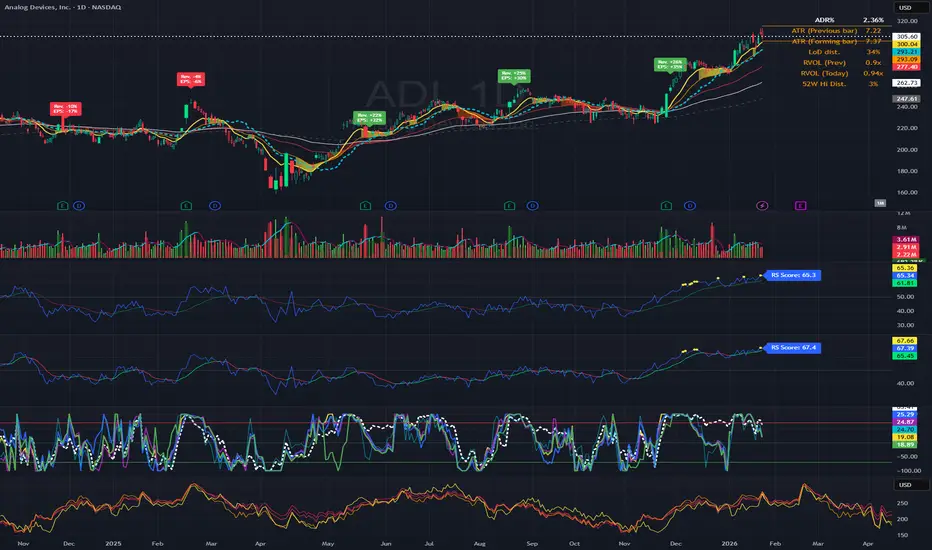
# RS Score (1–100) vs NQ/ES/YM — How to Use & Interpret
## What this indicator is doing
It gives you a **single score from 1 to 100** that tells you whether a stock is acting like a **leader** or a **laggard** compared to the **overall U.S. market** (Nasdaq + S&P + Dow), using about **1 year of data**.
---
## The core idea: “Is this stock beating the market?”
This script compares your stock to a blended benchmark of:
* **Nasdaq futures (NQ)**
* **S&P futures (ES)**
* **Dow futures (YM)**
### Why that matters
A stock can be going up, but if the market is going up faster, the stock is **not a leader**.
This tool answers:
* “Is this stock outperforming the big market?”
* “Is it doing it consistently, or is it just wild and noisy?”
---
## What the 1–100 score means
Think of **50** as the “middle line.”
### The most important rule
* **Above 50 = outperforming the market blend**
* **Below 50 = underperforming**
* **Around 50 = roughly market-like**
### Easy interpretation bands
* **80–100 (Strong Leader):** stock is outperforming the market clearly and consistently
* **60–80 (Healthy):** generally outperforming, decent leadership
* **45–60 (Neutral-ish):** not special, close to market performance
* **30–45 (Weak):** lagging the market
* **1–30 (Very Weak):** strong underperformance
**Think “leaders live above 50,” and “real leaders tend to stay 70+.”**
---
## Why this score is “smarter” than just comparing returns
This script doesn’t just ask *“did it outperform?”*
It also asks *“did it outperform in a clean, steady way?”*
So it penalizes:
* choppy, unstable performance
* “one lucky spike” moves
That’s why it’s great for finding **higher-quality leadership**.
---
## Timeframe consistency: why it works on Daily, Weekly, Monthly
You added **Lock to last completed Daily bar**.
That means:
* it uses the **same daily reference point** no matter what chart timeframe you switch to
* your RS score won’t “walk around” just because the current day/week/month is still forming
**Practical meaning:**
If your score says 72, it should be 72 whether you’re looking at Daily, Weekly, or Monthly (as of the last completed day).
---
## The “RS New High” marker (NH) — what it’s telling you
The marker shows when your RS score hits a **new high** over your chosen lookback period (default ~252 trading days).
### In plain terms:
> “This stock is now showing its strongest relative performance vs the market (in about a year).”
### Why it’s powerful
A lot of the best leaders:
* show RS new highs **before** price breaks out
* or show RS new highs **during** breakouts
**So NH is a “leadership confirmation” signal.**
### How to use NH in real life
* **Best case:** RS hits a new high **while price is near breakout levels**
→ this often means institutions are accumulating and the stock is acting like a leader
* **Okay case:** price makes new highs but RS does not
→ stock is rising, but it’s not leading (could still work, but less attractive)
---
## Divergences: when RS and price disagree
This is one of the most useful ways to use RS.
### Bearish divergence (warning)
**Price makes a higher high, but RS makes a lower high.**
In simple terms:
> “The stock is still going up, but it’s losing leadership versus the market.”
This often shows up before:
* pullbacks
* breakout failures
* trend weakening
* rotation into stronger names
**It’s a caution sign, not an automatic sell.**
### Bullish divergence (early strength)
**Price makes a lower low, but RS makes a higher low.**
In simple terms:
> “The stock is holding up better than the market — strength is building underneath.”
This can happen before:
* reversals
* strong bounce setups
* early leadership emergence
---
## How to use this indicator in a simple trading workflow
### 1) Screening (finding leaders)
When scanning charts:
* Prefer stocks **above 50**
* Strong candidates are typically **70+**
* Bonus points if you see **NH markers** recently
**Quick rule:**
If RS < 50, it’s usually not worth your time unless you’re hunting deep value turnarounds.
---
### 2) Breakouts (confirming quality)
When a stock is near a breakout point:
* You want RS to be **rising**
* Ideally RS is near highs or prints **NH**
If price breaks out but RS is weak:
* it’s more likely to be a “meh breakout”
* sometimes it works, but it’s less “leader-like”
---
### 3) Managing positions (leadership health check)
If you’re already holding:
* RS staying high and rising = healthy leadership
* RS rolling over while price still rises = **possible early warning**
* RS plunging under 50 = the stock is now **lagging the market** (big red flag)
---
## Common “mistakes” and how to avoid them
### Mistake 1: Thinking RS > 50 means “guaranteed winner”
No — it means it’s acting **stronger than the market**, but price action still matters.
Use it with:
* trend structure
* volume/accumulation
* breakout levels
### Mistake 2: Overreacting to one divergence
One divergence is a warning.
You want confirmation like:
* failed breakout
* heavy sell volume
* loss of key moving averages
* repeated RS lower highs
### Mistake 3: Comparing RS values across totally different markets without context
RS works best when:
* comparing stocks within the same broad market environment
* keeping the same benchmark blend and same lookback
---
## Simple cheat sheet
* **RS > 50:** outperforming market (good)
* **RS 70–100:** leader zone
* **NH marker:** strongest relative strength in lookback window (leadership confirmation)
* **Price HH + RS LH:** bearish divergence (leadership weakening)
* **Price LL + RS HL:** bullish divergence (strength building)
Thank you!
## What this indicator is doing
It gives you a **single score from 1 to 100** that tells you whether a stock is acting like a **leader** or a **laggard** compared to the **overall U.S. market** (Nasdaq + S&P + Dow), using about **1 year of data**.
---
## The core idea: “Is this stock beating the market?”
This script compares your stock to a blended benchmark of:
* **Nasdaq futures (NQ)**
* **S&P futures (ES)**
* **Dow futures (YM)**
### Why that matters
A stock can be going up, but if the market is going up faster, the stock is **not a leader**.
This tool answers:
* “Is this stock outperforming the big market?”
* “Is it doing it consistently, or is it just wild and noisy?”
---
## What the 1–100 score means
Think of **50** as the “middle line.”
### The most important rule
* **Above 50 = outperforming the market blend**
* **Below 50 = underperforming**
* **Around 50 = roughly market-like**
### Easy interpretation bands
* **80–100 (Strong Leader):** stock is outperforming the market clearly and consistently
* **60–80 (Healthy):** generally outperforming, decent leadership
* **45–60 (Neutral-ish):** not special, close to market performance
* **30–45 (Weak):** lagging the market
* **1–30 (Very Weak):** strong underperformance
**Think “leaders live above 50,” and “real leaders tend to stay 70+.”**
---
## Why this score is “smarter” than just comparing returns
This script doesn’t just ask *“did it outperform?”*
It also asks *“did it outperform in a clean, steady way?”*
So it penalizes:
* choppy, unstable performance
* “one lucky spike” moves
That’s why it’s great for finding **higher-quality leadership**.
---
## Timeframe consistency: why it works on Daily, Weekly, Monthly
You added **Lock to last completed Daily bar**.
That means:
* it uses the **same daily reference point** no matter what chart timeframe you switch to
* your RS score won’t “walk around” just because the current day/week/month is still forming
**Practical meaning:**
If your score says 72, it should be 72 whether you’re looking at Daily, Weekly, or Monthly (as of the last completed day).
---
## The “RS New High” marker (NH) — what it’s telling you
The marker shows when your RS score hits a **new high** over your chosen lookback period (default ~252 trading days).
### In plain terms:
> “This stock is now showing its strongest relative performance vs the market (in about a year).”
### Why it’s powerful
A lot of the best leaders:
* show RS new highs **before** price breaks out
* or show RS new highs **during** breakouts
**So NH is a “leadership confirmation” signal.**
### How to use NH in real life
* **Best case:** RS hits a new high **while price is near breakout levels**
→ this often means institutions are accumulating and the stock is acting like a leader
* **Okay case:** price makes new highs but RS does not
→ stock is rising, but it’s not leading (could still work, but less attractive)
---
## Divergences: when RS and price disagree
This is one of the most useful ways to use RS.
### Bearish divergence (warning)
**Price makes a higher high, but RS makes a lower high.**
In simple terms:
> “The stock is still going up, but it’s losing leadership versus the market.”
This often shows up before:
* pullbacks
* breakout failures
* trend weakening
* rotation into stronger names
**It’s a caution sign, not an automatic sell.**
### Bullish divergence (early strength)
**Price makes a lower low, but RS makes a higher low.**
In simple terms:
> “The stock is holding up better than the market — strength is building underneath.”
This can happen before:
* reversals
* strong bounce setups
* early leadership emergence
---
## How to use this indicator in a simple trading workflow
### 1) Screening (finding leaders)
When scanning charts:
* Prefer stocks **above 50**
* Strong candidates are typically **70+**
* Bonus points if you see **NH markers** recently
**Quick rule:**
If RS < 50, it’s usually not worth your time unless you’re hunting deep value turnarounds.
---
### 2) Breakouts (confirming quality)
When a stock is near a breakout point:
* You want RS to be **rising**
* Ideally RS is near highs or prints **NH**
If price breaks out but RS is weak:
* it’s more likely to be a “meh breakout”
* sometimes it works, but it’s less “leader-like”
---
### 3) Managing positions (leadership health check)
If you’re already holding:
* RS staying high and rising = healthy leadership
* RS rolling over while price still rises = **possible early warning**
* RS plunging under 50 = the stock is now **lagging the market** (big red flag)
---
## Common “mistakes” and how to avoid them
### Mistake 1: Thinking RS > 50 means “guaranteed winner”
No — it means it’s acting **stronger than the market**, but price action still matters.
Use it with:
* trend structure
* volume/accumulation
* breakout levels
### Mistake 2: Overreacting to one divergence
One divergence is a warning.
You want confirmation like:
* failed breakout
* heavy sell volume
* loss of key moving averages
* repeated RS lower highs
### Mistake 3: Comparing RS values across totally different markets without context
RS works best when:
* comparing stocks within the same broad market environment
* keeping the same benchmark blend and same lookback
---
## Simple cheat sheet
* **RS > 50:** outperforming market (good)
* **RS 70–100:** leader zone
* **NH marker:** strongest relative strength in lookback window (leadership confirmation)
* **Price HH + RS LH:** bearish divergence (leadership weakening)
* **Price LL + RS HL:** bullish divergence (strength building)
Thank you!
ملاحظات الأخبار
Added an RS EMA line for RS scoreملاحظات الأخبار
I updated my RS Score script so it now benchmarks a stock against four customizable indices (renamed to Index 1–4), with Index 4 defaulting to Russell 1000 futures. I also added a benchmark mode toggle so I can compare against one index only (1, 2, 3, or 4) or use a blended benchmark with weights — either Blend of Index 1–3 or Blend of Index 1–4. If auto-normalize is enabled, the blend weights automatically scale to a clean 100% total.نص برمجي مفتوح المصدر
بروح TradingView الحقيقية، قام مبتكر هذا النص البرمجي بجعله مفتوح المصدر، بحيث يمكن للمتداولين مراجعة وظائفه والتحقق منها. شكرا للمؤلف! بينما يمكنك استخدامه مجانًا، تذكر أن إعادة نشر الكود يخضع لقواعد الموقع الخاصة بنا.

إخلاء المسؤولية
لا يُقصد بالمعلومات والمنشورات أن تكون، أو تشكل، أي نصيحة مالية أو استثمارية أو تجارية أو أنواع أخرى من النصائح أو التوصيات المقدمة أو المعتمدة من TradingView. اقرأ المزيد في شروط الاستخدام.
نص برمجي مفتوح المصدر
بروح TradingView الحقيقية، قام مبتكر هذا النص البرمجي بجعله مفتوح المصدر، بحيث يمكن للمتداولين مراجعة وظائفه والتحقق منها. شكرا للمؤلف! بينما يمكنك استخدامه مجانًا، تذكر أن إعادة نشر الكود يخضع لقواعد الموقع الخاصة بنا.
إخلاء المسؤولية
لا يُقصد بالمعلومات والمنشورات أن تكون، أو تشكل، أي نصيحة مالية أو استثمارية أو تجارية أو أنواع أخرى من النصائح أو التوصيات المقدمة أو المعتمدة من TradingView. اقرأ المزيد في شروط الاستخدام.