Time-Price Volume Heatmap with Liquidity Sweeps
What it does
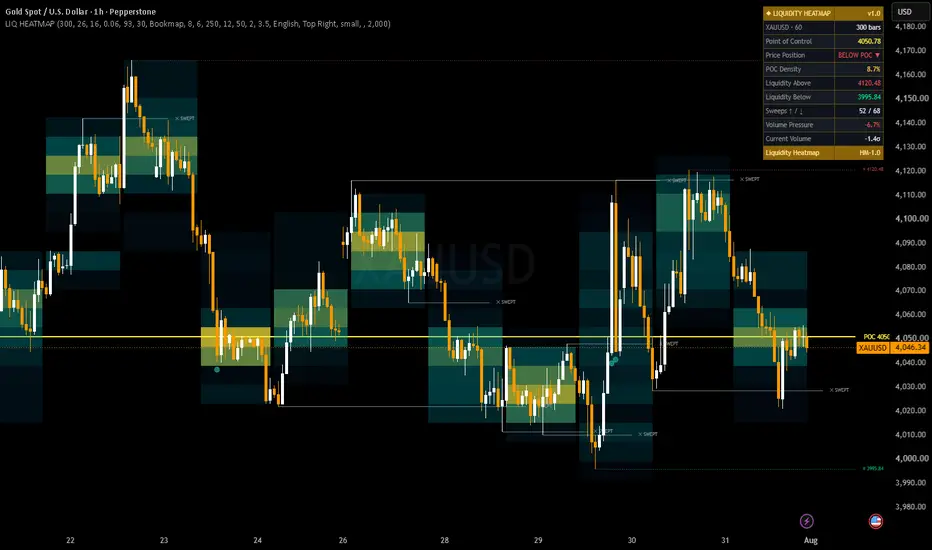
Most volume tools compress everything into a single vertical profile, so you can see at which price volume traded, but not when. This script splits the lookback window into a grid of time columns × price rows and paints each cell by how much volume was actually traded inside it — producing a time-and-price heatmap of where activity concentrated as the market moved.
On top of that map it tracks the resting liquidity pools that price left behind, and flags the exact bar where each pool is taken.
How it is calculated
The heatmap
The lookback window (default 300 bars) is divided into Time Resolution columns (default 16) and Price Resolution rows (default 26), built between the highest high and lowest low of the window.
For every bar, its volume is distributed evenly across all price rows its high-low range covers. A bar spanning 5 rows adds one fifth of its volume to each. This approximates where inside the candle the activity sat, rather than assigning it all to the close.
Each cell is normalised against the busiest cell in the grid and coloured on a 3-stop gradient. Transparency scales with intensity, so cold zones stay faint and hot zones glow. Cells below Min Intensity are not drawn at all — this keeps the chart readable and stays inside the 500-object limit.
Point of Control Rows are summed across all columns; the heaviest row is drawn as the POC line. The panel also shows POC Density — that row's share of total mapped volume. A high number means volume is concentrated on one shelf; a low number means it is spread out.
Liquidity pools Confirmed pivot highs and lows (Pivot Strength, default 8) mark levels where stop orders typically rest. Each is drawn as a dotted line extending right, labelled with its price. When price trades through a level it is re-drawn solid grey and marked SWEPT, and the sweep counter increments. Levels older than Level Max Age are removed automatically.
Volume bursts Volume is converted to a z-score over Volume Window bars. Two dot sizes mark bars above the strong (2σ) and extreme (3.5σ) thresholds — useful for spotting which bar actually did the damage at a level.
Volume Pressure Volume of up-closes minus volume of down-closes across the window, expressed as a percentage of total. A rough directional bias for the mapped period.
How to read it
Hot zones = price spent time and volume there. They tend to act as magnets and as friction; moves through them are usually slower.
Cold gaps = thin areas. Price often travels through them quickly.
A sweep followed by an immediate move back inside the previous range is the classic liquidity-grab pattern. The sweep marker plus an extreme volume dot on the same bar is the strongest version of it.
POC as reference: the panel tells you whether price is above or below the heaviest shelf.
Most volume tools compress everything into a single vertical profile, so you can see at which price volume traded, but not when. This script splits the lookback window into a grid of time columns × price rows and paints each cell by how much volume was actually traded inside it — producing a time-and-price heatmap of where activity concentrated as the market moved.
On top of that map it tracks the resting liquidity pools that price left behind, and flags the exact bar where each pool is taken.
How it is calculated
The heatmap
The lookback window (default 300 bars) is divided into Time Resolution columns (default 16) and Price Resolution rows (default 26), built between the highest high and lowest low of the window.
For every bar, its volume is distributed evenly across all price rows its high-low range covers. A bar spanning 5 rows adds one fifth of its volume to each. This approximates where inside the candle the activity sat, rather than assigning it all to the close.
Each cell is normalised against the busiest cell in the grid and coloured on a 3-stop gradient. Transparency scales with intensity, so cold zones stay faint and hot zones glow. Cells below Min Intensity are not drawn at all — this keeps the chart readable and stays inside the 500-object limit.
Point of Control Rows are summed across all columns; the heaviest row is drawn as the POC line. The panel also shows POC Density — that row's share of total mapped volume. A high number means volume is concentrated on one shelf; a low number means it is spread out.
Liquidity pools Confirmed pivot highs and lows (Pivot Strength, default 8) mark levels where stop orders typically rest. Each is drawn as a dotted line extending right, labelled with its price. When price trades through a level it is re-drawn solid grey and marked SWEPT, and the sweep counter increments. Levels older than Level Max Age are removed automatically.
Volume bursts Volume is converted to a z-score over Volume Window bars. Two dot sizes mark bars above the strong (2σ) and extreme (3.5σ) thresholds — useful for spotting which bar actually did the damage at a level.
Volume Pressure Volume of up-closes minus volume of down-closes across the window, expressed as a percentage of total. A rough directional bias for the mapped period.
How to read it
Hot zones = price spent time and volume there. They tend to act as magnets and as friction; moves through them are usually slower.
Cold gaps = thin areas. Price often travels through them quickly.
A sweep followed by an immediate move back inside the previous range is the classic liquidity-grab pattern. The sweep marker plus an extreme volume dot on the same bar is the strongest version of it.
POC as reference: the panel tells you whether price is above or below the heaviest shelf.

Trade in your language. AlgoForex Global in English, Chinese, Spanish, Arabic and French: free indicators, MT5 bots, Education live signals, market news, economic calendar, academy and 50+ trading tools. algoforexglobal.com/
إخلاء المسؤولية
لا يُقصد بالمعلومات والمنشورات أن تكون، أو تشكل، أي نصيحة مالية أو استثمارية أو تجارية أو أنواع أخرى من النصائح أو التوصيات المقدمة أو المعتمدة من TradingView. اقرأ المزيد في شروط الاستخدام.
Trade in your language. AlgoForex Global in English, Chinese, Spanish, Arabic and French: free indicators, MT5 bots, Education live signals, market news, economic calendar, academy and 50+ trading tools. algoforexglobal.com/
إخلاء المسؤولية
لا يُقصد بالمعلومات والمنشورات أن تكون، أو تشكل، أي نصيحة مالية أو استثمارية أو تجارية أو أنواع أخرى من النصائح أو التوصيات المقدمة أو المعتمدة من TradingView. اقرأ المزيد في شروط الاستخدام.