Nifty Day Session Lines
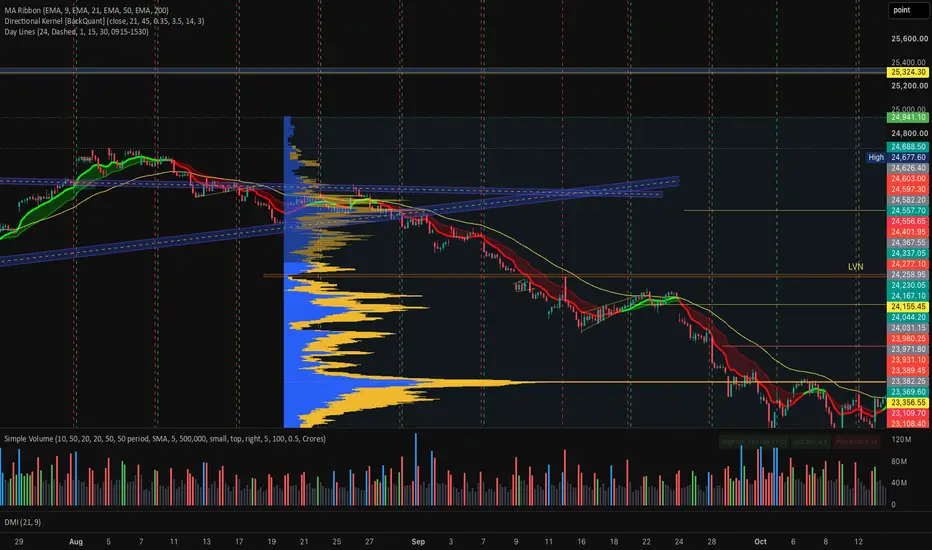
Nifty Day Session Lines
Marks the start and end of the trading session on intraday charts with vertical lines, so you can see where each day begins and ends. It was built for Indian markets (NSE/BSE, 9:15 AM - 3:30 PM IST), but works on any intraday chart.
HOW IT WORKS
- A Start line is drawn on the first candle of each selected day.
- An End line is drawn on the last candle of each selected day.
- The indicator uses the Asia/Kolkata timezone, so lines stay accurate on Indian symbols.
FEATURES
- Per-day control: choose Start and/or End separately for Monday to Sunday. For example, only the Monday Start line and the Friday End line, which suits weekly strategies.
- Show last N weeks: limit how many weeks of lines are drawn to keep the chart clean. Set 0 to draw all history.
- Custom styling: choose colours for Start and End lines, line style (Solid / Dotted / Dashed) and width.
- Optional day labels (Mon, Tue...) on Start lines.
- Optional session shading for the selected days.
- Adjustable session end time for special sessions.
HOW TO USE
1. Add the indicator to an intraday chart (5m, 10m, 15m, 30m, 1h).
2. Open Settings > Inputs and tick Start / End for the days you want.
3. Set "Show last N weeks" to control how many lines are drawn.
NOTES
- Works on intraday timeframes only. On Daily or higher it shows a reminder label.
- The number of lines you can see depends on how much historical data TradingView loads for your timeframe.
- The End line for the current day appears once the closing candle (3:30 PM) has formed.
This indicator is a visual aid only. It does not generate buy/sell signals and is not financial advice.
Marks the start and end of the trading session on intraday charts with vertical lines, so you can see where each day begins and ends. It was built for Indian markets (NSE/BSE, 9:15 AM - 3:30 PM IST), but works on any intraday chart.
HOW IT WORKS
- A Start line is drawn on the first candle of each selected day.
- An End line is drawn on the last candle of each selected day.
- The indicator uses the Asia/Kolkata timezone, so lines stay accurate on Indian symbols.
FEATURES
- Per-day control: choose Start and/or End separately for Monday to Sunday. For example, only the Monday Start line and the Friday End line, which suits weekly strategies.
- Show last N weeks: limit how many weeks of lines are drawn to keep the chart clean. Set 0 to draw all history.
- Custom styling: choose colours for Start and End lines, line style (Solid / Dotted / Dashed) and width.
- Optional day labels (Mon, Tue...) on Start lines.
- Optional session shading for the selected days.
- Adjustable session end time for special sessions.
HOW TO USE
1. Add the indicator to an intraday chart (5m, 10m, 15m, 30m, 1h).
2. Open Settings > Inputs and tick Start / End for the days you want.
3. Set "Show last N weeks" to control how many lines are drawn.
NOTES
- Works on intraday timeframes only. On Daily or higher it shows a reminder label.
- The number of lines you can see depends on how much historical data TradingView loads for your timeframe.
- The End line for the current day appears once the closing candle (3:30 PM) has formed.
This indicator is a visual aid only. It does not generate buy/sell signals and is not financial advice.

إخلاء المسؤولية
لا يُقصد بالمعلومات والمنشورات أن تكون، أو تشكل، أي نصيحة مالية أو استثمارية أو تجارية أو أنواع أخرى من النصائح أو التوصيات المقدمة أو المعتمدة من TradingView. اقرأ المزيد في شروط الاستخدام.
إخلاء المسؤولية
لا يُقصد بالمعلومات والمنشورات أن تكون، أو تشكل، أي نصيحة مالية أو استثمارية أو تجارية أو أنواع أخرى من النصائح أو التوصيات المقدمة أو المعتمدة من TradingView. اقرأ المزيد في شروط الاستخدام.