Pivot Dashboard [KG]
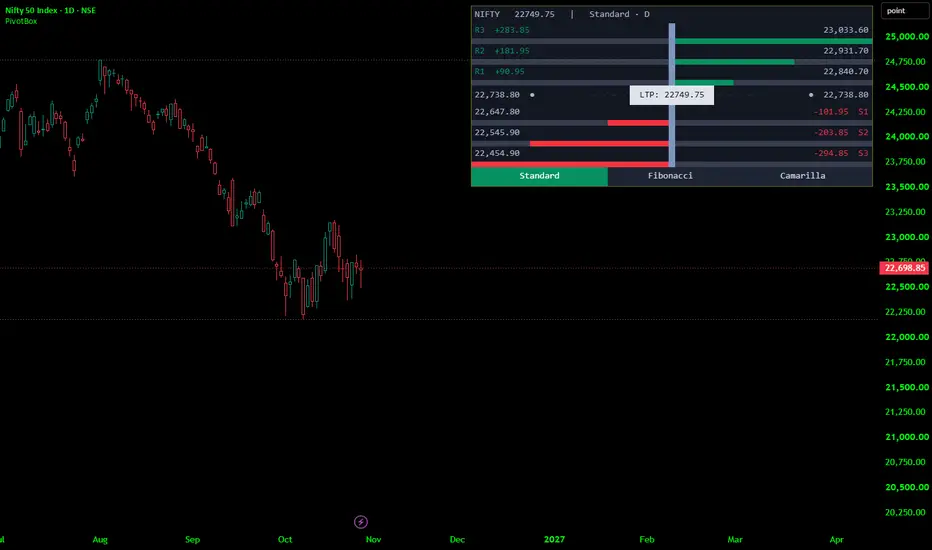
Pivot Dashboard that draws a floating, table-style information panel on top of the price chart. The panel presents the seven classic pivot levels — three resistances, the central pivot, and three supports — for a chosen timeframe and a chosen pivot formula, and it surrounds each level with a compact set of visual aids: the exact price, the distance from the current price, and a horizontal bar that shows how far that level sits from the market relative to the other levels on screen.
The panel is designed to be glanceable. Everything is aligned to a narrow centre marker that represents "zero distance", with resistance information reading outward to the right and support information reading outward to the left. The result is a symmetric, ruler-like display that answers three questions at once: where are the levels, how far away are they, and how do they rank against each other?
The indicator does not plot lines on the price itself. It is purely a dashboard. It also does not place orders, generate signals, or make any recommendation — it is a reference display.
The Layout, Row by Row:-
The panel is assembled from a fixed grid of twenty-one narrow columns: ten on the left of a slim centre column, and ten on the right. The centre column is the zero line.
From top to bottom, the panel contains:
1. A hairline ruler row. A single near-invisible row that pins the column widths so the rest of the panel keeps a stable geometry.
2. A header row. Unless Compact mode is enabled, the first visible row shows, in one line: the instrument's ticker, the current reference price, and the active pivot formula and timeframe. If the pivot timeframe is lower than the chart timeframe, a warning flag appears here — a deliberate safeguard, because a pivot taken from a smaller timeframe than the chart is not a meaningful higher-timeframe reference.
3. Six pairs of level rows (text + bar). Each visible level gets two rows:
A text row. For a resistance level, the left half shows the level name and its signed distance from the reference price, and the right half shows the level's price. For a support level, this is mirrored: the left half shows the price, and the right half shows the distance and the level name. The accent colour (green for resistance, red for support) is applied only to the informational side — the side carrying the name and the distance — so the eye is drawn to what matters without the price being lost in colour.
A bar row. A track of ten segments per side. Resistance bars grow outward to the right from the centre line; support bars grow outward to the left. A level sitting exactly at the reference price has no filled segments; a level at or beyond the normalisation scale fills the full ten.
4. The pivot row. The central pivot is treated differently because it is the level that price most often oscillates around. Its row shows the pivot value with a marker dot on both the far left and the far right, dashed connector segments leading inward, and a highlighted central tag reading the live reference price. This row doubles as the anchor of the entire display: the pivot value is stated on both wings, and the current price sits precisely in the middle.
5. A selector row. Three cells — Standard, Fibonacci, Camarilla — laid out across the bottom. The currently active formula is filled with the highlight colour; the other two are muted. Note: this row is a read-out, not a button. Charting-platform tables are not interactive, so the selector reports which mode you have chosen in the settings rather than acting as a clickable switch.
The Numbers Behind the Levels:
All seven levels are derived from a single triple of inputs: the high, the low, and the close of the previous completed period on the selected timeframe. Three formulas are available.
Standard (classic floor-trader pivots). The pivot is the average of the three inputs. The main range is the previous high minus the previous low. The first resistance and support are placed symmetrically one full pivot-distance above and below the pivot relative to the low and the high. The second resistance and support step one further full range from the pivot. The third pair extends the same construction to the outer edge.
Fibonacci. The pivot is computed identically, but the six surrounding levels are placed at the 38.2%, 61.8%, and 100% retracement of the previous range above and below the pivot. This produces a noticeably tighter cluster near the pivot and a wider gap at the outermost level, which many traders prefer for scaling in and out.
Camarilla. The pivot is still shown for reference, but the six trading levels are built from the previous close rather than the pivot, at fixed fractions of the range — roughly 9.2%, 18.3%, and 27.5% of the range above and below the close. Camarilla levels are characteristically close to the previous close, which makes them suited to intraday mean-reversion work rather than to wide swing targets.
Because the three formulas respond very differently to the same input data, switching modes instantly changes the shape of the bar chart: Fibonacci tends to compress the inner bars and stretch the outer ones, while Camarilla produces a tight, evenly spaced stack near the centre.
The Reference Price:
Two reference options are offered.
Live close uses the current, still-forming price. Bars and distances then breathe in real time as the market moves — the natural choice for a live dashboard.
Last confirmed close uses the most recently closed bar's price. This freezes the display within each bar and only steps forward when a new bar opens, which makes screenshots stable and avoids flicker on fast-moving instruments.
The reference price appears in three places: in the header, in the central tag on the pivot row, and implicitly in every distance figure and every bar length. Distance figures are always shown with an explicit plus or minus sign and with thousands separators, and prices are formatted to the instrument's own tick precision — so an index quoted to two decimals and a crypto pair quoted to six both read correctly without manual adjustment.
How the Bars Are Scaled:
The bar lengths are what turn the panel from a list into a comparison tool. Two normalisation modes control the scale.
Auto (farthest level). The script measures the distance from the reference price to every visible non-pivot level, takes the largest of those distances, and treats it as a full bar. Every other level is then drawn as a fraction of that. The consequence is that the farthest visible level always fills the track completely, and the remaining levels visibly rank themselves between the centre and that extreme. Hide a level in the settings and the scale instantly re-fits to the new farthest neighbour.
Fixed percentage of price. Instead of adapting, the script treats a user-defined percentage of the current price as the full bar. This is the better choice when you want a consistent visual yardstick across different instruments or different sessions — a level that looks half-full always means the same thing, rather than meaning "half as far as the current outlier".
In both modes, fills are capped at ten segments, so a level far beyond the scale simply shows a full bar rather than an error. If the scale ever computes to zero or an unusable value — for example, when price sits exactly on every level — the script quietly substitutes a safe fallback so the display never breaks.
Data Integrity:
The pivot triple is fetched from the previous completed candle of the chosen timeframe, using the documented non-repainting request pattern. In practical terms: once a daily candle closes, its high, low, and close are fixed, and the resulting levels stay fixed for the whole of the following day. The levels do not shift retroactively as new bars form. They change exactly once per period boundary, at the moment the new period begins — which is the behaviour a pivot level is supposed to have.
The panel itself is drawn only on the most recent bar, and its cells are created once and then reused, with colours and text refreshed on each update. This keeps the script efficient and avoids the flicker and performance cost of rebuilding a large table on every tick. The trade-off is that the dashboard does not appear when you scroll back through history; it lives at the live edge of the chart.
Settings at a Glance:-
Pivot settings. Formula (Standard / Fibonacci / Camarilla), timeframe (Daily, Weekly, Monthly, or a custom timeframe you type), and the reference price source.
Panel layout. Panel position (nine anchor points, from top-left to bottom-right), panel width as a percentage of chart width, text size (Tiny through Huge), row-height scale for fine-tuning density, a Compact mode that removes the header and tightens rows, track thickness as a percentage of chart height, bar normalisation mode and its fixed-percentage value, and panel background transparency.
Row visibility. Individual switches for each of the six surrounding levels. The pivot row is always shown, since it anchors the display.
Theme and colours. A theme selector (Auto, Light, Dark) that, in Auto, samples the chart background's luminance and picks the appropriate palette automatically; separate colour pickers for resistance elements, support elements, and the selector highlight. Panel background, frame, track, text, marker, and tag colours are all derived from the chosen theme, so the panel remains legible on white, black, or coloured backgrounds.
Text size and row-height scale work together: choosing a larger font automatically increases row heights, so nothing is ever squeezed or clipped.
How to Read It in Practice:-
A quick read of the panel answers four questions in order:
Where is price relative to the pivot? If the central tag sits above the pivot value, the session is trading in the upper half of the structure; below, the lower half.
Which levels are close? The shortest bars are the nearest levels — those are the ones price is most likely to interact with first. Long bars are distant objectives.
How crowded is the structure? If several bars are of similar length, the levels are clustered, and price may chop between them. If the bars fan out evenly, the structure is well spread.
Is anything extreme? A full bar means the level is the farthest visible one under the current scale, not that it is unreachable — read it as "the outermost reference on screen", not as a forecast.
Typical uses include identifying intraday reaction zones around the pivot, planning fade entries at the first support or resistance, using Camarilla levels for tight mean-reversion setups, and using Fibonacci levels for broader swing targets. The dashboard supports those workflows; it does not select them for you.
Disclaimer:
This indicator is provided for educational and informational purposes only. It is a visualisation tool for price levels derived from publicly available price data; it is not a trading system, a signal service, or investment advice.
The panel is designed to be glanceable. Everything is aligned to a narrow centre marker that represents "zero distance", with resistance information reading outward to the right and support information reading outward to the left. The result is a symmetric, ruler-like display that answers three questions at once: where are the levels, how far away are they, and how do they rank against each other?
The indicator does not plot lines on the price itself. It is purely a dashboard. It also does not place orders, generate signals, or make any recommendation — it is a reference display.
The Layout, Row by Row:-
The panel is assembled from a fixed grid of twenty-one narrow columns: ten on the left of a slim centre column, and ten on the right. The centre column is the zero line.
From top to bottom, the panel contains:
1. A hairline ruler row. A single near-invisible row that pins the column widths so the rest of the panel keeps a stable geometry.
2. A header row. Unless Compact mode is enabled, the first visible row shows, in one line: the instrument's ticker, the current reference price, and the active pivot formula and timeframe. If the pivot timeframe is lower than the chart timeframe, a warning flag appears here — a deliberate safeguard, because a pivot taken from a smaller timeframe than the chart is not a meaningful higher-timeframe reference.
3. Six pairs of level rows (text + bar). Each visible level gets two rows:
A text row. For a resistance level, the left half shows the level name and its signed distance from the reference price, and the right half shows the level's price. For a support level, this is mirrored: the left half shows the price, and the right half shows the distance and the level name. The accent colour (green for resistance, red for support) is applied only to the informational side — the side carrying the name and the distance — so the eye is drawn to what matters without the price being lost in colour.
A bar row. A track of ten segments per side. Resistance bars grow outward to the right from the centre line; support bars grow outward to the left. A level sitting exactly at the reference price has no filled segments; a level at or beyond the normalisation scale fills the full ten.
4. The pivot row. The central pivot is treated differently because it is the level that price most often oscillates around. Its row shows the pivot value with a marker dot on both the far left and the far right, dashed connector segments leading inward, and a highlighted central tag reading the live reference price. This row doubles as the anchor of the entire display: the pivot value is stated on both wings, and the current price sits precisely in the middle.
5. A selector row. Three cells — Standard, Fibonacci, Camarilla — laid out across the bottom. The currently active formula is filled with the highlight colour; the other two are muted. Note: this row is a read-out, not a button. Charting-platform tables are not interactive, so the selector reports which mode you have chosen in the settings rather than acting as a clickable switch.
The Numbers Behind the Levels:
All seven levels are derived from a single triple of inputs: the high, the low, and the close of the previous completed period on the selected timeframe. Three formulas are available.
Standard (classic floor-trader pivots). The pivot is the average of the three inputs. The main range is the previous high minus the previous low. The first resistance and support are placed symmetrically one full pivot-distance above and below the pivot relative to the low and the high. The second resistance and support step one further full range from the pivot. The third pair extends the same construction to the outer edge.
Fibonacci. The pivot is computed identically, but the six surrounding levels are placed at the 38.2%, 61.8%, and 100% retracement of the previous range above and below the pivot. This produces a noticeably tighter cluster near the pivot and a wider gap at the outermost level, which many traders prefer for scaling in and out.
Camarilla. The pivot is still shown for reference, but the six trading levels are built from the previous close rather than the pivot, at fixed fractions of the range — roughly 9.2%, 18.3%, and 27.5% of the range above and below the close. Camarilla levels are characteristically close to the previous close, which makes them suited to intraday mean-reversion work rather than to wide swing targets.
Because the three formulas respond very differently to the same input data, switching modes instantly changes the shape of the bar chart: Fibonacci tends to compress the inner bars and stretch the outer ones, while Camarilla produces a tight, evenly spaced stack near the centre.
The Reference Price:
Two reference options are offered.
Live close uses the current, still-forming price. Bars and distances then breathe in real time as the market moves — the natural choice for a live dashboard.
Last confirmed close uses the most recently closed bar's price. This freezes the display within each bar and only steps forward when a new bar opens, which makes screenshots stable and avoids flicker on fast-moving instruments.
The reference price appears in three places: in the header, in the central tag on the pivot row, and implicitly in every distance figure and every bar length. Distance figures are always shown with an explicit plus or minus sign and with thousands separators, and prices are formatted to the instrument's own tick precision — so an index quoted to two decimals and a crypto pair quoted to six both read correctly without manual adjustment.
How the Bars Are Scaled:
The bar lengths are what turn the panel from a list into a comparison tool. Two normalisation modes control the scale.
Auto (farthest level). The script measures the distance from the reference price to every visible non-pivot level, takes the largest of those distances, and treats it as a full bar. Every other level is then drawn as a fraction of that. The consequence is that the farthest visible level always fills the track completely, and the remaining levels visibly rank themselves between the centre and that extreme. Hide a level in the settings and the scale instantly re-fits to the new farthest neighbour.
Fixed percentage of price. Instead of adapting, the script treats a user-defined percentage of the current price as the full bar. This is the better choice when you want a consistent visual yardstick across different instruments or different sessions — a level that looks half-full always means the same thing, rather than meaning "half as far as the current outlier".
In both modes, fills are capped at ten segments, so a level far beyond the scale simply shows a full bar rather than an error. If the scale ever computes to zero or an unusable value — for example, when price sits exactly on every level — the script quietly substitutes a safe fallback so the display never breaks.
Data Integrity:
The pivot triple is fetched from the previous completed candle of the chosen timeframe, using the documented non-repainting request pattern. In practical terms: once a daily candle closes, its high, low, and close are fixed, and the resulting levels stay fixed for the whole of the following day. The levels do not shift retroactively as new bars form. They change exactly once per period boundary, at the moment the new period begins — which is the behaviour a pivot level is supposed to have.
The panel itself is drawn only on the most recent bar, and its cells are created once and then reused, with colours and text refreshed on each update. This keeps the script efficient and avoids the flicker and performance cost of rebuilding a large table on every tick. The trade-off is that the dashboard does not appear when you scroll back through history; it lives at the live edge of the chart.
Settings at a Glance:-
Pivot settings. Formula (Standard / Fibonacci / Camarilla), timeframe (Daily, Weekly, Monthly, or a custom timeframe you type), and the reference price source.
Panel layout. Panel position (nine anchor points, from top-left to bottom-right), panel width as a percentage of chart width, text size (Tiny through Huge), row-height scale for fine-tuning density, a Compact mode that removes the header and tightens rows, track thickness as a percentage of chart height, bar normalisation mode and its fixed-percentage value, and panel background transparency.
Row visibility. Individual switches for each of the six surrounding levels. The pivot row is always shown, since it anchors the display.
Theme and colours. A theme selector (Auto, Light, Dark) that, in Auto, samples the chart background's luminance and picks the appropriate palette automatically; separate colour pickers for resistance elements, support elements, and the selector highlight. Panel background, frame, track, text, marker, and tag colours are all derived from the chosen theme, so the panel remains legible on white, black, or coloured backgrounds.
Text size and row-height scale work together: choosing a larger font automatically increases row heights, so nothing is ever squeezed or clipped.
How to Read It in Practice:-
A quick read of the panel answers four questions in order:
Where is price relative to the pivot? If the central tag sits above the pivot value, the session is trading in the upper half of the structure; below, the lower half.
Which levels are close? The shortest bars are the nearest levels — those are the ones price is most likely to interact with first. Long bars are distant objectives.
How crowded is the structure? If several bars are of similar length, the levels are clustered, and price may chop between them. If the bars fan out evenly, the structure is well spread.
Is anything extreme? A full bar means the level is the farthest visible one under the current scale, not that it is unreachable — read it as "the outermost reference on screen", not as a forecast.
Typical uses include identifying intraday reaction zones around the pivot, planning fade entries at the first support or resistance, using Camarilla levels for tight mean-reversion setups, and using Fibonacci levels for broader swing targets. The dashboard supports those workflows; it does not select them for you.
Disclaimer:
This indicator is provided for educational and informational purposes only. It is a visualisation tool for price levels derived from publicly available price data; it is not a trading system, a signal service, or investment advice.

إخلاء المسؤولية
لا يُقصد بالمعلومات والمنشورات أن تكون، أو تشكل، أي نصيحة مالية أو استثمارية أو تجارية أو أنواع أخرى من النصائح أو التوصيات المقدمة أو المعتمدة من TradingView. اقرأ المزيد في شروط الاستخدام.
إخلاء المسؤولية
لا يُقصد بالمعلومات والمنشورات أن تكون، أو تشكل، أي نصيحة مالية أو استثمارية أو تجارية أو أنواع أخرى من النصائح أو التوصيات المقدمة أو المعتمدة من TradingView. اقرأ المزيد في شروط الاستخدام.