Super Chachin Classic Fibonacci Pivots with Price-Action Sig
OVERVIEW
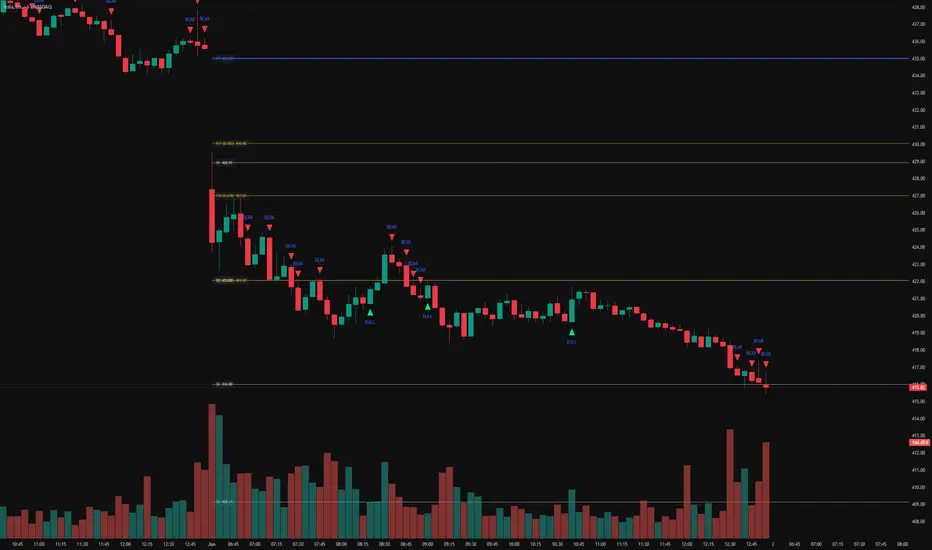
Chachin Pivots Pro is an intraday support/resistance tool that plots two complementary families of daily pivot levels — classic floor-trader pivots and Fibonacci pivots — and adds a volatility-filtered price-action layer that highlights reversal candles forming right at those levels. It is built for the 5-minute chart and works on forex, gold and index markets.
WHY THESE COMPONENTS ARE COMBINED (and how they work together)
Most pivot indicators draw a single set of levels and stop there, leaving you to judge by eye whether price is actually reacting. This script combines three elements on purpose, each one covering a weakness of the others:
Classic pivots (PP, R1–R4, S1–S4) come from the standard floor-trader formula and tend to mark the broad reaction zones most intraday traders watch.
Fibonacci pivots (0.382 / 0.618 / 1.000 of the prior day's range) are calculated with a different formula and often land at slightly different prices. They are included alongside the classic levels precisely because of where they disagree: when a classic level and a Fib level cluster together, that confluence marks a stronger zone than either level alone. The two sets are not redundant — their overlap is the information.
Price-action signals are the timing layer. The script flags a bullish engulfing candle near a support level and a bearish rejection candle near a resistance level. A pivot tells you where price might turn; the candle tells you whether it is actually turning there right now.
The piece that binds them into one system is the ATR proximity filter. "Near a level" is defined in volatility-adjusted terms (a multiple of ATR) rather than a fixed distance, so a signal only appears when a reversal candle forms within a meaningful distance of a pivot — and the same settings behave sensibly on a quiet EUR/USD session and a fast XAU/USD session without retuning. This is what makes the three parts act as one tool instead of three scripts stacked on a chart.
HOW THE LEVELS ARE CALCULATED
Central Pivot: PP = (prev High + prev Low + prev Close) / 3
Classic R1 / S1: 2·PP − prev Low and 2·PP − prev High
Classic R2 / S2: PP + range and PP − range (range = prev High − prev Low)
R3/R4 and S3/S4: further range projections for high-volatility days
Fibonacci pivots: PP ± 0.382·range, PP ± 0.618·range, PP ± 1.000·range (the 0.618 level is usually the most respected)
All levels are built from the previous, already-closed daily candle, so they are fixed for the whole session and do not repaint. Old lines are cleared at the start of each new day to keep the chart clean.
THE PRICE-ACTION SIGNALS
🟢 BULL — a bullish engulfing candle that closes within ATR-proximity of a support pivot (PP / S / FS).
🔴 BEAR — a bearish rejection candle within ATR-proximity of a resistance pivot (PP / R / FR).
Signals are confirmed on bar close and are meant as context, not as automatic buy/sell instructions.
HOW TO USE IT
Add it to a 5-minute chart of a liquid instrument (e.g. XAU/USD, EUR/USD, an index).
Use the Central Pivot (PP) for daily bias: trading above it leans bullish, below it leans bearish.
Watch how price behaves at the pivots, paying special attention to confluence zones where a classic level and a Fibonacci level stack on top of each other.
Treat a BULL/BEAR signal at one of those zones as a heads-up to look for your own entry, using the next pivot as a logical target and the level behind the signal as a logical invalidation point.
Optional alerts are available for PP crosses, key breakouts/breakdowns, and the candle signals.
SETTINGS
Show Classic Pivots / Show Fibonacci Pivots / Show Labels — toggle each layer on or off.
Proximity to level (× ATR) — how close price must be to a level for a signal to fire (higher = more permissive).
Colours for the central pivot, classic levels, Fibonacci levels and signals are fully editable.
INPUT-MENU TRANSLATION (the UI is in Spanish)
"Mostrar Pivots Clásicos" → Show Classic Pivots
"Mostrar Pivots Fibonacci" → Show Fibonacci Pivots
"Mostrar Etiquetas" → Show Labels
"Mostrar Señales" → Show Signals
"Proximidad a nivel (x ATR)" → Proximity to level (× ATR)
"Pivot Central" → Central Pivot · "Niveles Clásicos" → Classic Levels · "Niveles Fibonacci" → Fibonacci Levels
This is an educational tool for identifying support and resistance. It is not financial advice, and the past behaviour of any level does not guarantee future results.
Chachin Pivots Pro is an intraday support/resistance tool that plots two complementary families of daily pivot levels — classic floor-trader pivots and Fibonacci pivots — and adds a volatility-filtered price-action layer that highlights reversal candles forming right at those levels. It is built for the 5-minute chart and works on forex, gold and index markets.
WHY THESE COMPONENTS ARE COMBINED (and how they work together)
Most pivot indicators draw a single set of levels and stop there, leaving you to judge by eye whether price is actually reacting. This script combines three elements on purpose, each one covering a weakness of the others:
Classic pivots (PP, R1–R4, S1–S4) come from the standard floor-trader formula and tend to mark the broad reaction zones most intraday traders watch.
Fibonacci pivots (0.382 / 0.618 / 1.000 of the prior day's range) are calculated with a different formula and often land at slightly different prices. They are included alongside the classic levels precisely because of where they disagree: when a classic level and a Fib level cluster together, that confluence marks a stronger zone than either level alone. The two sets are not redundant — their overlap is the information.
Price-action signals are the timing layer. The script flags a bullish engulfing candle near a support level and a bearish rejection candle near a resistance level. A pivot tells you where price might turn; the candle tells you whether it is actually turning there right now.
The piece that binds them into one system is the ATR proximity filter. "Near a level" is defined in volatility-adjusted terms (a multiple of ATR) rather than a fixed distance, so a signal only appears when a reversal candle forms within a meaningful distance of a pivot — and the same settings behave sensibly on a quiet EUR/USD session and a fast XAU/USD session without retuning. This is what makes the three parts act as one tool instead of three scripts stacked on a chart.
HOW THE LEVELS ARE CALCULATED
Central Pivot: PP = (prev High + prev Low + prev Close) / 3
Classic R1 / S1: 2·PP − prev Low and 2·PP − prev High
Classic R2 / S2: PP + range and PP − range (range = prev High − prev Low)
R3/R4 and S3/S4: further range projections for high-volatility days
Fibonacci pivots: PP ± 0.382·range, PP ± 0.618·range, PP ± 1.000·range (the 0.618 level is usually the most respected)
All levels are built from the previous, already-closed daily candle, so they are fixed for the whole session and do not repaint. Old lines are cleared at the start of each new day to keep the chart clean.
THE PRICE-ACTION SIGNALS
🟢 BULL — a bullish engulfing candle that closes within ATR-proximity of a support pivot (PP / S / FS).
🔴 BEAR — a bearish rejection candle within ATR-proximity of a resistance pivot (PP / R / FR).
Signals are confirmed on bar close and are meant as context, not as automatic buy/sell instructions.
HOW TO USE IT
Add it to a 5-minute chart of a liquid instrument (e.g. XAU/USD, EUR/USD, an index).
Use the Central Pivot (PP) for daily bias: trading above it leans bullish, below it leans bearish.
Watch how price behaves at the pivots, paying special attention to confluence zones where a classic level and a Fibonacci level stack on top of each other.
Treat a BULL/BEAR signal at one of those zones as a heads-up to look for your own entry, using the next pivot as a logical target and the level behind the signal as a logical invalidation point.
Optional alerts are available for PP crosses, key breakouts/breakdowns, and the candle signals.
SETTINGS
Show Classic Pivots / Show Fibonacci Pivots / Show Labels — toggle each layer on or off.
Proximity to level (× ATR) — how close price must be to a level for a signal to fire (higher = more permissive).
Colours for the central pivot, classic levels, Fibonacci levels and signals are fully editable.
INPUT-MENU TRANSLATION (the UI is in Spanish)
"Mostrar Pivots Clásicos" → Show Classic Pivots
"Mostrar Pivots Fibonacci" → Show Fibonacci Pivots
"Mostrar Etiquetas" → Show Labels
"Mostrar Señales" → Show Signals
"Proximidad a nivel (x ATR)" → Proximity to level (× ATR)
"Pivot Central" → Central Pivot · "Niveles Clásicos" → Classic Levels · "Niveles Fibonacci" → Fibonacci Levels
This is an educational tool for identifying support and resistance. It is not financial advice, and the past behaviour of any level does not guarantee future results.

إخلاء المسؤولية
لا يُقصد بالمعلومات والمنشورات أن تكون، أو تشكل، أي نصيحة مالية أو استثمارية أو تجارية أو أنواع أخرى من النصائح أو التوصيات المقدمة أو المعتمدة من TradingView. اقرأ المزيد في شروط الاستخدام.
إخلاء المسؤولية
لا يُقصد بالمعلومات والمنشورات أن تكون، أو تشكل، أي نصيحة مالية أو استثمارية أو تجارية أو أنواع أخرى من النصائح أو التوصيات المقدمة أو المعتمدة من TradingView. اقرأ المزيد في شروط الاستخدام.