OPEN-SOURCE SCRIPT
تم تحديثه [blackcat] L3 Price Positioning Index
Level: 3
Background
Are you tired of traditional Japanese candlesticks? Do you want to try a new type of candle master chart?
Function
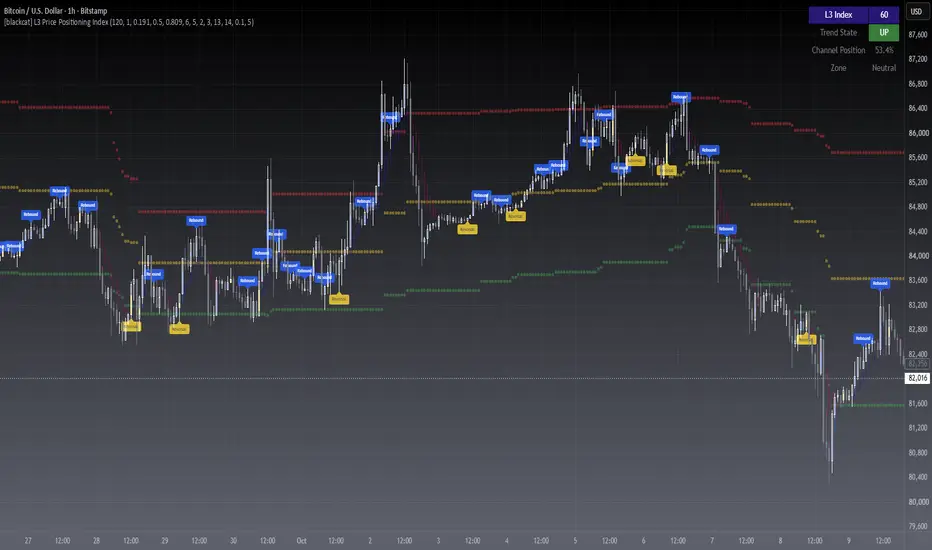
[blackcat] L3 Price Positioning Index is totally brand-new candle chart invented by myself. This main chart can provide effective resistance and support levels, and you can see where the price is running at any time. There are 3 key circle lines. Green circle line is used to indicate oversold support or breakthrough support levels; yellow circle line indicates the midline position where prices may pause; and red circle line indicates overbought resistance or breakthrough resistance levels.
There are two types of candlestick charts.
The first type candles are mid-to-long-term trend candles, navy represents an uptrend and the length of the candle represents a change in intensity; maroon represents a downward trend and the length of the candle represents a change in intensity. This trend candle is the effective support and resistance level of the second type short-term swing candle.
The second type candles are short-term candles fluctuate around the first medium- and long-term trend candles. The second short-term candle is divided into five colors: green means pump; fuchsia means retracement in the ascending process; yellow means bullish reversal signal; red means dump; blue means price rebound in the descending process.
Key Signal
THREE KEY LINES:
htop --> red circle line, overbought resistance or pump breakout threshold
hmid --> yellow circle line, price pause zone, sideways may happen here
hbot --> green circle line, oversold support or dump breakout threshold
MID-LONG TERM CANDLES:
x22,x33 --> navy for up and maroon for down trend, they are important support or resistance for short term price movements
SHORT TERM CANDLES:
1. bearreboun --> rebounce in down trend candle with blue color
2. pump --> up trend pump candle with green color
3. bullreversal --> bullish reversal candle with yellow color
4. dump --> bearish dump candle with red color
5. bullretra --> retracement in up trend candle with fuchsia
Pros and Cons
Pros:
1. Long term trend identification by three lines for overbought, oversold and breakouts
2. Mid term trend support and resistance with navy and maroon candles
3. Short term price behaviors are classified into 5 types of candles in blue, green, yellow, red and fuchsia
Cons:
I invent this to solve traditional JP candlestick shortcomings. If you find anything on Cons, just feedback to me for improvements.
Remarks
Brand-new Candle System invented by myself
Readme
In real life, I am a prolific inventor. I have successfully applied for more than 60 international and regional patents in the past 12 years. But in the past two years or so, I have tried to transfer my creativity to the development of trading strategies. Tradingview is the ideal platform for me. I am selecting and contributing some of the hundreds of scripts to publish in Tradingview community. Welcome everyone to interact with me to discuss these interesting pine scripts.
The scripts posted are categorized into 5 levels according to my efforts or manhours put into these works.
Level 1 : interesting script snippets or distinctive improvement from classic indicators or strategy. Level 1 scripts can usually appear in more complex indicators as a function module or element.
Level 2 : composite indicator/strategy. By selecting or combining several independent or dependent functions or sub indicators in proper way, the composite script exhibits a resonance phenomenon which can filter out noise or fake trading signal to enhance trading confidence level.
Level 3 : comprehensive indicator/strategy. They are simple trading systems based on my strategies. They are commonly containing several or all of entry signal, close signal, stop loss, take profit, re-entry, risk management, and position sizing techniques. Even some interesting fundamental and mass psychological aspects are incorporated.
Level 4 : script snippets or functions that do not disclose source code. Interesting element that can reveal market laws and work as raw material for indicators and strategies. If you find Level 1~2 scripts are helpful, Level 4 is a private version that took me far more efforts to develop.
Level 5 : indicator/strategy that do not disclose source code. private version of Level 3 script with my accumulated script processing skills or a large number of custom functions. I had a private function library built in past two years. Level 5 scripts use many of them to achieve private trading strategy.
ملاحظات الأخبار
OVERVIEWThe [blackcat] L3 Price Positioning Index script provides visual indicators on price momentum and potential reversals based on calculated thresholds and moving averages.
FEATURES
Identifies overbought, sideways, and oversold zones using custom-defined thresholds.
Highlights support and resistance levels with colored candles.
Paints candles based on trend direction and strength: blue for up trends, maroon for down trends.
Marks specific candle patterns such as rebounds, pumps, reversals, dumps, and retracements with distinct colors.
HOW TO USE
Add the script to your TradingView chart.
Customize input parameters:
n1: Length period for calculating overbought and oversold thresholds.
m1: Modifier for finding recent values within the length specified by n1.
LIMITATIONS
The effectiveness of this indicator depends heavily on chosen parameter settings.
It does not provide explicit buy/sell signals but rather highlights potential turning points.
NOTES
Ensure you adjust n1 and m1 according to market volatility and time frame for optimal results.
Candles are painted only when they meet specific criteria related to their position within the detected trend.
ملاحظات الأخبار
█ OVERVIEWThis indicator identifies potential KDJ-based trading opportunities by combining the classic Stochastic oscillator with a custom weighted moving average smoothing technique. It provides bidirectional long and short entry signals, exit mechanisms, and automated alert conditions for both entry and exit events.
█ CONCEPTS
The script applies a multi-layered KDJ analysis approach to identify trend reversal and momentum shift points in the market.
• Signal Generation: Uses a custom weighted moving average (WMA) to smooth the Raw Stochastic Value (RSV), producing K and D lines with enhanced responsiveness compared to standard SMA-based KDJ.
• Dual Signal System: Combines a momentum-based entry (J-value crossover with lookback confirmation) and a trend-confirmation entry (EMA-based CSS crossunder) to generate high-confidence long signals. Short signals mirror the long logic with inverted conditions.
• Risk Management: Integrates ATR-based take profit and stop loss reference levels that adapt to current market volatility.
• State Machine: Employs a position state tracker to prevent signal conflicts and enforce cooldown periods between trades.
█ HOW TO USE
1 — Add the indicator to your TradingView chart and select the desired timeframe. The default parameters (n1=9, n2=3, n3=3) are optimized for daily charts but can be adjusted for other timeframes.
2 — Configure input parameters in the settings panel: adjust the KDJ period (n1), smoothing factors (n2, n3), ATR length, and stop loss/take profit multipliers to match your trading style and the specific asset being analyzed.
3 — Interpret signals: green labels mark long entry points, red labels mark short entry points, and orange crosses indicate exit signals. The dashboard in the top-right corner displays the current position state, J value, ATR, and active TP/SL levels.
Input Parameters
• n1 (KDJ Period): The lookback period for calculating the highest high and lowest low. Default: 9.
• n2 (K Smoothing): The period for the weighted moving average applied to RSV to produce K. Default: 3.
• n3 (D Smoothing): The period for the weighted moving average applied to K to produce D. Default: 3.
• Enable Short Signals: Toggle short entry signals on or off. Default: enabled.
• Cooldown Bars: Minimum number of bars between consecutive signals. Default: 3.
• ATR Length: Period for the Average True Range calculation used in TP/SL. Default: 14.
• Stop Loss (xATR): ATR multiplier for stop loss distance. Default: 2.0.
• Take Profit (xATR): ATR multiplier for take profit distance. Default: 3.0.
• Show TP/SL Levels: Toggle display of stop loss and take profit reference lines. Default: enabled.
• Show Dashboard: Toggle the state summary table. Default: enabled.
█ SIGNALS
Visual Elements
• Long Entry (E / RL): Green label appearing below the price bar when KDJ momentum conditions are met. Indicates a potential long position opportunity.
• Short Entry (S): Red label appearing above the price bar when inverted KDJ conditions are met. Indicates a potential short position opportunity.
• Long Exit (XL): Orange cross marking the suggested exit point for an active long position.
• Short Exit (XS): Orange cross marking the suggested exit point for an actively short position.
• KD Candles: Yellow candles when K is above D (bullish); fuchsia candles when D is above K (bearish).
• Background Color: Light green background when in a long position; light red background when in a short position.
• Dashboard: A table in the top-right corner showing current position, J value, ATR, and TP/SL levels.
█ FEATURES
• Bidirectional signals with configurable short signal toggle.
• ATR-based take profit and stop loss reference levels that adapt to market volatility.
• Cooldown mechanism to prevent signal spam in ranging markets.
• Same-bar entry/exit exclusivity to avoid conflicting signals.
• Alert conditions for all signal types (long entry, short entry, long exit, short exit).
• State machine-based position tracking to prevent duplicate entries.
• Customizable dashboard displaying key metrics.
█ IMPLEMENTATION NOTES
The script uses the following built-in functions: ta.lowest, ta.highest, ta.crossover, ta.crossunder, ta.ema, ta.sma, ta.atr, and custom user-defined functions for weighted moving average calculation and last non-NaN value detection. The RSV calculation includes a small epsilon (1e-10) to prevent division by zero. The `find_last_non_nan` function safely handles historical reference lookups. Edge detection is implemented using `nz()` to protect against na values in historical references. All alert conditions are declared at the global scope with `alert.freq_once_per_bar_close` frequency to prevent repainting.
The indicator uses a state machine (posState: -1/0/+1) to track current position and enforce mutual exclusivity between entry and exit signals. The cooldown system prevents consecutive signals within a configurable number of bars.
█ LIMITATIONS
• Best suited for trending markets; may produce false signals in ranging or choppy conditions.
• The KDJ indicator is a momentum oscillator and works best when combined with other forms of analysis.
• Not recommended for use on very low timeframes (below 5 minutes) due to increased noise.
• ATR-based TP/SL levels are reference points only and may not match actual execution prices.
• The indicator does not execute trades automatically; it provides signals for manual or automated decision-making.
█ NOTES
• This is an open-source indicator. The source code is visible and can be studied or modified.
• Default parameters are optimized for daily timeframes. Adjust n1, n2, n3 for different timeframes.
• The short signal feature is enabled by default but can be toggled off for users who only trade long.
• The cooldown and exclusivity features can be disabled to revert to the original V1 behavior.
• For questions or feedback, use the comments section below.
═════════════════════════════════════════════════════════════════════════
For questions or feedback, use comments section below.
نص برمجي مفتوح المصدر
بروح TradingView الحقيقية، قام مبتكر هذا النص البرمجي بجعله مفتوح المصدر، بحيث يمكن للمتداولين مراجعة وظائفه والتحقق منها. شكرا للمؤلف! بينما يمكنك استخدامه مجانًا، تذكر أن إعادة نشر الكود يخضع لقواعد الموقع الخاصة بنا.

Don't miss out! The first and most important thing to do is to join my Discord chat now! Click here to start your adventure: discord.com/invite/ZTGpQJq My new github for more pine development soon: github.com/wxt-coder
إخلاء المسؤولية
لا يُقصد بالمعلومات والمنشورات أن تكون، أو تشكل، أي نصيحة مالية أو استثمارية أو تجارية أو أنواع أخرى من النصائح أو التوصيات المقدمة أو المعتمدة من TradingView. اقرأ المزيد في شروط الاستخدام.
نص برمجي مفتوح المصدر
بروح TradingView الحقيقية، قام مبتكر هذا النص البرمجي بجعله مفتوح المصدر، بحيث يمكن للمتداولين مراجعة وظائفه والتحقق منها. شكرا للمؤلف! بينما يمكنك استخدامه مجانًا، تذكر أن إعادة نشر الكود يخضع لقواعد الموقع الخاصة بنا.
Don't miss out! The first and most important thing to do is to join my Discord chat now! Click here to start your adventure: discord.com/invite/ZTGpQJq My new github for more pine development soon: github.com/wxt-coder
إخلاء المسؤولية
لا يُقصد بالمعلومات والمنشورات أن تكون، أو تشكل، أي نصيحة مالية أو استثمارية أو تجارية أو أنواع أخرى من النصائح أو التوصيات المقدمة أو المعتمدة من TradingView. اقرأ المزيد في شروط الاستخدام.