OPEN-SOURCE SCRIPT
VWAP Zone CVD Table [v6]
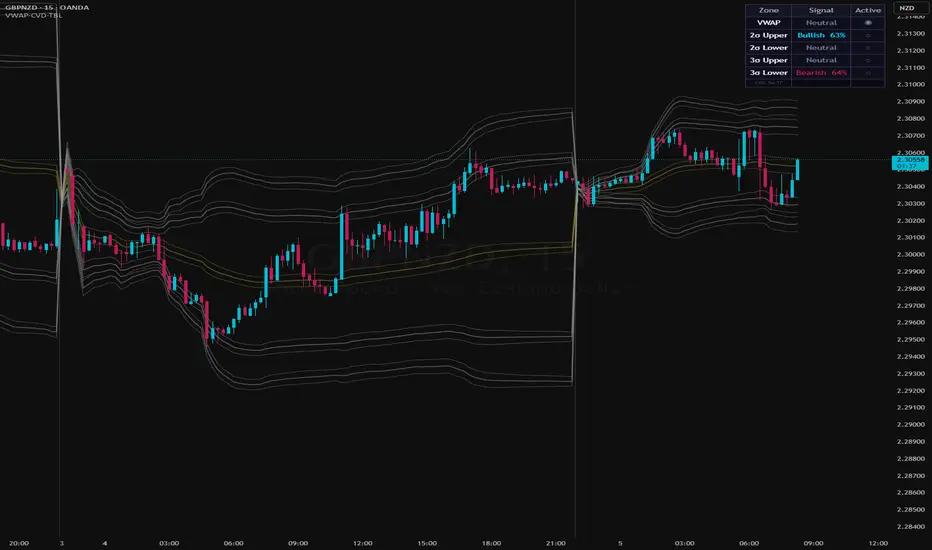
VWAP Zone CVD Table [v6]
Overview
The VWAP Zone CVD Table [v6] is a professional-grade institutional analysis tool designed to bridge the gap between price action and order flow. By combining Volume Weighted Average Price (VWAP) Standard Deviation bands with real-time Cumulative Volume Delta (CVD), this indicator identifies where institutional supply and demand are actively fighting for control.
Unlike standard VWAP indicators that only show price levels, this script analyses the net buying and selling pressure (CVD %) specifically within each volatility-adjusted zone, providing a high-conviction view of market sentiment at key technical levels.
🚀 Key Features
Multi-Zone VWAP Architecture: Features a central VWAP line and two customizable Standard Deviation (SD) bands (SD1 and SD2).
Volatility-Adjusted "Zones": Each band is wrapped in an ATR-based zone, creating a "catchment area" for price action rather than a single thin line, reflecting more realistic market behaviour.
Real-Time CVD Table: A sleek, non-intrusive dashboard that displays:
Zone Sentiment: Bullish, Bearish, or Neutral based on cumulative delta.
Volume Intensity: Percentage of net buying/selling power within that specific band.
Active Tracking: A live tracking column (◉) that highlights exactly which zone price is currently occupying.
Multi-Timeframe (MTF) Support: Flexible anchor settings (Session, Week, Month) and an "Auto" CVD timeframe selector that optimizes data granularity based on your chart.
Volume Filtering: Includes a minimum volume threshold to filter out "noise" and focus only on high-conviction institutional moves.
💡 How to Use
Identify Institutional Value: The central VWAP zone represents the "fair value." Use the SD1 and SD2 bands to identify overextended (Premium) or undervalued (Discount) zones.
Confirm Rejections: When price enters the SD2 Upper Zone, look at the CVD Table. If the signal is "Bearish %", it confirms that sellers are aggressively defending that level, increasing the probability of a mean-reversion trade.
Trend Continuation: In a strong trend, price often bounces off the VWAP or SD1 Lower Zone. A "Bullish %" signal in these zones during a pullback provides a high-probability entry for trend continuation.
Spot Absorption: If price is stuck in a zone but the CVD % is extremely high (e.g., 75% Bullish) yet price isn't moving up, it indicates Absorption—a sign that a major breakout or reversal is imminent.
🎨 Visual Elements
Dynamic Fills: Volatility-adjusted zones are shaded for easy visual identification of supply/demand areas.
Color-Coded Sentiment: The table and zones use professional colour palettes (Cyan for Bullish, Crimson for Bearish, Slate for Neutral).
Clean UI: Designed to work as an overlay without cluttering your price action analysis.
🛠 Settings & Customization
Anchor Period: Toggle between Session, Weekly, or Monthly VWAP.
Zone Widths: Fully adjustable ATR multipliers to fit different asset classes (Forex, Crypto, or Stocks).
Neutral Threshold: Customize what percentage of delta constitutes a "Bullish" vs "Neutral" signal (Default: 55%).
Table Position: Move the dashboard to any corner of your chart to suit your layout.
Disclaimer: Trading involves significant risk. This tool is designed for educational and analytical purposes and should be used in conjunction with a complete trading plan.
نص برمجي مفتوح المصدر
بروح TradingView الحقيقية، قام مبتكر هذا النص البرمجي بجعله مفتوح المصدر، بحيث يمكن للمتداولين مراجعة وظائفه والتحقق منها. شكرا للمؤلف! بينما يمكنك استخدامه مجانًا، تذكر أن إعادة نشر الكود يخضع لقواعد الموقع الخاصة بنا.

إخلاء المسؤولية
لا يُقصد بالمعلومات والمنشورات أن تكون، أو تشكل، أي نصيحة مالية أو استثمارية أو تجارية أو أنواع أخرى من النصائح أو التوصيات المقدمة أو المعتمدة من TradingView. اقرأ المزيد في شروط الاستخدام.
نص برمجي مفتوح المصدر
بروح TradingView الحقيقية، قام مبتكر هذا النص البرمجي بجعله مفتوح المصدر، بحيث يمكن للمتداولين مراجعة وظائفه والتحقق منها. شكرا للمؤلف! بينما يمكنك استخدامه مجانًا، تذكر أن إعادة نشر الكود يخضع لقواعد الموقع الخاصة بنا.
إخلاء المسؤولية
لا يُقصد بالمعلومات والمنشورات أن تكون، أو تشكل، أي نصيحة مالية أو استثمارية أو تجارية أو أنواع أخرى من النصائح أو التوصيات المقدمة أو المعتمدة من TradingView. اقرأ المزيد في شروط الاستخدام.