Gamma S/R Supply/Demand Levels
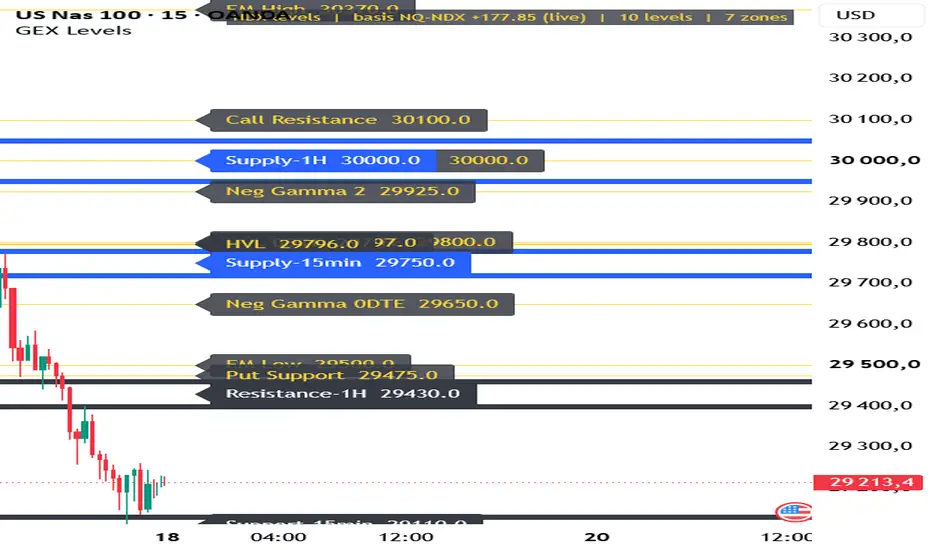
This indicator draws key price levels and zones on your chart from CSV text that you paste into its settings. You keep full control over the levels you trade from and don't have to redraw them by hand on every chart or timeframe.
Gamma / GEX levels
The indicator stores two independent level sets, one for SPX/ES and one for NDX/NQ. It detects the chart symbol automatically: SPX, ES, MES and US500 show the SPX set, while NDX, NQ, MNQ and US100 show the NDX set. You paste each CSV once and switch symbols freely. If the symbol isn't recognized, or if your CFD tracks the futures rather than the cash index, you can select the level set manually.
Each level uses the format Price Level,Note,Foreground Color,Background Color. The header line is ignored, and records can be separated by new lines, ; or |. Lines starting with # are treated as comments. Levels sitting at the same price can be merged onto a single line with combined notes, using an adjustable tolerance. You can also hide levels that are more than a chosen percentage away from the current price.
Automatic futures basis
You can paste levels in index units (SPX/NDX) or in futures units (ES/NQ). The indicator converts them automatically to match the chart. The basis (futures minus index) is measured live on the 1-minute timeframe during the cash session, and the last measurement is kept outside the session. A manual basis can be used instead, or as a fallback when the live measurement isn't available.
Support/Resistance and Supply/Demand zones
A dedicated text area accepts price zones in the format Price zone,Note,Foreground Color,Background Color, with each zone written as a range like 29400-29460. The zone type is detected from its note:
Support / Resistance zones are drawn as black lines.
Supply / Demand zones are drawn as blue lines. These are notes containing "supply", "demand", "demande" or "offre".
The default line width is 6. Each zone can be drawn either as two lines (its lower and upper bound) or as a single line at its midpoint. An optional label shows the zone's note and midpoint price on a background matching the zone color. The futures basis is applied to zones too, so they stay aligned when you move between index, CFD and futures charts.
Customization
Line width, style (solid, dashed, dotted), transparency and extension (both sides or right only).
Label visibility, price display, side, offset, size and background transparency.
Colors taken from the CSV, or replaced by your own line, text and background colors.
Separate colors and line width for S/R and Supply/Demand zones.
A status badge showing the active level set, the basis in use and its source, and how many levels and zones are displayed.
Notes
The levels and zones are entirely user-supplied. The indicator doesn't calculate gamma exposure or detect zones on its own. The distance filter applies to levels only, not to zones.
Gamma / GEX levels
The indicator stores two independent level sets, one for SPX/ES and one for NDX/NQ. It detects the chart symbol automatically: SPX, ES, MES and US500 show the SPX set, while NDX, NQ, MNQ and US100 show the NDX set. You paste each CSV once and switch symbols freely. If the symbol isn't recognized, or if your CFD tracks the futures rather than the cash index, you can select the level set manually.
Each level uses the format Price Level,Note,Foreground Color,Background Color. The header line is ignored, and records can be separated by new lines, ; or |. Lines starting with # are treated as comments. Levels sitting at the same price can be merged onto a single line with combined notes, using an adjustable tolerance. You can also hide levels that are more than a chosen percentage away from the current price.
Automatic futures basis
You can paste levels in index units (SPX/NDX) or in futures units (ES/NQ). The indicator converts them automatically to match the chart. The basis (futures minus index) is measured live on the 1-minute timeframe during the cash session, and the last measurement is kept outside the session. A manual basis can be used instead, or as a fallback when the live measurement isn't available.
Support/Resistance and Supply/Demand zones
A dedicated text area accepts price zones in the format Price zone,Note,Foreground Color,Background Color, with each zone written as a range like 29400-29460. The zone type is detected from its note:
Support / Resistance zones are drawn as black lines.
Supply / Demand zones are drawn as blue lines. These are notes containing "supply", "demand", "demande" or "offre".
The default line width is 6. Each zone can be drawn either as two lines (its lower and upper bound) or as a single line at its midpoint. An optional label shows the zone's note and midpoint price on a background matching the zone color. The futures basis is applied to zones too, so they stay aligned when you move between index, CFD and futures charts.
Customization
Line width, style (solid, dashed, dotted), transparency and extension (both sides or right only).
Label visibility, price display, side, offset, size and background transparency.
Colors taken from the CSV, or replaced by your own line, text and background colors.
Separate colors and line width for S/R and Supply/Demand zones.
A status badge showing the active level set, the basis in use and its source, and how many levels and zones are displayed.
Notes
The levels and zones are entirely user-supplied. The indicator doesn't calculate gamma exposure or detect zones on its own. The distance filter applies to levels only, not to zones.

إخلاء المسؤولية
لا يُقصد بالمعلومات والمنشورات أن تكون، أو تشكل، أي نصيحة مالية أو استثمارية أو تجارية أو أنواع أخرى من النصائح أو التوصيات المقدمة أو المعتمدة من TradingView. اقرأ المزيد في شروط الاستخدام.
إخلاء المسؤولية
لا يُقصد بالمعلومات والمنشورات أن تكون، أو تشكل، أي نصيحة مالية أو استثمارية أو تجارية أو أنواع أخرى من النصائح أو التوصيات المقدمة أو المعتمدة من TradingView. اقرأ المزيد في شروط الاستخدام.