OPEN-SOURCE SCRIPT
Previous HLC Single Choice
This indicator allows traders to visualize the High, Low, and Close (HLC) levels of a previous timeframe directly on their current chart. By plotting these key levels from a higher timeframe, traders can identify significant support and resistance zones, potential breakout levels, and the overall market context without needing to switch back and forth between different chart intervals.
How it Works
The script utilizes the request.security() function to fetch the High, Low, and Close data from the previous completed bar of a user-selected timeframe.
Unlike static multi-timeframe indicators that might clutter the chart with too many lines, this script is designed for simplicity and flexibility. It uses the input.timeframe functionality, allowing you to select any standard or custom timeframe available on TradingView (e.g., 4-hour, Daily, Weekly, 3-Month, 12-Month) via a simple dropdown menu.
Once a timeframe is selected, the indicator plots three distinct lines:
Green Line: The High of the previous timeframe.
Red Line: The Low of the previous timeframe.
Orange Line: The Close of the previous timeframe.
Usage Examples
These levels often act as dynamic support and resistance.
Breakouts: A move above the previous timeframe's High can signal bullish strength.
Breakdowns: A drop below the previous timeframe's Low can signal bearish weakness.
Ranges: The space between the High and Low often defines the trading range for the current session.
Screenshots
Ethereum (1D Chart / 6M Levels):
Here we see the 6-Month High, Low, and Close plotted on a Daily chart. Note how the previous 6-month levels frame the long-term trend.

Silver (2h Chart / 1W Levels):
This example shows Silver on a 2-hour chart with Weekly levels. This is useful for intraday traders looking for weekly pivots.

EURUSD (30m Chart / 480m Levels):
A granular look at the Euro on a 30-minute chart using an 8-hour (480m) timeframe overlay. This helps identify mid-session reversals.

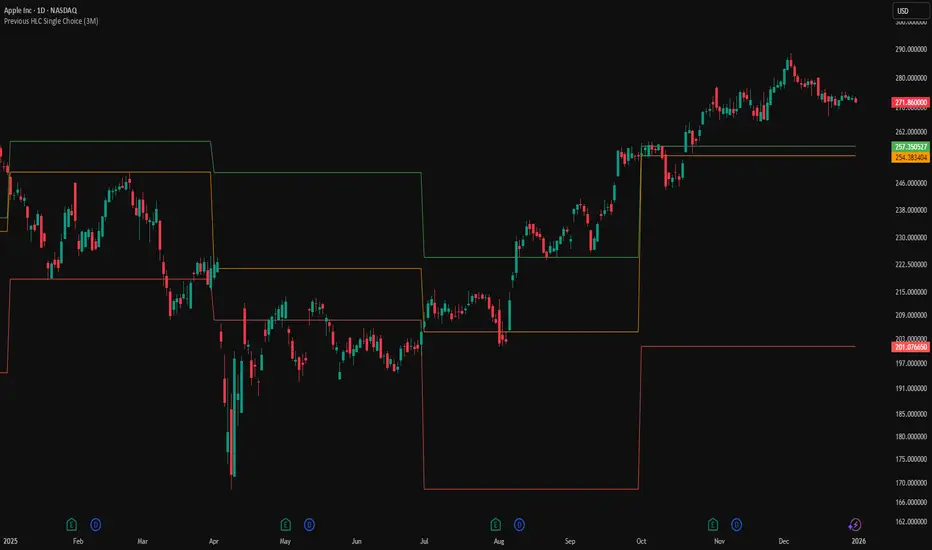
Apple (1D Chart / 3M Levels):
Apple stock on a Daily chart with Quarterly (3-Month) levels, highlighting major structural levels for swing trading.

Settings
Choose Timeframe: Select the specific timeframe you wish to overlay (Default is 3 Months).
Disclaimer
This script is for educational and informational purposes only. It DOES NOT constitute financial advice. Past performance is not indicative of future results. Always do your own research and risk management before trading.
How it Works
The script utilizes the request.security() function to fetch the High, Low, and Close data from the previous completed bar of a user-selected timeframe.
Unlike static multi-timeframe indicators that might clutter the chart with too many lines, this script is designed for simplicity and flexibility. It uses the input.timeframe functionality, allowing you to select any standard or custom timeframe available on TradingView (e.g., 4-hour, Daily, Weekly, 3-Month, 12-Month) via a simple dropdown menu.
Once a timeframe is selected, the indicator plots three distinct lines:
Green Line: The High of the previous timeframe.
Red Line: The Low of the previous timeframe.
Orange Line: The Close of the previous timeframe.
Usage Examples
These levels often act as dynamic support and resistance.
Breakouts: A move above the previous timeframe's High can signal bullish strength.
Breakdowns: A drop below the previous timeframe's Low can signal bearish weakness.
Ranges: The space between the High and Low often defines the trading range for the current session.
Screenshots
Ethereum (1D Chart / 6M Levels):
Here we see the 6-Month High, Low, and Close plotted on a Daily chart. Note how the previous 6-month levels frame the long-term trend.
Silver (2h Chart / 1W Levels):
This example shows Silver on a 2-hour chart with Weekly levels. This is useful for intraday traders looking for weekly pivots.
EURUSD (30m Chart / 480m Levels):
A granular look at the Euro on a 30-minute chart using an 8-hour (480m) timeframe overlay. This helps identify mid-session reversals.
Apple (1D Chart / 3M Levels):
Apple stock on a Daily chart with Quarterly (3-Month) levels, highlighting major structural levels for swing trading.
Settings
Choose Timeframe: Select the specific timeframe you wish to overlay (Default is 3 Months).
Disclaimer
This script is for educational and informational purposes only. It DOES NOT constitute financial advice. Past performance is not indicative of future results. Always do your own research and risk management before trading.
نص برمجي مفتوح المصدر
بروح TradingView الحقيقية، قام مبتكر هذا النص البرمجي بجعله مفتوح المصدر، بحيث يمكن للمتداولين مراجعة وظائفه والتحقق منها. شكرا للمؤلف! بينما يمكنك استخدامه مجانًا، تذكر أن إعادة نشر الكود يخضع لقواعد الموقع الخاصة بنا.

إخلاء المسؤولية
لا يُقصد بالمعلومات والمنشورات أن تكون، أو تشكل، أي نصيحة مالية أو استثمارية أو تجارية أو أنواع أخرى من النصائح أو التوصيات المقدمة أو المعتمدة من TradingView. اقرأ المزيد في شروط الاستخدام.
نص برمجي مفتوح المصدر
بروح TradingView الحقيقية، قام مبتكر هذا النص البرمجي بجعله مفتوح المصدر، بحيث يمكن للمتداولين مراجعة وظائفه والتحقق منها. شكرا للمؤلف! بينما يمكنك استخدامه مجانًا، تذكر أن إعادة نشر الكود يخضع لقواعد الموقع الخاصة بنا.
إخلاء المسؤولية
لا يُقصد بالمعلومات والمنشورات أن تكون، أو تشكل، أي نصيحة مالية أو استثمارية أو تجارية أو أنواع أخرى من النصائح أو التوصيات المقدمة أو المعتمدة من TradingView. اقرأ المزيد في شروط الاستخدام.