تم تحديثه
[blackcat] L1 ASR Floating Chip Ratio MACD
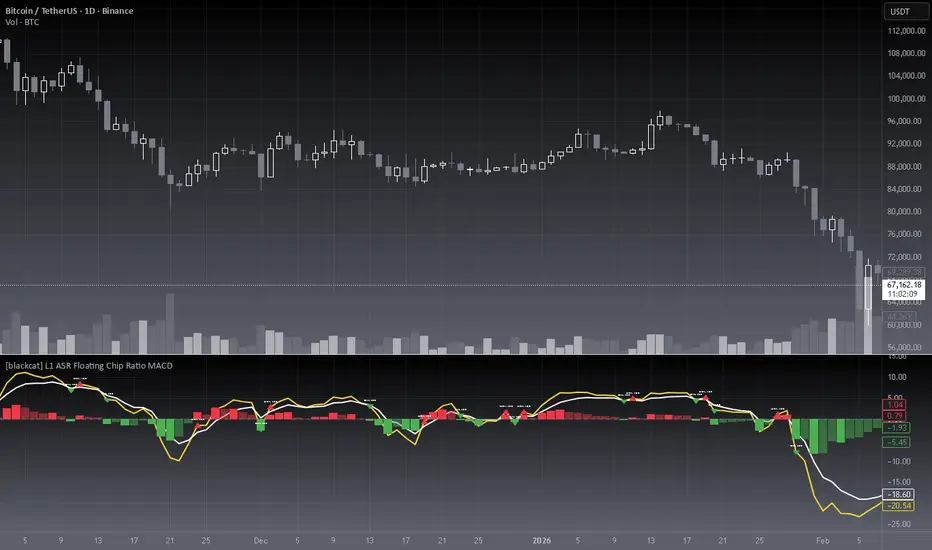
█ OVERVIEW
The ASR Floating Chip Ratio MACD is a volume-based momentum indicator that combines chip distribution analysis with MACD-style signal generation. It measures the proportion of floating chips (tradable shares) within a specific price range to identify potential trend reversals and momentum shifts.
█ CONCEPTS
This indicator utilizes volume profile analysis to calculate chip distribution across price levels, then applies the ASR (Asymmetric Supply Ratio) methodology to quantify floating chip concentration.
Key Principles
• Chip Distribution — Analyzes volume distribution across price levels to understand where trading activity concentrates
• Floating Chip Ratio — Measures the proportion of chips that are "floating" (actively traded) relative to the total supply
• MACD-style Momentum — Applies fast/slow line crossover logic to detect momentum changes in the chip ratio
• Volume-Weighted Analysis — Uses historical volume data to weight the significance of different price levels
█ HOW TO USE
Setup Instructions
1 — Add the indicator to your chart from the indicators menu
2 — Adjust the lookback period based on your trading timeframe (default: 500 bars)
3 — Configure price levels for volume profile granularity (default: 100 levels)
4 — Observe the fast/slow line crossovers and histogram color changes
Parameter Guidance
• Chip Lookback Period (100-5000, default: 500) — Defines the historical range for chip distribution calculation. Higher values provide more stable signals but with more lag.
• Price Levels (10-200, default: 100) — Sets the granularity of the volume profile. More levels provide finer resolution but require more computation.
Signal Interpretation
• Fast line (yellow) crossing above slow line (white) suggests bullish momentum
• Fast line crossing below slow line suggests bearish momentum
• Histogram bars indicate the strength and direction of momentum
█ SIGNALS
Visual Elements
• Fast Line (Yellow) — Short-term EMA-based momentum of ASR ratio
• Slow Line (White) — Longer-term EMA-based momentum of ASR ratio
• Red Histogram Bars — Positive momentum strengthening (bullish)
• Light Red Bars — Positive momentum weakening (bullish exhaustion)
• Green Histogram Bars — Negative momentum strengthening (bearish)
• Light Green Bars — Negative momentum weakening (bearish exhaustion)
• Golden Cross (Red Triangle Up) — Fast line crosses above slow line (potential buy signal)
• Death Cross (Green Triangle Down) — Fast line crosses below slow line (potential sell signal)
• Zero Axis (Dashed Gray) — Reference line for momentum direction
█ FEATURES
• Volume profile-based chip distribution analysis
• MACD-style crossover signals with visual markers
• Four-color histogram for momentum strength visualization
• Configurable lookback period for different trading styles
• EMA-smoothed baseline for noise reduction
█ LIMITATIONS
• Requires sufficient historical data (minimum 100+ bars recommended)
• Performance may vary on low-volume or illiquid assets
• Not suitable as a standalone trading signal — use with confirmation
• The indicator repaints on new bars as volume profile updates
• Higher lookback periods increase computational load
█ NOTES
• Best used in conjunction with price action analysis and other indicators
• Consider market context and fundamental factors before making trading decisions
• The chip distribution model assumes volume reflects genuine trading interest
• Works well on daily and intraday timeframes with adequate liquidity
═════════════════════════════════════════════════════════════════════════
For questions or feedback, use comments section below.
The ASR Floating Chip Ratio MACD is a volume-based momentum indicator that combines chip distribution analysis with MACD-style signal generation. It measures the proportion of floating chips (tradable shares) within a specific price range to identify potential trend reversals and momentum shifts.
█ CONCEPTS
This indicator utilizes volume profile analysis to calculate chip distribution across price levels, then applies the ASR (Asymmetric Supply Ratio) methodology to quantify floating chip concentration.
Key Principles
• Chip Distribution — Analyzes volume distribution across price levels to understand where trading activity concentrates
• Floating Chip Ratio — Measures the proportion of chips that are "floating" (actively traded) relative to the total supply
• MACD-style Momentum — Applies fast/slow line crossover logic to detect momentum changes in the chip ratio
• Volume-Weighted Analysis — Uses historical volume data to weight the significance of different price levels
█ HOW TO USE
Setup Instructions
1 — Add the indicator to your chart from the indicators menu
2 — Adjust the lookback period based on your trading timeframe (default: 500 bars)
3 — Configure price levels for volume profile granularity (default: 100 levels)
4 — Observe the fast/slow line crossovers and histogram color changes
Parameter Guidance
• Chip Lookback Period (100-5000, default: 500) — Defines the historical range for chip distribution calculation. Higher values provide more stable signals but with more lag.
• Price Levels (10-200, default: 100) — Sets the granularity of the volume profile. More levels provide finer resolution but require more computation.
Signal Interpretation
• Fast line (yellow) crossing above slow line (white) suggests bullish momentum
• Fast line crossing below slow line suggests bearish momentum
• Histogram bars indicate the strength and direction of momentum
█ SIGNALS
Visual Elements
• Fast Line (Yellow) — Short-term EMA-based momentum of ASR ratio
• Slow Line (White) — Longer-term EMA-based momentum of ASR ratio
• Red Histogram Bars — Positive momentum strengthening (bullish)
• Light Red Bars — Positive momentum weakening (bullish exhaustion)
• Green Histogram Bars — Negative momentum strengthening (bearish)
• Light Green Bars — Negative momentum weakening (bearish exhaustion)
• Golden Cross (Red Triangle Up) — Fast line crosses above slow line (potential buy signal)
• Death Cross (Green Triangle Down) — Fast line crosses below slow line (potential sell signal)
• Zero Axis (Dashed Gray) — Reference line for momentum direction
█ FEATURES
• Volume profile-based chip distribution analysis
• MACD-style crossover signals with visual markers
• Four-color histogram for momentum strength visualization
• Configurable lookback period for different trading styles
• EMA-smoothed baseline for noise reduction
█ LIMITATIONS
• Requires sufficient historical data (minimum 100+ bars recommended)
• Performance may vary on low-volume or illiquid assets
• Not suitable as a standalone trading signal — use with confirmation
• The indicator repaints on new bars as volume profile updates
• Higher lookback periods increase computational load
█ NOTES
• Best used in conjunction with price action analysis and other indicators
• Consider market context and fundamental factors before making trading decisions
• The chip distribution model assumes volume reflects genuine trading interest
• Works well on daily and intraday timeframes with adequate liquidity
═════════════════════════════════════════════════════════════════════════
For questions or feedback, use comments section below.
ملاحظات الأخبار
adjust TF to display it well
Don't miss out! The first and most important thing to do is to join my Discord chat now! Click here to start your adventure: discord.com/invite/ZTGpQJq My new github for more pine development soon: github.com/wxt-coder
إخلاء المسؤولية
لا يُقصد بالمعلومات والمنشورات أن تكون، أو تشكل، أي نصيحة مالية أو استثمارية أو تجارية أو أنواع أخرى من النصائح أو التوصيات المقدمة أو المعتمدة من TradingView. اقرأ المزيد في شروط الاستخدام.
Don't miss out! The first and most important thing to do is to join my Discord chat now! Click here to start your adventure: discord.com/invite/ZTGpQJq My new github for more pine development soon: github.com/wxt-coder
إخلاء المسؤولية
لا يُقصد بالمعلومات والمنشورات أن تكون، أو تشكل، أي نصيحة مالية أو استثمارية أو تجارية أو أنواع أخرى من النصائح أو التوصيات المقدمة أو المعتمدة من TradingView. اقرأ المزيد في شروط الاستخدام.