OPEN-SOURCE SCRIPT
Stock Position Sizer with Daily ATR
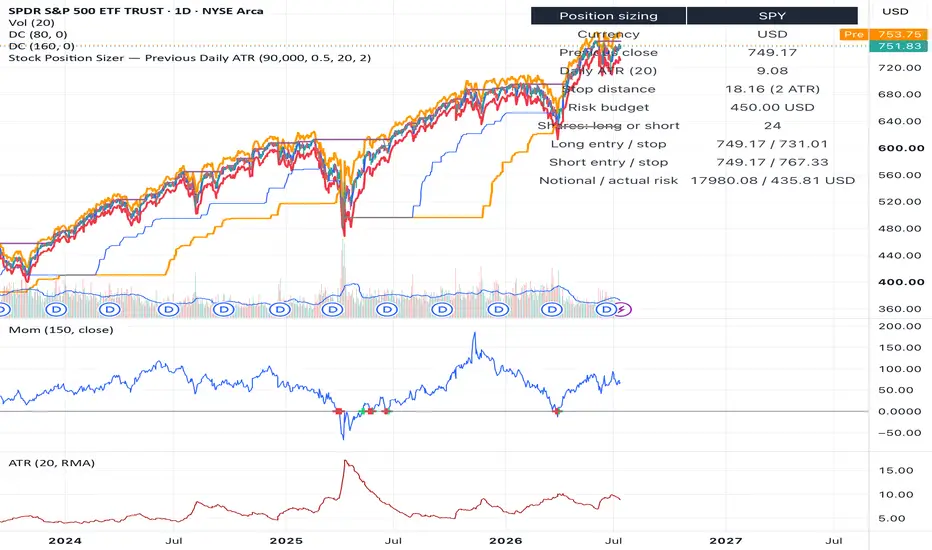
The script is a stock position-sizing indicator based on ATR multiples. It calculates how many whole shares you can trade while risking a chosen percentage of your nominal equity.
With the defaults:
- Nominal equity: 90,000
- Risk: 0.5%
- Risk budget: 450
- ATR length: 20 days
- Stop distance: 2 × ATR
### Calculation
It retrieves the close and ATR from the last completed daily bar, regardless of the chart timeframe.
Risk budget = Nominal equity × Risk percentage
Stop distance = Daily ATR × ATR multiple
Shares = floor(Risk budget ÷ Stop distance)
For example, if ATR is 8.86:
Risk budget = 90,000 × 0.5% = 450
Stop distance = 8.86 × 2 = 17.72
Position size = floor(450 ÷ 17.72) = 25 shares
Long and short levels
Both directions use the same share quantity because their stop distances are symmetrical:
Long entry = Previous daily close
Long stop = Previous daily close − 2 ATR
Short entry = Previous daily close
Short stop = Previous daily close + 2 ATR
What it displays
The chart shows three horizontal levels:
- Blue: previous daily close and assumed entry
- Red: long stop
- Orange: short stop
The table shows:
- Stock currency
- Previous daily close
- Daily ATR
- Stop distance
- Risk budget
- Number of whole shares
- Long entry and stop
- Short entry and stop
- Position notional and actual risk after rounding
There is no currency conversion. A value of `90,000` means $90,000 on a USD stock, €90,000 on a EUR stock, and so forth.
With the defaults:
- Nominal equity: 90,000
- Risk: 0.5%
- Risk budget: 450
- ATR length: 20 days
- Stop distance: 2 × ATR
### Calculation
It retrieves the close and ATR from the last completed daily bar, regardless of the chart timeframe.
Risk budget = Nominal equity × Risk percentage
Stop distance = Daily ATR × ATR multiple
Shares = floor(Risk budget ÷ Stop distance)
For example, if ATR is 8.86:
Risk budget = 90,000 × 0.5% = 450
Stop distance = 8.86 × 2 = 17.72
Position size = floor(450 ÷ 17.72) = 25 shares
Long and short levels
Both directions use the same share quantity because their stop distances are symmetrical:
Long entry = Previous daily close
Long stop = Previous daily close − 2 ATR
Short entry = Previous daily close
Short stop = Previous daily close + 2 ATR
What it displays
The chart shows three horizontal levels:
- Blue: previous daily close and assumed entry
- Red: long stop
- Orange: short stop
The table shows:
- Stock currency
- Previous daily close
- Daily ATR
- Stop distance
- Risk budget
- Number of whole shares
- Long entry and stop
- Short entry and stop
- Position notional and actual risk after rounding
There is no currency conversion. A value of `90,000` means $90,000 on a USD stock, €90,000 on a EUR stock, and so forth.
نص برمجي مفتوح المصدر
بروح TradingView الحقيقية، قام مبتكر هذا النص البرمجي بجعله مفتوح المصدر، بحيث يمكن للمتداولين مراجعة وظائفه والتحقق منها. شكرا للمؤلف! بينما يمكنك استخدامه مجانًا، تذكر أن إعادة نشر الكود يخضع لقواعد الموقع الخاصة بنا.

إخلاء المسؤولية
لا يُقصد بالمعلومات والمنشورات أن تكون، أو تشكل، أي نصيحة مالية أو استثمارية أو تجارية أو أنواع أخرى من النصائح أو التوصيات المقدمة أو المعتمدة من TradingView. اقرأ المزيد في شروط الاستخدام.
نص برمجي مفتوح المصدر
بروح TradingView الحقيقية، قام مبتكر هذا النص البرمجي بجعله مفتوح المصدر، بحيث يمكن للمتداولين مراجعة وظائفه والتحقق منها. شكرا للمؤلف! بينما يمكنك استخدامه مجانًا، تذكر أن إعادة نشر الكود يخضع لقواعد الموقع الخاصة بنا.
إخلاء المسؤولية
لا يُقصد بالمعلومات والمنشورات أن تكون، أو تشكل، أي نصيحة مالية أو استثمارية أو تجارية أو أنواع أخرى من النصائح أو التوصيات المقدمة أو المعتمدة من TradingView. اقرأ المزيد في شروط الاستخدام.