OPEN-SOURCE SCRIPT
GFG Volatility Heikin Ashi Candles by Agaam
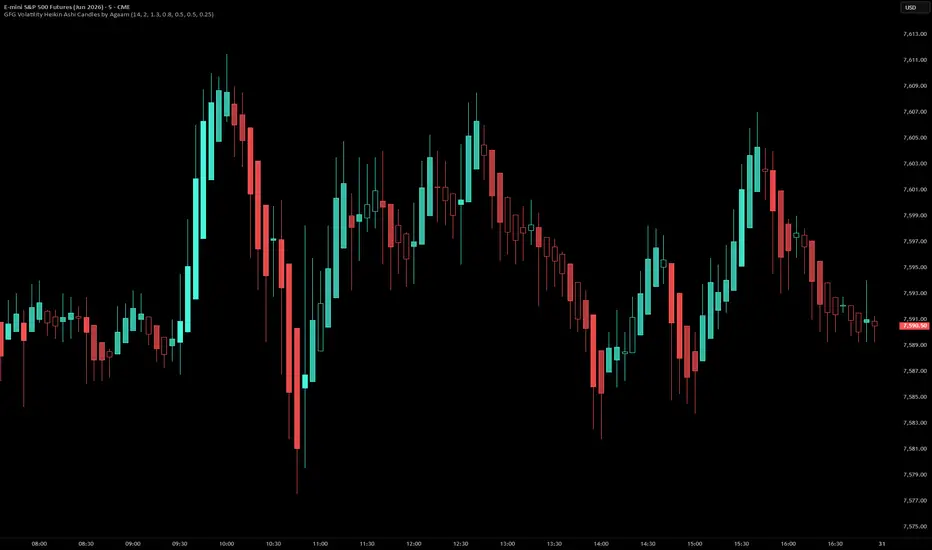
## GFG Volatility Heikin Ashi Candles by Agaam
**GFG Volatility Heikin Ashi Candles** is a custom candle-overlay indicator that combines Heikin Ashi candle structure with ATR-based volatility analysis.
The goal of this script is to make volatility easier to see directly on the chart. Instead of using standard candles only, this indicator builds custom Heikin Ashi candles and then adjusts their visibility based on how strong or weak the current candle’s volatility is compared to its ATR average.
This helps traders quickly identify when the market is expanding, slowing down, or entering compression.
## What Makes This Script Original
Many Heikin Ashi indicators only smooth price movement and recolor candles based on bullish or bearish direction. This script adds a volatility layer by measuring the current Heikin Ashi candle range against a custom ATR calculation based on Heikin Ashi values.
The script does not only ask, “Is the candle bullish or bearish?”
It also asks, “Is this candle showing enough volatility to matter?”
The result is a cleaner candle overlay where stronger volatility candles are more visible, while low-volatility or compression candles can fade out.
## How The Indicator Works
The script first calculates custom Heikin Ashi values:
* Heikin Ashi open
* Heikin Ashi high
* Heikin Ashi low
* Heikin Ashi close
Then it calculates a Heikin Ashi-based true range using:
* Current Heikin Ashi high minus Heikin Ashi low
* Distance from Heikin Ashi high to previous Heikin Ashi close
* Distance from Heikin Ashi low to previous Heikin Ashi close
This true range is smoothed using an ATR-style RMA average.
The script then compares the current Heikin Ashi true range to the ATR value.
This creates a volatility ratio:
Current HA true range ÷ HA ATR
A value above 1 means the current Heikin Ashi candle is larger than average.
A value below 1 means the current Heikin Ashi candle is smaller than average.
## Volatility Categories
The script classifies each candle into volatility conditions:
### Extreme Volatility
A candle is marked as extreme when its volatility ratio is above the extreme threshold.
These candles are shown with the strongest visibility because they represent larger-than-normal price movement.
### High Volatility
A candle is marked as high volatility when its volatility ratio is above the high threshold but below the extreme threshold.
These candles are still clearly visible, but slightly less intense than extreme candles.
### Normal Volatility
Normal candles are shown with moderate visibility.
### Low Volatility
Low-volatility candles are detected when the volatility ratio drops below the low-volatility threshold.
### Compression
Compression is detected when the volatility ratio drops below the compression threshold.
Low-volatility and compression candles are faded out. This helps traders visually separate active movement from quieter, low-energy market conditions.
## Body Strength Filter
The script includes an optional candle body filter.
When enabled, the candle must have enough Heikin Ashi body strength compared to ATR before it can qualify as high or extreme volatility.
This helps filter out candles that have large wicks but weak candle bodies.
The body filter can be useful for traders who want to focus more on directional volatility instead of total range only.
## Candle Colors
The candles are colored by Heikin Ashi direction:
* Bullish Heikin Ashi candles use the selected bull color
* Bearish Heikin Ashi candles use the selected bear color
The candle body transparency changes based on volatility strength:
* Extreme volatility = most visible
* High volatility = clearly visible
* Normal volatility = softer visibility
* Low volatility / compression = hidden or nearly invisible body
This creates a cleaner visual map of where volatility is expanding or fading.
## Optional Volatility Label
The indicator includes an optional label that displays the current volatility condition on the latest candle.
The label can show:
* Compression
* Low Vol
* Normal
* High Vol
* Extreme Vol
It also shows the volatility ratio compared to ATR, such as:
1.45x ATR
This allows traders to quickly understand the current candle’s volatility state without reading the candles manually.
## How Traders Can Use It
This indicator can be used as a visual volatility filter.
Possible uses include:
* Identifying strong volatility expansion candles
* Avoiding low-volatility compression areas
* Watching for market activity after quiet periods
* Confirming that a move has enough range behind it
* Filtering out weak Heikin Ashi candles
* Reading bullish or bearish Heikin Ashi direction together with volatility strength
A possible workflow:
1. Use the Heikin Ashi candle direction to read smoother bullish or bearish movement.
2. Watch candle visibility to understand volatility strength.
3. Treat high and extreme volatility candles as active movement zones.
4. Treat faded candles as low-volatility or compression areas.
5. Combine the visual reading with support/resistance, trend, volume, and risk management.
## Important Notes
This script is not a buy or sell signal system. It does not predict market direction and does not guarantee continuation.
High volatility can appear during breakouts, reversals, news events, stop runs, or exhaustion moves. Traders should use market context before making decisions.
Compression does not always mean price will break out immediately. It only means the current Heikin Ashi range is low compared to its ATR average.
## Disclaimer
This indicator is for educational and informational purposes only. It is not financial advice, investment advice, or a guaranteed trading system. Trading involves risk, and every trader is responsible for their own decisions. Always use proper risk management.
**GFG Volatility Heikin Ashi Candles** is a custom candle-overlay indicator that combines Heikin Ashi candle structure with ATR-based volatility analysis.
The goal of this script is to make volatility easier to see directly on the chart. Instead of using standard candles only, this indicator builds custom Heikin Ashi candles and then adjusts their visibility based on how strong or weak the current candle’s volatility is compared to its ATR average.
This helps traders quickly identify when the market is expanding, slowing down, or entering compression.
## What Makes This Script Original
Many Heikin Ashi indicators only smooth price movement and recolor candles based on bullish or bearish direction. This script adds a volatility layer by measuring the current Heikin Ashi candle range against a custom ATR calculation based on Heikin Ashi values.
The script does not only ask, “Is the candle bullish or bearish?”
It also asks, “Is this candle showing enough volatility to matter?”
The result is a cleaner candle overlay where stronger volatility candles are more visible, while low-volatility or compression candles can fade out.
## How The Indicator Works
The script first calculates custom Heikin Ashi values:
* Heikin Ashi open
* Heikin Ashi high
* Heikin Ashi low
* Heikin Ashi close
Then it calculates a Heikin Ashi-based true range using:
* Current Heikin Ashi high minus Heikin Ashi low
* Distance from Heikin Ashi high to previous Heikin Ashi close
* Distance from Heikin Ashi low to previous Heikin Ashi close
This true range is smoothed using an ATR-style RMA average.
The script then compares the current Heikin Ashi true range to the ATR value.
This creates a volatility ratio:
Current HA true range ÷ HA ATR
A value above 1 means the current Heikin Ashi candle is larger than average.
A value below 1 means the current Heikin Ashi candle is smaller than average.
## Volatility Categories
The script classifies each candle into volatility conditions:
### Extreme Volatility
A candle is marked as extreme when its volatility ratio is above the extreme threshold.
These candles are shown with the strongest visibility because they represent larger-than-normal price movement.
### High Volatility
A candle is marked as high volatility when its volatility ratio is above the high threshold but below the extreme threshold.
These candles are still clearly visible, but slightly less intense than extreme candles.
### Normal Volatility
Normal candles are shown with moderate visibility.
### Low Volatility
Low-volatility candles are detected when the volatility ratio drops below the low-volatility threshold.
### Compression
Compression is detected when the volatility ratio drops below the compression threshold.
Low-volatility and compression candles are faded out. This helps traders visually separate active movement from quieter, low-energy market conditions.
## Body Strength Filter
The script includes an optional candle body filter.
When enabled, the candle must have enough Heikin Ashi body strength compared to ATR before it can qualify as high or extreme volatility.
This helps filter out candles that have large wicks but weak candle bodies.
The body filter can be useful for traders who want to focus more on directional volatility instead of total range only.
## Candle Colors
The candles are colored by Heikin Ashi direction:
* Bullish Heikin Ashi candles use the selected bull color
* Bearish Heikin Ashi candles use the selected bear color
The candle body transparency changes based on volatility strength:
* Extreme volatility = most visible
* High volatility = clearly visible
* Normal volatility = softer visibility
* Low volatility / compression = hidden or nearly invisible body
This creates a cleaner visual map of where volatility is expanding or fading.
## Optional Volatility Label
The indicator includes an optional label that displays the current volatility condition on the latest candle.
The label can show:
* Compression
* Low Vol
* Normal
* High Vol
* Extreme Vol
It also shows the volatility ratio compared to ATR, such as:
1.45x ATR
This allows traders to quickly understand the current candle’s volatility state without reading the candles manually.
## How Traders Can Use It
This indicator can be used as a visual volatility filter.
Possible uses include:
* Identifying strong volatility expansion candles
* Avoiding low-volatility compression areas
* Watching for market activity after quiet periods
* Confirming that a move has enough range behind it
* Filtering out weak Heikin Ashi candles
* Reading bullish or bearish Heikin Ashi direction together with volatility strength
A possible workflow:
1. Use the Heikin Ashi candle direction to read smoother bullish or bearish movement.
2. Watch candle visibility to understand volatility strength.
3. Treat high and extreme volatility candles as active movement zones.
4. Treat faded candles as low-volatility or compression areas.
5. Combine the visual reading with support/resistance, trend, volume, and risk management.
## Important Notes
This script is not a buy or sell signal system. It does not predict market direction and does not guarantee continuation.
High volatility can appear during breakouts, reversals, news events, stop runs, or exhaustion moves. Traders should use market context before making decisions.
Compression does not always mean price will break out immediately. It only means the current Heikin Ashi range is low compared to its ATR average.
## Disclaimer
This indicator is for educational and informational purposes only. It is not financial advice, investment advice, or a guaranteed trading system. Trading involves risk, and every trader is responsible for their own decisions. Always use proper risk management.
نص برمجي مفتوح المصدر
بروح TradingView الحقيقية، قام مبتكر هذا النص البرمجي بجعله مفتوح المصدر، بحيث يمكن للمتداولين مراجعة وظائفه والتحقق منها. شكرا للمؤلف! بينما يمكنك استخدامه مجانًا، تذكر أن إعادة نشر الكود يخضع لقواعد الموقع الخاصة بنا.

إخلاء المسؤولية
لا يُقصد بالمعلومات والمنشورات أن تكون، أو تشكل، أي نصيحة مالية أو استثمارية أو تجارية أو أنواع أخرى من النصائح أو التوصيات المقدمة أو المعتمدة من TradingView. اقرأ المزيد في شروط الاستخدام.
نص برمجي مفتوح المصدر
بروح TradingView الحقيقية، قام مبتكر هذا النص البرمجي بجعله مفتوح المصدر، بحيث يمكن للمتداولين مراجعة وظائفه والتحقق منها. شكرا للمؤلف! بينما يمكنك استخدامه مجانًا، تذكر أن إعادة نشر الكود يخضع لقواعد الموقع الخاصة بنا.
إخلاء المسؤولية
لا يُقصد بالمعلومات والمنشورات أن تكون، أو تشكل، أي نصيحة مالية أو استثمارية أو تجارية أو أنواع أخرى من النصائح أو التوصيات المقدمة أو المعتمدة من TradingView. اقرأ المزيد في شروط الاستخدام.