OPEN-SOURCE SCRIPT
CVD [Order Flow]
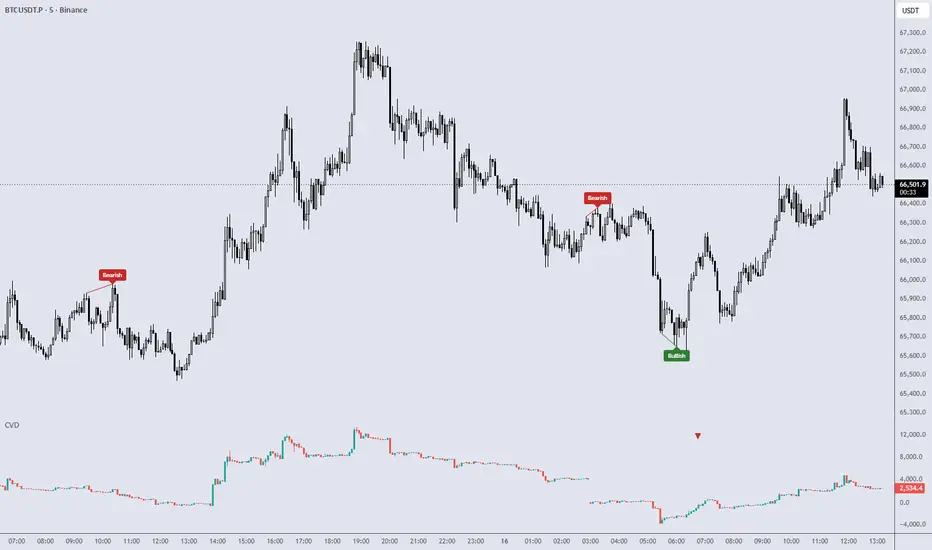
Price tells you what happened. Cumulative Volume Delta tries to tell you who was leaning on it. Delta is buying pressure minus selling pressure on each bar; CVD is that delta accumulated into a running line, so a market can grind sideways in price while the delta quietly stacks in one direction. CVD [Order Flow] builds that line, draws it as informative candles instead of a flat curve, and watches it for two order-flow behaviors traders care about: divergence against price and absorption. One honest caveat sits underneath all of it, and the tool is built around it rather than hiding it: TradingView does not know real buy versus sell volume, so this CVD is a lower-timeframe estimate — and on data where that estimate is weak, the tool stays quiet instead of inventing pressure.
HOW IT WORKS
CVD is reconstructed from a lower timeframe, because the chart timeframe alone cannot tell you how a bar's volume split between buyers and sellers. The tool requests intrabar data from a faster timeframe and classifies each intrabar: an up intrabar adds its volume as positive delta, a down intrabar subtracts it, and a doji counts as zero — on an ambiguous intrabar the tool refuses to guess a side.
Delta and CVD — each bar's delta is the sum of its intrabar deltas. The cumulative line is committed only when the bar closes (the live bar is shown separately and is provisional until then). Two accumulation modes: Session resets the running total at each session start; Cumulative carries it across.
CVD candles — by default CVD is drawn as candles in its own pane: the open is the previous close, the high and low are the running intrabar extremes of the cumulative within the bar, and the close is the bar's net delta. This shows the path the delta took inside the bar, not just where it ended — more informative than a plain line. Line and Line+Histogram styles are available too.
Divergence — drawn on the price chart, between a price pivot and the matching CVD pivot, on confirmed pivots only. Regular divergence (price makes a higher high or lower low while CVD does the opposite — a potential exhaustion read) and Hidden divergence (a continuation read, default off). Several filters gate it: minimum swing size, minimum CVD move, minimum pivot volume, and bar-distance bounds, so trivial wiggles do not get marked.
Absorption — a strong delta meeting a weak price result: a lot of one-sided pressure that fails to move price its way, as if the move is being absorbed. It is confirmed on the next candle. This is an order-flow pattern, not a buy or sell instruction.
The unreliable-data part is deliberate and silent. Behind the scenes the tool weighs the symbol type against how complete the intrabar measurement is. On a symbol with no real volume it withholds signals; on tick-volume data it stays cautious. There is no confidence panel or badge — the honesty is in the behavior, not in a label on your chart.
Intrabar data is pulled from a lower timeframe and classified into per-bar delta (up = +volume, down = -volume, doji = 0)
Delta is accumulated into CVD and committed on bar close; the running line is drawn as candles, line, or line+histogram
Confirmed price and CVD pivots are compared for divergence; a strong-delta / weak-result bar is flagged as absorption, confirmed next candle
HOW TO READ
The CVD line rising means net buying pressure is accumulating; falling means net selling pressure. Sideways price with a steadily climbing or dropping CVD is the situation this tool is built to surface.
CVD candles show the intrabar path: a long candle that closed near its delta extreme is one-sided flow, while a candle that ran far in delta but closed back near its open is flow that met resistance.
A regular divergence is price and CVD disagreeing at a swing — price extends, delta does not. A hidden divergence (off by default) is the continuation-flavored version. Both describe an order-flow condition, not a trade.
An absorption mark is heavy delta that did not get its move. It says pressure was met, nothing more.
"Bullish" and "Bearish" describe the direction of the pattern, not a buy or sell instruction. Marking a divergence or an absorption says nothing about whether price will turn, continue, or do neither. The tool maps the order flow; the read is yours.
INPUTS
LTF Source / Manual LTF — Auto picks a lower timeframe targeting enough intrabars per chart bar; Manual lets you set it yourself.
Accumulation — Session (reset the running total each session) or Cumulative (carry it across).
Show Bullish / Show Bearish Divergence — enable each direction independently.
Show Hidden — add the continuation-style hidden divergence (default off).
Pivot Left / Right — how many bars define a confirmed pivot (larger = stricter and later, but still no repaint).
Pivot Source — Wick or Close: measure pivots from the extremes or from the closes.
Min Swing Size / Min CVD Move / Min Pivot Volume / Min & Max Bars Between — the divergence quality filters; raise them for fewer, cleaner marks.
CVD Smoothing — smooth the CVD used for pivot detection.
Absorption — toggle the absorption pattern; its delta, range, and period thresholds define how strong the delta and how weak the result must be.
CVD Style — Candles (default), Line, or Line+Histogram.
Zero Line / Dim Live Bar / Up & Down Color — display options; Dim Live Bar visually marks the not-yet-committed bar.
ALERTS
CVD Bullish Divergence and CVD Bearish Divergence fire when a confirmed, filter-passing divergence is marked.
Absorption fires when a confirmed absorption is marked.
All fire on confirmed, quality-gated events — set them up with "Once Per Bar Close."
NOTES & LIMITS
This is an observation tool, not a forecast. The single most important thing to understand: TradingView does not provide real buy versus sell volume, so this CVD is a lower-timeframe estimate built by splitting each bar into faster intrabars and classifying them. That estimate is only as good as the volume data underneath it. On instruments with genuine traded volume — futures and crypto — it is at its most reliable. On forex and CFDs the "volume" is tick volume (number of price updates, not contracts traded), so the delta there is looser, and the tool treats it cautiously through a silent data-quality gate; on a symbol with no usable volume it withholds signals rather than drawing noise. There is no panel telling you this per bar — the caution is built into the behavior. Divergence and absorption are order-flow patterns, not buy or sell instructions, and marking one says nothing about whether price will reverse or continue. No repaint, no lookahead: the cumulative line is committed on confirmed (closed) bars and the live bar is shown separately as provisional; divergences are drawn on confirmed pivots only — they appear a few bars late by nature, but they do not move once printed; absorption is confirmed on the next candle. The lower-timeframe request reads completed intrabars and does not leak the future. No profit, win-rate, or guarantee claim. Open-source under CC BY-NC-SA 4.0 — non-commercial use, attribution to ElisTools required for reuse or derivatives. TradingView (Pine v6) only.
HOW IT WORKS
CVD is reconstructed from a lower timeframe, because the chart timeframe alone cannot tell you how a bar's volume split between buyers and sellers. The tool requests intrabar data from a faster timeframe and classifies each intrabar: an up intrabar adds its volume as positive delta, a down intrabar subtracts it, and a doji counts as zero — on an ambiguous intrabar the tool refuses to guess a side.
Delta and CVD — each bar's delta is the sum of its intrabar deltas. The cumulative line is committed only when the bar closes (the live bar is shown separately and is provisional until then). Two accumulation modes: Session resets the running total at each session start; Cumulative carries it across.
CVD candles — by default CVD is drawn as candles in its own pane: the open is the previous close, the high and low are the running intrabar extremes of the cumulative within the bar, and the close is the bar's net delta. This shows the path the delta took inside the bar, not just where it ended — more informative than a plain line. Line and Line+Histogram styles are available too.
Divergence — drawn on the price chart, between a price pivot and the matching CVD pivot, on confirmed pivots only. Regular divergence (price makes a higher high or lower low while CVD does the opposite — a potential exhaustion read) and Hidden divergence (a continuation read, default off). Several filters gate it: minimum swing size, minimum CVD move, minimum pivot volume, and bar-distance bounds, so trivial wiggles do not get marked.
Absorption — a strong delta meeting a weak price result: a lot of one-sided pressure that fails to move price its way, as if the move is being absorbed. It is confirmed on the next candle. This is an order-flow pattern, not a buy or sell instruction.
The unreliable-data part is deliberate and silent. Behind the scenes the tool weighs the symbol type against how complete the intrabar measurement is. On a symbol with no real volume it withholds signals; on tick-volume data it stays cautious. There is no confidence panel or badge — the honesty is in the behavior, not in a label on your chart.
Intrabar data is pulled from a lower timeframe and classified into per-bar delta (up = +volume, down = -volume, doji = 0)
Delta is accumulated into CVD and committed on bar close; the running line is drawn as candles, line, or line+histogram
Confirmed price and CVD pivots are compared for divergence; a strong-delta / weak-result bar is flagged as absorption, confirmed next candle
HOW TO READ
The CVD line rising means net buying pressure is accumulating; falling means net selling pressure. Sideways price with a steadily climbing or dropping CVD is the situation this tool is built to surface.
CVD candles show the intrabar path: a long candle that closed near its delta extreme is one-sided flow, while a candle that ran far in delta but closed back near its open is flow that met resistance.
A regular divergence is price and CVD disagreeing at a swing — price extends, delta does not. A hidden divergence (off by default) is the continuation-flavored version. Both describe an order-flow condition, not a trade.
An absorption mark is heavy delta that did not get its move. It says pressure was met, nothing more.
"Bullish" and "Bearish" describe the direction of the pattern, not a buy or sell instruction. Marking a divergence or an absorption says nothing about whether price will turn, continue, or do neither. The tool maps the order flow; the read is yours.
INPUTS
LTF Source / Manual LTF — Auto picks a lower timeframe targeting enough intrabars per chart bar; Manual lets you set it yourself.
Accumulation — Session (reset the running total each session) or Cumulative (carry it across).
Show Bullish / Show Bearish Divergence — enable each direction independently.
Show Hidden — add the continuation-style hidden divergence (default off).
Pivot Left / Right — how many bars define a confirmed pivot (larger = stricter and later, but still no repaint).
Pivot Source — Wick or Close: measure pivots from the extremes or from the closes.
Min Swing Size / Min CVD Move / Min Pivot Volume / Min & Max Bars Between — the divergence quality filters; raise them for fewer, cleaner marks.
CVD Smoothing — smooth the CVD used for pivot detection.
Absorption — toggle the absorption pattern; its delta, range, and period thresholds define how strong the delta and how weak the result must be.
CVD Style — Candles (default), Line, or Line+Histogram.
Zero Line / Dim Live Bar / Up & Down Color — display options; Dim Live Bar visually marks the not-yet-committed bar.
ALERTS
CVD Bullish Divergence and CVD Bearish Divergence fire when a confirmed, filter-passing divergence is marked.
Absorption fires when a confirmed absorption is marked.
All fire on confirmed, quality-gated events — set them up with "Once Per Bar Close."
NOTES & LIMITS
This is an observation tool, not a forecast. The single most important thing to understand: TradingView does not provide real buy versus sell volume, so this CVD is a lower-timeframe estimate built by splitting each bar into faster intrabars and classifying them. That estimate is only as good as the volume data underneath it. On instruments with genuine traded volume — futures and crypto — it is at its most reliable. On forex and CFDs the "volume" is tick volume (number of price updates, not contracts traded), so the delta there is looser, and the tool treats it cautiously through a silent data-quality gate; on a symbol with no usable volume it withholds signals rather than drawing noise. There is no panel telling you this per bar — the caution is built into the behavior. Divergence and absorption are order-flow patterns, not buy or sell instructions, and marking one says nothing about whether price will reverse or continue. No repaint, no lookahead: the cumulative line is committed on confirmed (closed) bars and the live bar is shown separately as provisional; divergences are drawn on confirmed pivots only — they appear a few bars late by nature, but they do not move once printed; absorption is confirmed on the next candle. The lower-timeframe request reads completed intrabars and does not leak the future. No profit, win-rate, or guarantee claim. Open-source under CC BY-NC-SA 4.0 — non-commercial use, attribution to ElisTools required for reuse or derivatives. TradingView (Pine v6) only.
نص برمجي مفتوح المصدر
بروح TradingView الحقيقية، قام مبتكر هذا النص البرمجي بجعله مفتوح المصدر، بحيث يمكن للمتداولين مراجعة وظائفه والتحقق منها. شكرا للمؤلف! بينما يمكنك استخدامه مجانًا، تذكر أن إعادة نشر الكود يخضع لقواعد الموقع الخاصة بنا.

"No-hype tools for serious chart traders — no profit promises, just clean tools that show their work."
إخلاء المسؤولية
لا يُقصد بالمعلومات والمنشورات أن تكون، أو تشكل، أي نصيحة مالية أو استثمارية أو تجارية أو أنواع أخرى من النصائح أو التوصيات المقدمة أو المعتمدة من TradingView. اقرأ المزيد في شروط الاستخدام.
نص برمجي مفتوح المصدر
بروح TradingView الحقيقية، قام مبتكر هذا النص البرمجي بجعله مفتوح المصدر، بحيث يمكن للمتداولين مراجعة وظائفه والتحقق منها. شكرا للمؤلف! بينما يمكنك استخدامه مجانًا، تذكر أن إعادة نشر الكود يخضع لقواعد الموقع الخاصة بنا.
"No-hype tools for serious chart traders — no profit promises, just clean tools that show their work."
إخلاء المسؤولية
لا يُقصد بالمعلومات والمنشورات أن تكون، أو تشكل، أي نصيحة مالية أو استثمارية أو تجارية أو أنواع أخرى من النصائح أو التوصيات المقدمة أو المعتمدة من TradingView. اقرأ المزيد في شروط الاستخدام.