تم تحديثه
Market Trend Classifier PRO (Trend / Bearish / Sideways)
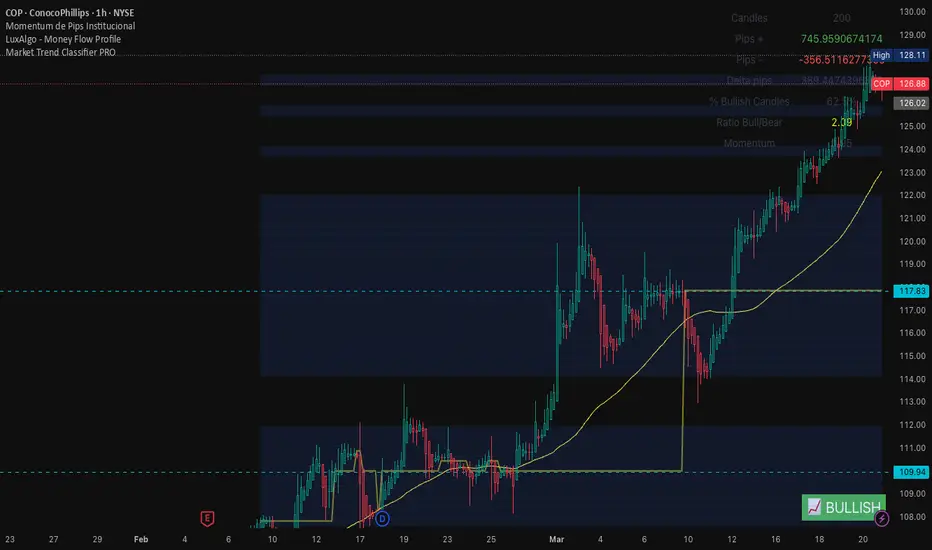
Description:
The Market Trend Classifier PRO is a clean and practical tool designed to help traders quickly identify the current market condition: bullish, bearish, or sideways (range-bound).
This indicator focuses on what truly matters for decision-making — market context — allowing traders to avoid low-probability trades and operate only when conditions are favourable.
The indicator classifies market conditions using three key components:
Moving Average Direction (SMA Slope)
A Simple Moving Average (default: 50) is used to determine the overall market direction. The slope of the SMA helps identify whether the market is trending or flattening.
Price Position Relative to SMA
Price above SMA → bullish bias
Price below SMA → bearish bias
Distance from SMA (Volatility Filter)
The indicator measures how far the price is from the SMA. This helps filter out weak or indecisive movements and avoid false signals during consolidation.
📊 Market Conditions
The script displays the current market condition in a table at the bottom-right of the chart:
📈 Bullish Trend
Strong upward momentum with price above the SMA and positive slope.
📉 Bearish Trend
Downward momentum with price below the SMA and a negative slope.
⚠️ Sideways Market
Low momentum, flat SMA, and price moving close to the average — indicating consolidation.
How to Use
Use this indicator as a market filter, not as an entry signal.
Trade long only in bullish conditions.
Trade short only in bearish conditions.
Avoid trading (or switch to range strategies) during sideways markets.
⚙️ Settings
SMA Length: Defines the trend baseline (default: 50)
Slope Lookback: Number of bars used to measure SMA slope
Slope Threshold: Sensitivity of trend detection
Distance Threshold: Minimum distance required to confirm trend strength
✅ Key Benefits
Eliminates confusion about market direction
Helps avoid trading during choppy conditions
Improves trade selection and timing
Clean and non-intrusive interface (table view)
⚠️ Disclaimer
This indicator does not provide buy or sell signals. It is intended to be used as a context filter within a broader trading strategy.
💡 Pro Tip
Combine this tool with price action, liquidity zones, or momentum indicators to significantly improve your trading performance.
If you found this tool useful, consider liking and sharing it to support further development 🚀
The Market Trend Classifier PRO is a clean and practical tool designed to help traders quickly identify the current market condition: bullish, bearish, or sideways (range-bound).
This indicator focuses on what truly matters for decision-making — market context — allowing traders to avoid low-probability trades and operate only when conditions are favourable.
The indicator classifies market conditions using three key components:
Moving Average Direction (SMA Slope)
A Simple Moving Average (default: 50) is used to determine the overall market direction. The slope of the SMA helps identify whether the market is trending or flattening.
Price Position Relative to SMA
Price above SMA → bullish bias
Price below SMA → bearish bias
Distance from SMA (Volatility Filter)
The indicator measures how far the price is from the SMA. This helps filter out weak or indecisive movements and avoid false signals during consolidation.
📊 Market Conditions
The script displays the current market condition in a table at the bottom-right of the chart:
📈 Bullish Trend
Strong upward momentum with price above the SMA and positive slope.
📉 Bearish Trend
Downward momentum with price below the SMA and a negative slope.
⚠️ Sideways Market
Low momentum, flat SMA, and price moving close to the average — indicating consolidation.
How to Use
Use this indicator as a market filter, not as an entry signal.
Trade long only in bullish conditions.
Trade short only in bearish conditions.
Avoid trading (or switch to range strategies) during sideways markets.
⚙️ Settings
SMA Length: Defines the trend baseline (default: 50)
Slope Lookback: Number of bars used to measure SMA slope
Slope Threshold: Sensitivity of trend detection
Distance Threshold: Minimum distance required to confirm trend strength
✅ Key Benefits
Eliminates confusion about market direction
Helps avoid trading during choppy conditions
Improves trade selection and timing
Clean and non-intrusive interface (table view)
⚠️ Disclaimer
This indicator does not provide buy or sell signals. It is intended to be used as a context filter within a broader trading strategy.
💡 Pro Tip
Combine this tool with price action, liquidity zones, or momentum indicators to significantly improve your trading performance.
If you found this tool useful, consider liking and sharing it to support further development 🚀
ملاحظات الأخبار
Description:The Market Trend Classifier PRO is a clean and practical tool designed to help traders quickly identify the current market condition: bullish, bearish, or sideways (range-bound).
This indicator focuses on what truly matters for decision-making — market context — allowing traders to avoid low-probability trades and operate only when conditions are favourable.
🔍 How It Works
The indicator classifies market conditions using three key components:
Moving Average Direction (SMA Slope)
A Simple Moving Average (default: 50) is used to determine the overall market direction. The slope of the SMA helps identify whether the market is trending or flattening.
Price Position Relative to SMA
Price above SMA → bullish bias
Price below SMA → bearish bias
Distance from SMA (Volatility Filter)
The indicator measures how far the price is from the SMA. This helps filter out weak or indecisive movements and avoid false signals during consolidation.
📊 Market Conditions
The script displays the current market condition in a table at the bottom-right of the chart:
📈 Bullish Trend
Strong upward momentum with price above the SMA and positive slope.
📉 Bearish Trend
Downward momentum with price below the SMA and a negative slope.
⚠️ Sideways Market
Low momentum, flat SMA, and price moving close to the average — indicating consolidation.
🎯 How to Use
Use this indicator as a market filter, not as an entry signal.
Trade long only in bullish conditions.
Trade short only in bearish conditions.
Avoid trading (or switch to range strategies) during sideways markets.
⚙️ Settings
SMA Length: Defines the trend baseline (default: 50)
Slope Lookback: Number of bars used to measure SMA slope
Slope Threshold: Sensitivity of trend detection
Distance Threshold: Minimum distance required to confirm trend strength
✅ Key Benefits
Eliminates confusion about market direction
Helps avoid trading during choppy conditions
Improves trade selection and timing
Clean and non-intrusive interface (table view)

إخلاء المسؤولية
لا يُقصد بالمعلومات والمنشورات أن تكون، أو تشكل، أي نصيحة مالية أو استثمارية أو تجارية أو أنواع أخرى من النصائح أو التوصيات المقدمة أو المعتمدة من TradingView. اقرأ المزيد في شروط الاستخدام.
إخلاء المسؤولية
لا يُقصد بالمعلومات والمنشورات أن تكون، أو تشكل، أي نصيحة مالية أو استثمارية أو تجارية أو أنواع أخرى من النصائح أو التوصيات المقدمة أو المعتمدة من TradingView. اقرأ المزيد في شروط الاستخدام.