OPEN-SOURCE SCRIPT
تم تحديثه Wraith Protocol Osc
What Is This Indicator?
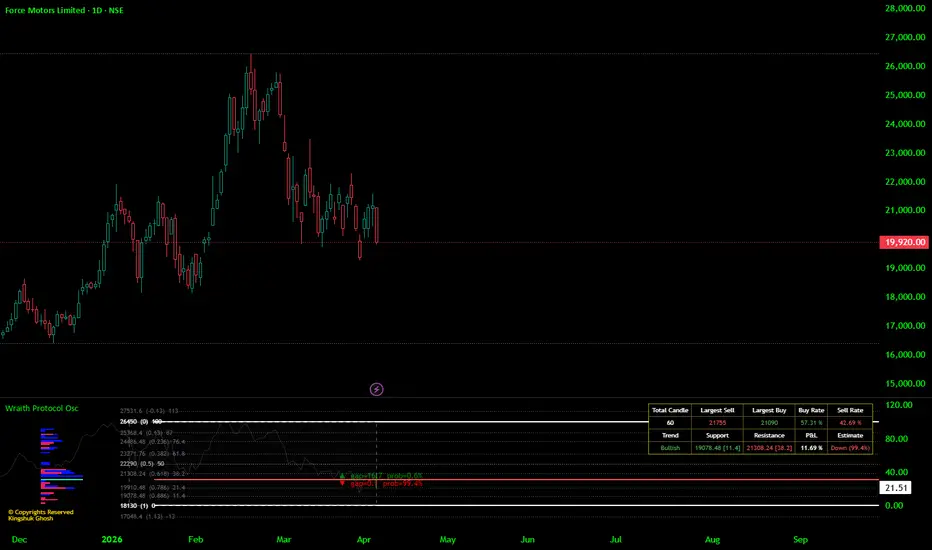
Rather than plotting raw price, it normalizes the entire lookback range onto a clean 0–100 scale, making it easier to visualize where price currently sits relative to its recent high and low — and how Fibonacci levels, volume clusters, and momentum all align in one unified pane.
Core Components & What They Do=>
1. Normalized Price Axis (0–100 Scale)
The indicator rescales price so that the lowest point of the lookback period = 0 and the highest = 100. This instantly tells you whether price is near the bottom, middle, or top of its recent range without doing any manual math.
2. Fibonacci Levels-
Eleven key Fibonacci ratios are plotted across the normalized range: -0.13, 0, 0.13, 0.236, 0.382, 0.5, 0.618, 0.786, 0.886, and 1.0, plus 1.13. Each level shows the actual price value alongside the ratio and normalized position. These act as dynamic support and resistance zones within the lookback window.
3. Volume Profile-
A horizontal volume profile is plotted to the right of the range box, split into buy volume (bullish candles) and sell volume (bearish candles) per price bucket. The Point of Control (POC) — the price level with the highest total volume — is highlighted in red. This is the most important level on the chart because it shows where the most trading activity has occurred.
4. Fibonacci Gap-Probability Arrows-
This is the signal engine. At the current bar, the indicator measures the gap between the current normalized price and the nearest Fibonacci level above and below. It then calculates a probability: if price is very close to the lower Fibonacci level and far from the upper one, the upward probability score is higher, and vice versa. The ▲ and ▼ arrows show these gap distances and probability percentages live on the chart.
Visual reinforcement — the dominant direction arrow renders in full brightness, the weaker direction fades to 50% opacity, so the bias is immediately readable without even reading the numbers.
Reading it in practice (both for long and short):
prob 60–70% → moderate bias, worth noting
prob 70–80% → strong bias, consider positioning
prob 80%+ → price is almost sitting on a level, high-conviction setup zone
5. Info Table-
A dashboard table showing: total candle count in the lookback, the largest single buy and sell candle price, buy/sell volume rates as percentages, trend bias (Bullish/Bearish), Fibonacci-derived support (0.886 retracement) and resistance (0.618 retracement), estimated P&L between those two levels, and the final directional Estimate (Up/Down/Neutral) derived from the probability arrows.
How to Trade with It=>
Step 1 — Read the Estimate first.
The bottom-right cell of the info table shows "Up (X%)" or "Down (X%)". This is your directional bias for the current bar. A probability above 60% is a meaningful lean; above 70% is a strong signal.
Step 2 — Confirm with Volume Profile.
Check where the POC line sits relative to current price. If the Estimate says "Up" and price is below the POC, the POC acts as a magnet — that is a higher-conviction long setup. If price is above the POC and the Estimate says "Down", look for mean-reversion short opportunities.
Step 3 — Use Fibonacci levels as entry and exit zones.
The 0.382, 0.5, and 0.618 levels are the most commonly respected. A bounce off the 0.618 normalized level (meaning price is near 38 on the 0–100 scale) with a bullish volume profile and an "Up" Estimate is a textbook long entry. Target the 0.382 or 0.236 level above for exits.
Step 4 — Check Buy Rate vs Sell Rate.
If Buy Rate is above 55% and the trend reads "Bullish", that confirms institutional buying pressure within the lookback window. Avoid longs when Sell Rate dominates even if the Estimate temporarily reads "Up" — it may just be a brief pullback within a downtrend.
Step 5 — Support and Resistance for Stop Placement.
The table's Support level (0.886 retracement) is a logical stop-loss zone for long trades. If price closes below it, the bullish thesis is invalidated. Resistance (0.618) is the first profit target.
Recommended Timeframes=>
The indicator is highly adaptable, but it performs best under these conditions:
Intraday Scalping — 3min to 15min: Use a lookback of 30–50 candles. The probability arrows update quickly and help identify short-term Fibonacci bounces within the session range.
Intraday Swing — 15min to 1 Hour: The default 60-candle lookback works well here. This is the sweet spot for the indicator — enough data for a meaningful volume profile while still being reactive to intraday structure.
Swing Trading — 4 Hour to Daily: Increase the lookback to 80–120 candles. Fibonacci levels at this timeframe represent multi-day support and resistance and are widely watched by institutional participants.
Avoid on tick charts or very low-volume instruments — the volume profile becomes unreliable without sufficient trade data.
Practical Tips=>
When the normalized close is between 40 and 60 (mid-range), treat signals as lower confidence — price is in no-man's-land between major Fibonacci levels.
The dominant volume bucket highlighted in teal/cyan on the profile is the strongest magnet zone. Price frequently returns to it.
Enable "Extend to Right Edge" on Fibonacci levels when using this for swing trades so you can see where levels project into future candles.
Flipping the Volume Profile to the left is useful when you want to keep the right side of the chart clean for price action reading.
⚠️ Disclaimer:
This indicator is provided strictly for educational and informational purposes only. It does not constitute financial advice, investment advice, or a recommendation to buy or sell any financial instrument. Past performance of any signal or strategy derived from this tool does not guarantee future results. All trading involves substantial risk of loss, including the possible loss of your entire invested capital. The probability estimates shown are purely mathematical calculations based on Fibonacci gap distances and do not predict future price movement. Always conduct your own due diligence, apply proper risk management, and consult a licensed/SEBI regd. financial advisor before making any trading decisions. (Pls read the entire description above) Happy Trading !!
Rather than plotting raw price, it normalizes the entire lookback range onto a clean 0–100 scale, making it easier to visualize where price currently sits relative to its recent high and low — and how Fibonacci levels, volume clusters, and momentum all align in one unified pane.
Core Components & What They Do=>
1. Normalized Price Axis (0–100 Scale)
The indicator rescales price so that the lowest point of the lookback period = 0 and the highest = 100. This instantly tells you whether price is near the bottom, middle, or top of its recent range without doing any manual math.
2. Fibonacci Levels-
Eleven key Fibonacci ratios are plotted across the normalized range: -0.13, 0, 0.13, 0.236, 0.382, 0.5, 0.618, 0.786, 0.886, and 1.0, plus 1.13. Each level shows the actual price value alongside the ratio and normalized position. These act as dynamic support and resistance zones within the lookback window.
3. Volume Profile-
A horizontal volume profile is plotted to the right of the range box, split into buy volume (bullish candles) and sell volume (bearish candles) per price bucket. The Point of Control (POC) — the price level with the highest total volume — is highlighted in red. This is the most important level on the chart because it shows where the most trading activity has occurred.
4. Fibonacci Gap-Probability Arrows-
This is the signal engine. At the current bar, the indicator measures the gap between the current normalized price and the nearest Fibonacci level above and below. It then calculates a probability: if price is very close to the lower Fibonacci level and far from the upper one, the upward probability score is higher, and vice versa. The ▲ and ▼ arrows show these gap distances and probability percentages live on the chart.
Visual reinforcement — the dominant direction arrow renders in full brightness, the weaker direction fades to 50% opacity, so the bias is immediately readable without even reading the numbers.
Reading it in practice (both for long and short):
prob 60–70% → moderate bias, worth noting
prob 70–80% → strong bias, consider positioning
prob 80%+ → price is almost sitting on a level, high-conviction setup zone
5. Info Table-
A dashboard table showing: total candle count in the lookback, the largest single buy and sell candle price, buy/sell volume rates as percentages, trend bias (Bullish/Bearish), Fibonacci-derived support (0.886 retracement) and resistance (0.618 retracement), estimated P&L between those two levels, and the final directional Estimate (Up/Down/Neutral) derived from the probability arrows.
How to Trade with It=>
Step 1 — Read the Estimate first.
The bottom-right cell of the info table shows "Up (X%)" or "Down (X%)". This is your directional bias for the current bar. A probability above 60% is a meaningful lean; above 70% is a strong signal.
Step 2 — Confirm with Volume Profile.
Check where the POC line sits relative to current price. If the Estimate says "Up" and price is below the POC, the POC acts as a magnet — that is a higher-conviction long setup. If price is above the POC and the Estimate says "Down", look for mean-reversion short opportunities.
Step 3 — Use Fibonacci levels as entry and exit zones.
The 0.382, 0.5, and 0.618 levels are the most commonly respected. A bounce off the 0.618 normalized level (meaning price is near 38 on the 0–100 scale) with a bullish volume profile and an "Up" Estimate is a textbook long entry. Target the 0.382 or 0.236 level above for exits.
Step 4 — Check Buy Rate vs Sell Rate.
If Buy Rate is above 55% and the trend reads "Bullish", that confirms institutional buying pressure within the lookback window. Avoid longs when Sell Rate dominates even if the Estimate temporarily reads "Up" — it may just be a brief pullback within a downtrend.
Step 5 — Support and Resistance for Stop Placement.
The table's Support level (0.886 retracement) is a logical stop-loss zone for long trades. If price closes below it, the bullish thesis is invalidated. Resistance (0.618) is the first profit target.
Recommended Timeframes=>
The indicator is highly adaptable, but it performs best under these conditions:
Intraday Scalping — 3min to 15min: Use a lookback of 30–50 candles. The probability arrows update quickly and help identify short-term Fibonacci bounces within the session range.
Intraday Swing — 15min to 1 Hour: The default 60-candle lookback works well here. This is the sweet spot for the indicator — enough data for a meaningful volume profile while still being reactive to intraday structure.
Swing Trading — 4 Hour to Daily: Increase the lookback to 80–120 candles. Fibonacci levels at this timeframe represent multi-day support and resistance and are widely watched by institutional participants.
Avoid on tick charts or very low-volume instruments — the volume profile becomes unreliable without sufficient trade data.
Practical Tips=>
When the normalized close is between 40 and 60 (mid-range), treat signals as lower confidence — price is in no-man's-land between major Fibonacci levels.
The dominant volume bucket highlighted in teal/cyan on the profile is the strongest magnet zone. Price frequently returns to it.
Enable "Extend to Right Edge" on Fibonacci levels when using this for swing trades so you can see where levels project into future candles.
Flipping the Volume Profile to the left is useful when you want to keep the right side of the chart clean for price action reading.
⚠️ Disclaimer:
This indicator is provided strictly for educational and informational purposes only. It does not constitute financial advice, investment advice, or a recommendation to buy or sell any financial instrument. Past performance of any signal or strategy derived from this tool does not guarantee future results. All trading involves substantial risk of loss, including the possible loss of your entire invested capital. The probability estimates shown are purely mathematical calculations based on Fibonacci gap distances and do not predict future price movement. Always conduct your own due diligence, apply proper risk management, and consult a licensed/SEBI regd. financial advisor before making any trading decisions. (Pls read the entire description above) Happy Trading !!
ملاحظات الأخبار
as per the house rule i have modified the script title & buy vol of VPملاحظات الأخبار
What changed (only 2 spots):CHANGE 1 — Three input.color lines added to the grpFib section:
fibKeyColor → controls 0.0 and 1.0 lines (default: white)
fibMidColor → controls the 0.5 midline (default: semi-transparent white)
fibRestColor → controls all other levels (default: gray)
CHANGE 2 — The hardcoded color lColor = isKey ? ... : isMid ? ... line now references those three inputs instead. The label textcolor was also updated to lColor so the price text beside each line matches its line color automatically.
نص برمجي مفتوح المصدر
بروح TradingView الحقيقية، قام مبتكر هذا النص البرمجي بجعله مفتوح المصدر، بحيث يمكن للمتداولين مراجعة وظائفه والتحقق منها. شكرا للمؤلف! بينما يمكنك استخدامه مجانًا، تذكر أن إعادة نشر الكود يخضع لقواعد الموقع الخاصة بنا.

إخلاء المسؤولية
لا يُقصد بالمعلومات والمنشورات أن تكون، أو تشكل، أي نصيحة مالية أو استثمارية أو تجارية أو أنواع أخرى من النصائح أو التوصيات المقدمة أو المعتمدة من TradingView. اقرأ المزيد في شروط الاستخدام.
نص برمجي مفتوح المصدر
بروح TradingView الحقيقية، قام مبتكر هذا النص البرمجي بجعله مفتوح المصدر، بحيث يمكن للمتداولين مراجعة وظائفه والتحقق منها. شكرا للمؤلف! بينما يمكنك استخدامه مجانًا، تذكر أن إعادة نشر الكود يخضع لقواعد الموقع الخاصة بنا.
إخلاء المسؤولية
لا يُقصد بالمعلومات والمنشورات أن تكون، أو تشكل، أي نصيحة مالية أو استثمارية أو تجارية أو أنواع أخرى من النصائح أو التوصيات المقدمة أو المعتمدة من TradingView. اقرأ المزيد في شروط الاستخدام.