Grid Bot Reality Check: Bot Profit vs Real Result
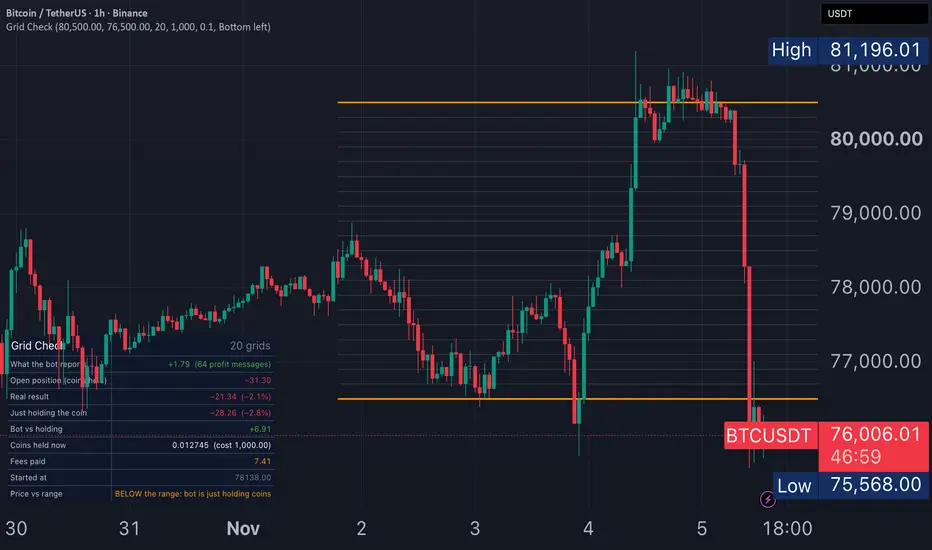
Grid Check replays a spot grid bot on any chart and puts the "grid profit" a bot dashboard reports next to the real result of the account. They are often far apart. The dashboard only counts completed buy-and-sell cycles. It leaves out the coins the bot is still holding after a drop, and those are usually where the loss is.
HOW TO USE
- Add the script to the chart of the coin and timeframe you want to test.
- TradingView asks you to click three things: the start candle, then the upper price and the lower price of the range.
- Open the settings to set the number of grids, the investment, arithmetic or geometric spacing, and the fee per trade.
- The orange lines mark the range and the grey lines mark each grid level. The table shows the results up to the latest candle.
WHAT THE TABLE SHOWS
- What the bot reports: grid profit from completed cycles, after fees, and how many "profit messages" (completed sells) that took
- Open position: the gain or loss on the coins the bot is holding right now
- Real result: cash plus the value of the coins held, minus the investment
- Just holding the coin: the same investment bought at the start price and held
- Bot vs holding: the difference between the two
- Coins held now and what they cost, fees paid, the start price, and whether the price is inside, above or below the range
HOW IT COUNTS
- The investment is split equally across the grids. At the start the bot buys, at the start price, the coins it needs for every sell order above the price, the way exchange grid bots do.
- On each later candle, a grid that holds coins sells when the high reaches its upper level, and an empty grid buys when the low reaches its lower level.
- Only one action per grid per candle, because a candle doesn't show whether the high or the low came first. Lower timeframes give a more precise replay.
- The fee is charged on every buy and every sell.
- "What the bot reports" counts one grid step per completed sell, like exchange dashboards. Real result is worked out from the actual cash and coins.
EXAMPLE ON THIS CHART
BINANCE BTCUSDT 1h, 1,000 USDT, 20 arithmetic grids from 76,500 to 80,500, started on Nov 2, 2026 at 78,138. At the time of publishing (Nov 5): 64 completed sells and +1.79 of reported grid profit. Real result about −22 (−2.2%), because BTC fell below the range and the bot is holding coins bought on the way down. Just holding would have been about −29 (−2.9%), so the bot did a little better than holding here, but the account is still down while the dashboard says profit.
LIMITATIONS
- Spot grid only: no leverage, no futures, no trailing or auto-shifting ranges.
- It uses the candles on your chart. Real fills can differ by slippage, order size limits and the exchange's own rounding.
- Exchanges differ in how they report grid profit. Compare the real result, not the dashboard number.
This is an educational tool. It is not financial advice and does not generate signals or recommend any bot.
HOW TO USE
- Add the script to the chart of the coin and timeframe you want to test.
- TradingView asks you to click three things: the start candle, then the upper price and the lower price of the range.
- Open the settings to set the number of grids, the investment, arithmetic or geometric spacing, and the fee per trade.
- The orange lines mark the range and the grey lines mark each grid level. The table shows the results up to the latest candle.
WHAT THE TABLE SHOWS
- What the bot reports: grid profit from completed cycles, after fees, and how many "profit messages" (completed sells) that took
- Open position: the gain or loss on the coins the bot is holding right now
- Real result: cash plus the value of the coins held, minus the investment
- Just holding the coin: the same investment bought at the start price and held
- Bot vs holding: the difference between the two
- Coins held now and what they cost, fees paid, the start price, and whether the price is inside, above or below the range
HOW IT COUNTS
- The investment is split equally across the grids. At the start the bot buys, at the start price, the coins it needs for every sell order above the price, the way exchange grid bots do.
- On each later candle, a grid that holds coins sells when the high reaches its upper level, and an empty grid buys when the low reaches its lower level.
- Only one action per grid per candle, because a candle doesn't show whether the high or the low came first. Lower timeframes give a more precise replay.
- The fee is charged on every buy and every sell.
- "What the bot reports" counts one grid step per completed sell, like exchange dashboards. Real result is worked out from the actual cash and coins.
EXAMPLE ON THIS CHART
BINANCE BTCUSDT 1h, 1,000 USDT, 20 arithmetic grids from 76,500 to 80,500, started on Nov 2, 2026 at 78,138. At the time of publishing (Nov 5): 64 completed sells and +1.79 of reported grid profit. Real result about −22 (−2.2%), because BTC fell below the range and the bot is holding coins bought on the way down. Just holding would have been about −29 (−2.9%), so the bot did a little better than holding here, but the account is still down while the dashboard says profit.
LIMITATIONS
- Spot grid only: no leverage, no futures, no trailing or auto-shifting ranges.
- It uses the candles on your chart. Real fills can differ by slippage, order size limits and the exchange's own rounding.
- Exchanges differ in how they report grid profit. Compare the real result, not the dashboard number.
This is an educational tool. It is not financial advice and does not generate signals or recommend any bot.

إخلاء المسؤولية
لا يُقصد بالمعلومات والمنشورات أن تكون، أو تشكل، أي نصيحة مالية أو استثمارية أو تجارية أو أنواع أخرى من النصائح أو التوصيات المقدمة أو المعتمدة من TradingView. اقرأ المزيد في شروط الاستخدام.
إخلاء المسؤولية
لا يُقصد بالمعلومات والمنشورات أن تكون، أو تشكل، أي نصيحة مالية أو استثمارية أو تجارية أو أنواع أخرى من النصائح أو التوصيات المقدمة أو المعتمدة من TradingView. اقرأ المزيد في شروط الاستخدام.