تم تحديثه
MSL Smart Trend Manager
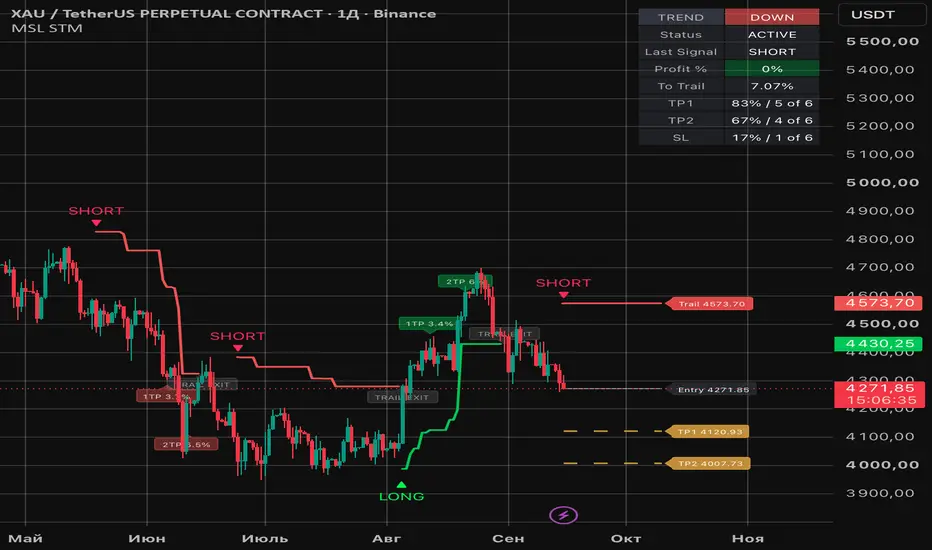
A trend tool that waits for price to break its own structure. No average, no channel: a LONG prints when a candle closes above the last confirmed swing high, a SHORT when a candle closes below the last confirmed swing low. Each signal opens one scenario with the entry, two ATR targets and an ATR trailing stop already on the chart, and the table keeps score of how the last fifty scenarios ended.
WHAT IS ON THE CHART
LONG and SHORT markers at signal candles. The trailing stop, green under a long scenario and red above a short one, drawn only while a scenario is open. 1TP and 2TP labels at target touches with the move from entry. A TRAIL EXIT label where a scenario ended on the stop. To the right of the last candle, while a scenario is open: the entry line, the stop line, the two target lines projected ahead, each with its price. A table with trend, status, last signal, open move, distance to the stop, and three rows of statistics.
THE SIGNAL
A swing high is a candle whose high is the highest within Pivot Length candles on each side, ten by default; a swing low is the mirror. A swing is confirmed only after those ten candles have closed, so the level the script trades against is always a finished one. LONG fires on the first close above the latest confirmed swing high while the script is not already long; SHORT on the first close below the latest confirmed swing low while it is not already short. Nothing is evaluated inside a live candle and a printed marker does not move.
This has two consequences you should know before buying. In a fresh trend the first breakout candle is often large, because the swing being broken formed ten candles earlier. In a range, swing highs and swing lows sit close together and the script will flip; Pivot Length and Min Bars Between Signals are the two dials that slow it down.

Ethereum, 4 hours. One LONG on 19 August from the 1,950 area: first target at 2.6%, second at 4.6%, then the trail climbs under the range for two weeks and ends the scenario near 2,390. On the right, a fresh LONG is open with its entry, stop and both targets projected ahead.
THE SCENARIO
Entry is the close of the signal candle, a reference for the arithmetic; your fill will differ. TP1 and TP2 are ATR multiples measured at entry, 2.0 and 3.5 by default, and do not move afterwards. The stop starts at ATR Multiplier times ATR from the close, four by default, follows price and only tightens; a level computed at a close applies from the next candle. Targets are milestones, not exits. After TP2 the stop is moved to at least TP1, so a scenario that reached the second target cannot end below the first one.
A scenario ends in two ways: price touches the stop, or the opposite signal fires. The opposite signal closes the old scenario and opens the new one on the same candle. There is no reentry rule: after a stop the script waits for the next structural break.

NVIDIA, daily. Three LONG scenarios in a year, each through both targets at roughly 5.5% and 10%, each ended by the trail after the second target. Between them, a LONG and a SHORT that went nowhere and were stopped. The table at the end of the frame reads 62% for TP1, 46% for TP2 and 34% for the stop over fifty scenarios.
HOW TO USE IT
A marker prints at candle close. The stop is the trailing line; the distance to it is your current risk and the table shows it as a percent. The two targets are the natural places to take something off. Set the LONG, SHORT and target alerts to Once Per Bar Close and the trail exit alerts to Once Per Bar, and the script reports every step without you watching the chart. If it talks too much on your instrument, raise Pivot Length or set Min Bars Between Signals; if the stop is hit by ordinary pullbacks, raise ATR Multiplier and accept the wider risk.

Silver, 4 hours. A LONG in July from the 56 area through both targets, a LONG in August from 62 through both targets to 72, then a stretch where a stop, a LONG and an opposite SHORT follow each other within a few candles. The last SHORT is still open with its stop, entry and targets projected on the right.
STATISTICS
The TP1 and TP2 rows show the share of the last completed scenarios, fifty by default, that touched each target. The SL row shows the share that were closed by the stop before touching TP1. A scenario closed by the opposite signal before TP1 is in the denominator of every row and in the numerator of none, so the three rows are not meant to add up to anything. When one candle touches both a target and the stop, the target counts and the scenario is closed by the stop on that same candle. Wick touches count.
These are touch rates of levels, not win rates and not returns: no fees, no sizing, no slippage, no partial exits, no account. A near target is touched more often because it is near. The value of the table is comparing rows across your own settings and instruments, not the number itself.

Nasdaq 100, one hour. Two LONG scenarios in two weeks: 27 August through both targets and out on the trail on 31 August, 3 September through the first target and out on the trail on 9 September. Between and after them, the SHORT side of the same rules, one of them stopped.
HOW IT DIFFERS FROM THE OTHER MSL TREND TOOLS
Profit Hunter ATR Pro, Profit Engine and Profit Navigator all trigger on price against a moving line: a rail, a re-anchoring center, a corridor. This script triggers on price against its own past swings, and that is the reason to pick it or to avoid it. A structure break needs no length and no engine to choose, and it reads the same on any instrument; the price is that it waits for a swing to be confirmed and can be later than a line on a fast move. Its stop is a plain ATR ratchet, its ladder has two steps instead of three, it has no reentry, and the opposite signal flips the position instead of waiting for a stop.
ALERTS AND SETTINGS
Eight alert conditions: LONG and SHORT signals, TP1 and TP2 for each direction, trail exit for each direction. Pivot Length is the sensitivity of the structure; Min Bars Between Signals is a frequency brake; ATR Length and ATR Multiplier shape the stop; the two TP multipliers set the ladder and TP2 is kept at least 0.25 ATR above TP1; Statistics Sample sets the memory of the table. Everything in Visuals, Active Trade Area and Dashboard is cosmetic. Every input has a tooltip.
INSTRUMENTS, TIMEFRAMES, REAL TIME
Standard candles only; Heikin Ashi, Renko, Kagi, Point and Figure and Range bars change the prices underneath and break every level here. H1 and up is the intended range; the frames above are a 4 hour crypto, a daily US equity, a 4 hour commodity and a 1 hour US index, and the cover is a 4 hour crypto chart. No lookahead and no future data: swings are used only after they are confirmed, signals are evaluated on closed candles, and a printed label stays where it was printed.
WHY CLOSED SOURCE
Swing pivots, breakout entries, ATR stops and ATR target ladders are public building blocks, and I have described how they are used here. What stays closed is the implementation: the state machine that carries a scenario from signal to exit, the order in which a target, a stop and an opposite signal on the same candle are resolved, the stop lock after the second target, and the bookkeeping behind the table. Concept, signal logic, parameter meanings, statistics method and limitations are all in this text.
LIMITATIONS
A structure break confirms after part of the move has happened, sometimes a large part. Ranges produce runs of small losses and flips; the two frequency inputs reduce them and do not remove them. Higher volatility widens the stop and the targets with it. Gaps and news candles can pass through the stop and both targets before the script can react, and the scenario is then closed at the stop level, not at the price you would have received. Illiquid instruments produce swings that mean little. Defaults are a starting point, not a recommendation. Past markers and table values do not predict anything. The script places no orders, sizes no positions, manages no account, and guarantees no level will be reached.
IMPORTANT
Analytical tool for chart study and education. It is not investment advice and not an offer to transact. Entry, size, risk and every trading decision are yours.
WHAT IS ON THE CHART
LONG and SHORT markers at signal candles. The trailing stop, green under a long scenario and red above a short one, drawn only while a scenario is open. 1TP and 2TP labels at target touches with the move from entry. A TRAIL EXIT label where a scenario ended on the stop. To the right of the last candle, while a scenario is open: the entry line, the stop line, the two target lines projected ahead, each with its price. A table with trend, status, last signal, open move, distance to the stop, and three rows of statistics.
THE SIGNAL
A swing high is a candle whose high is the highest within Pivot Length candles on each side, ten by default; a swing low is the mirror. A swing is confirmed only after those ten candles have closed, so the level the script trades against is always a finished one. LONG fires on the first close above the latest confirmed swing high while the script is not already long; SHORT on the first close below the latest confirmed swing low while it is not already short. Nothing is evaluated inside a live candle and a printed marker does not move.
This has two consequences you should know before buying. In a fresh trend the first breakout candle is often large, because the swing being broken formed ten candles earlier. In a range, swing highs and swing lows sit close together and the script will flip; Pivot Length and Min Bars Between Signals are the two dials that slow it down.
Ethereum, 4 hours. One LONG on 19 August from the 1,950 area: first target at 2.6%, second at 4.6%, then the trail climbs under the range for two weeks and ends the scenario near 2,390. On the right, a fresh LONG is open with its entry, stop and both targets projected ahead.
THE SCENARIO
Entry is the close of the signal candle, a reference for the arithmetic; your fill will differ. TP1 and TP2 are ATR multiples measured at entry, 2.0 and 3.5 by default, and do not move afterwards. The stop starts at ATR Multiplier times ATR from the close, four by default, follows price and only tightens; a level computed at a close applies from the next candle. Targets are milestones, not exits. After TP2 the stop is moved to at least TP1, so a scenario that reached the second target cannot end below the first one.
A scenario ends in two ways: price touches the stop, or the opposite signal fires. The opposite signal closes the old scenario and opens the new one on the same candle. There is no reentry rule: after a stop the script waits for the next structural break.
NVIDIA, daily. Three LONG scenarios in a year, each through both targets at roughly 5.5% and 10%, each ended by the trail after the second target. Between them, a LONG and a SHORT that went nowhere and were stopped. The table at the end of the frame reads 62% for TP1, 46% for TP2 and 34% for the stop over fifty scenarios.
HOW TO USE IT
A marker prints at candle close. The stop is the trailing line; the distance to it is your current risk and the table shows it as a percent. The two targets are the natural places to take something off. Set the LONG, SHORT and target alerts to Once Per Bar Close and the trail exit alerts to Once Per Bar, and the script reports every step without you watching the chart. If it talks too much on your instrument, raise Pivot Length or set Min Bars Between Signals; if the stop is hit by ordinary pullbacks, raise ATR Multiplier and accept the wider risk.
Silver, 4 hours. A LONG in July from the 56 area through both targets, a LONG in August from 62 through both targets to 72, then a stretch where a stop, a LONG and an opposite SHORT follow each other within a few candles. The last SHORT is still open with its stop, entry and targets projected on the right.
STATISTICS
The TP1 and TP2 rows show the share of the last completed scenarios, fifty by default, that touched each target. The SL row shows the share that were closed by the stop before touching TP1. A scenario closed by the opposite signal before TP1 is in the denominator of every row and in the numerator of none, so the three rows are not meant to add up to anything. When one candle touches both a target and the stop, the target counts and the scenario is closed by the stop on that same candle. Wick touches count.
These are touch rates of levels, not win rates and not returns: no fees, no sizing, no slippage, no partial exits, no account. A near target is touched more often because it is near. The value of the table is comparing rows across your own settings and instruments, not the number itself.
Nasdaq 100, one hour. Two LONG scenarios in two weeks: 27 August through both targets and out on the trail on 31 August, 3 September through the first target and out on the trail on 9 September. Between and after them, the SHORT side of the same rules, one of them stopped.
HOW IT DIFFERS FROM THE OTHER MSL TREND TOOLS
Profit Hunter ATR Pro, Profit Engine and Profit Navigator all trigger on price against a moving line: a rail, a re-anchoring center, a corridor. This script triggers on price against its own past swings, and that is the reason to pick it or to avoid it. A structure break needs no length and no engine to choose, and it reads the same on any instrument; the price is that it waits for a swing to be confirmed and can be later than a line on a fast move. Its stop is a plain ATR ratchet, its ladder has two steps instead of three, it has no reentry, and the opposite signal flips the position instead of waiting for a stop.
ALERTS AND SETTINGS
Eight alert conditions: LONG and SHORT signals, TP1 and TP2 for each direction, trail exit for each direction. Pivot Length is the sensitivity of the structure; Min Bars Between Signals is a frequency brake; ATR Length and ATR Multiplier shape the stop; the two TP multipliers set the ladder and TP2 is kept at least 0.25 ATR above TP1; Statistics Sample sets the memory of the table. Everything in Visuals, Active Trade Area and Dashboard is cosmetic. Every input has a tooltip.
INSTRUMENTS, TIMEFRAMES, REAL TIME
Standard candles only; Heikin Ashi, Renko, Kagi, Point and Figure and Range bars change the prices underneath and break every level here. H1 and up is the intended range; the frames above are a 4 hour crypto, a daily US equity, a 4 hour commodity and a 1 hour US index, and the cover is a 4 hour crypto chart. No lookahead and no future data: swings are used only after they are confirmed, signals are evaluated on closed candles, and a printed label stays where it was printed.
WHY CLOSED SOURCE
Swing pivots, breakout entries, ATR stops and ATR target ladders are public building blocks, and I have described how they are used here. What stays closed is the implementation: the state machine that carries a scenario from signal to exit, the order in which a target, a stop and an opposite signal on the same candle are resolved, the stop lock after the second target, and the bookkeeping behind the table. Concept, signal logic, parameter meanings, statistics method and limitations are all in this text.
LIMITATIONS
A structure break confirms after part of the move has happened, sometimes a large part. Ranges produce runs of small losses and flips; the two frequency inputs reduce them and do not remove them. Higher volatility widens the stop and the targets with it. Gaps and news candles can pass through the stop and both targets before the script can react, and the scenario is then closed at the stop level, not at the price you would have received. Illiquid instruments produce swings that mean little. Defaults are a starting point, not a recommendation. Past markers and table values do not predict anything. The script places no orders, sizes no positions, manages no account, and guarantees no level will be reached.
IMPORTANT
Analytical tool for chart study and education. It is not investment advice and not an offer to transact. Entry, size, risk and every trading decision are yours.
ملاحظات الأخبار
Main picture updated
Trading tools by MarketStructureLab. Professional indicators, algorithms & market structure logic. Get access: marketstructurelab.com
إخلاء المسؤولية
لا يُقصد بالمعلومات والمنشورات أن تكون، أو تشكل، أي نصيحة مالية أو استثمارية أو تجارية أو أنواع أخرى من النصائح أو التوصيات المقدمة أو المعتمدة من TradingView. اقرأ المزيد في شروط الاستخدام.
Trading tools by MarketStructureLab. Professional indicators, algorithms & market structure logic. Get access: marketstructurelab.com
إخلاء المسؤولية
لا يُقصد بالمعلومات والمنشورات أن تكون، أو تشكل، أي نصيحة مالية أو استثمارية أو تجارية أو أنواع أخرى من النصائح أو التوصيات المقدمة أو المعتمدة من TradingView. اقرأ المزيد في شروط الاستخدام.