OI Candle by Umut
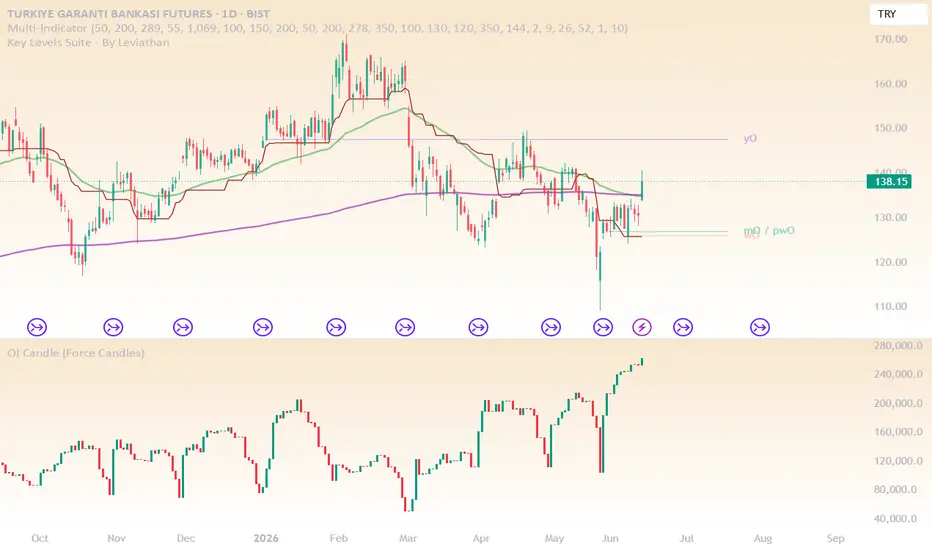
This indicator displays Open Interest (OI) as candlestick data across all timeframes, giving traders a clearer view of market participation and positioning dynamics.
Unlike standard OI indicators that use line charts or are limited to higher timeframes, this version visualizes OI using full OHLC candles. This allows you to analyze volatility, momentum, and structural changes in open interest in the same way as price action.
Unlike standard OI indicators that use line charts or are limited to higher timeframes, this version visualizes OI using full OHLC candles. This allows you to analyze volatility, momentum, and structural changes in open interest in the same way as price action.

إخلاء المسؤولية
لا يُقصد بالمعلومات والمنشورات أن تكون، أو تشكل، أي نصيحة مالية أو استثمارية أو تجارية أو أنواع أخرى من النصائح أو التوصيات المقدمة أو المعتمدة من TradingView. اقرأ المزيد في شروط الاستخدام.
إخلاء المسؤولية
لا يُقصد بالمعلومات والمنشورات أن تكون، أو تشكل، أي نصيحة مالية أو استثمارية أو تجارية أو أنواع أخرى من النصائح أو التوصيات المقدمة أو المعتمدة من TradingView. اقرأ المزيد في شروط الاستخدام.