Trend Significance Signals [Jayadev Rana]
OVERVIEW
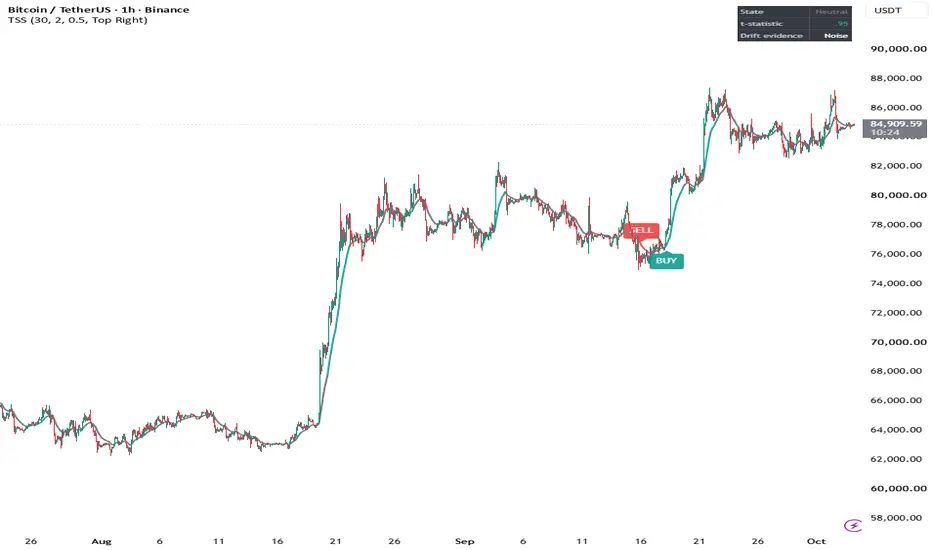
Trend Significance Signals is a trend-following overlay that prints alternating BUY and SELL signals from a statistical test instead of a price or moving-average cross. On every bar it asks one question: is the average return of the recent bars different enough from zero, relative to how much those returns vary, that it is unlikely to be noise? The answer is a t-statistic, and signals fire when it crosses a threshold.
HOW IT WORKS
1. The script takes the log return of each bar over the Sample Length.
2. It computes the mean of those returns and their standard deviation.
3. The t-statistic is the mean divided by its standard error (standard deviation divided by the square root of the sample size).
A large positive value means the recent returns were consistently positive relative to their own variability. A value near zero means that whatever net movement occurred is well within what random bar-to-bar variation would produce. Because the measure is a ratio, it is independent of price scale and of the instrument's volatility level.
The state is up when the t-statistic is at or above the Signal Threshold, down when it is at or below the negative threshold, and optionally returns to neutral when its absolute value falls under the Neutral Threshold. The gap between the two thresholds acts as hysteresis and prevents flicker.
SIGNALS
- BUY: the state turns up on a closed bar and the last signal was not a BUY.
- SELL: the state turns down on a closed bar and the last signal was not a SELL.
Signals strictly alternate. A pass through neutral does not repeat the previous signal. Signals are evaluated on closed bars and are not changed afterwards.
The baseline (an EMA with the same length as the sample) and the optional bar coloring show the current state. Neutral bars are drawn faded so that periods without statistical evidence of drift are easy to see.
DASHBOARD
State, the current t-statistic, and a plain-language reading of the evidence: Noise (below 1), Weak (1 to 2), Significant (2 to 3) or Strong (3 and above).
SETTINGS
Core: Sample Length, Signal Threshold (t), Neutral Threshold (t), Allow Neutral State, Color Bars by State.
Dashboard: visibility and position.
Style: colors.
DEFAULT SETTINGS
The default values were chosen with a parameter search on BTCUSDT on the 1-hour timeframe. The search treated the signals as a stop-and-reverse system with trading costs, split the history into an earlier and a later segment, and kept only settings that held up in both segments. Other symbols and timeframes will usually need different values; treat the defaults as a starting point and not as a recommendation.
ALERTS
Buy Signal, Sell Signal.
LIMITATIONS
- This is a trend-following tool. A drift has to exist for a while before it becomes statistically visible, so signals arrive after the move has started.
- Market returns are not independent and not normally distributed, so the t-statistic is used here as a ranking measure and not as a formal probability. A value of 2 does not mean a 95 percent chance that the trend continues.
- In sideways markets short bursts can cross the threshold in both directions and produce losing signals.
- A single very large bar inflates the standard deviation and can lower the t-statistic even though price moved strongly.
- Settings tuned on past data can stop working when market behavior changes.
This script is for analysis and education. It does not provide financial advice, and past behavior of any signal does not guarantee future results.
Trend Significance Signals is a trend-following overlay that prints alternating BUY and SELL signals from a statistical test instead of a price or moving-average cross. On every bar it asks one question: is the average return of the recent bars different enough from zero, relative to how much those returns vary, that it is unlikely to be noise? The answer is a t-statistic, and signals fire when it crosses a threshold.
HOW IT WORKS
1. The script takes the log return of each bar over the Sample Length.
2. It computes the mean of those returns and their standard deviation.
3. The t-statistic is the mean divided by its standard error (standard deviation divided by the square root of the sample size).
A large positive value means the recent returns were consistently positive relative to their own variability. A value near zero means that whatever net movement occurred is well within what random bar-to-bar variation would produce. Because the measure is a ratio, it is independent of price scale and of the instrument's volatility level.
The state is up when the t-statistic is at or above the Signal Threshold, down when it is at or below the negative threshold, and optionally returns to neutral when its absolute value falls under the Neutral Threshold. The gap between the two thresholds acts as hysteresis and prevents flicker.
SIGNALS
- BUY: the state turns up on a closed bar and the last signal was not a BUY.
- SELL: the state turns down on a closed bar and the last signal was not a SELL.
Signals strictly alternate. A pass through neutral does not repeat the previous signal. Signals are evaluated on closed bars and are not changed afterwards.
The baseline (an EMA with the same length as the sample) and the optional bar coloring show the current state. Neutral bars are drawn faded so that periods without statistical evidence of drift are easy to see.
DASHBOARD
State, the current t-statistic, and a plain-language reading of the evidence: Noise (below 1), Weak (1 to 2), Significant (2 to 3) or Strong (3 and above).
SETTINGS
Core: Sample Length, Signal Threshold (t), Neutral Threshold (t), Allow Neutral State, Color Bars by State.
Dashboard: visibility and position.
Style: colors.
DEFAULT SETTINGS
The default values were chosen with a parameter search on BTCUSDT on the 1-hour timeframe. The search treated the signals as a stop-and-reverse system with trading costs, split the history into an earlier and a later segment, and kept only settings that held up in both segments. Other symbols and timeframes will usually need different values; treat the defaults as a starting point and not as a recommendation.
ALERTS
Buy Signal, Sell Signal.
LIMITATIONS
- This is a trend-following tool. A drift has to exist for a while before it becomes statistically visible, so signals arrive after the move has started.
- Market returns are not independent and not normally distributed, so the t-statistic is used here as a ranking measure and not as a formal probability. A value of 2 does not mean a 95 percent chance that the trend continues.
- In sideways markets short bursts can cross the threshold in both directions and produce losing signals.
- A single very large bar inflates the standard deviation and can lower the t-statistic even though price moved strongly.
- Settings tuned on past data can stop working when market behavior changes.
This script is for analysis and education. It does not provide financial advice, and past behavior of any signal does not guarantee future results.

إخلاء المسؤولية
لا يُقصد بالمعلومات والمنشورات أن تكون، أو تشكل، أي نصيحة مالية أو استثمارية أو تجارية أو أنواع أخرى من النصائح أو التوصيات المقدمة أو المعتمدة من TradingView. اقرأ المزيد في شروط الاستخدام.
إخلاء المسؤولية
لا يُقصد بالمعلومات والمنشورات أن تكون، أو تشكل، أي نصيحة مالية أو استثمارية أو تجارية أو أنواع أخرى من النصائح أو التوصيات المقدمة أو المعتمدة من TradingView. اقرأ المزيد في شروط الاستخدام.