OPEN-SOURCE SCRIPT
تم تحديثه Koda Point of Control
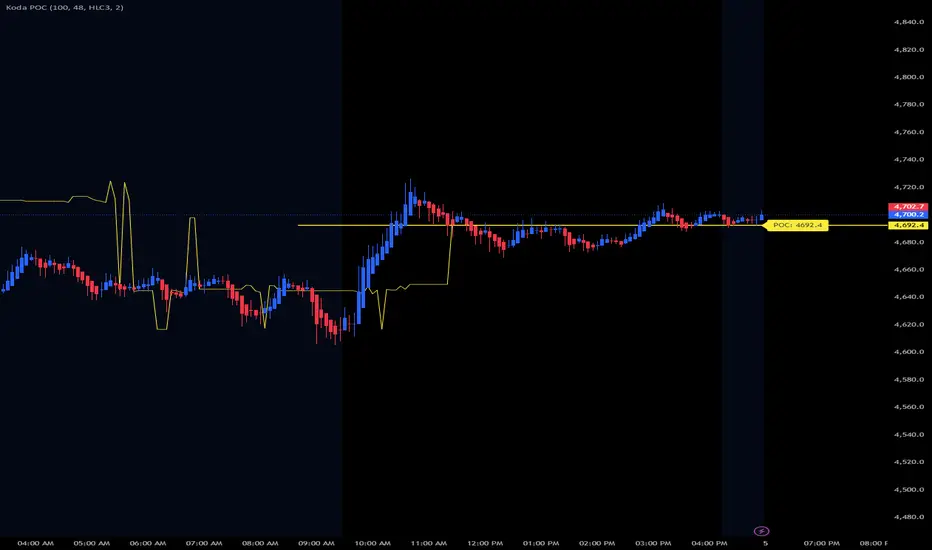
KODA POINT OF CONTROL
What the POC Shows
👉 POC = the price where the most volume traded within your selected range.
Think of it as:
• 🎯 Fair value
• ⚖️ Balance point
• 🧲 Price magnet
________________________________________
🧩 1. What You See on the Chart
🟡 POC Line
• Yellow horizontal line
• Extends across the chart
• Updates as price/volume changes
________________________________________
🏷 POC Label
• Displays exact price
• Example:
POC: 4325.50
________________________________________
🔲 Optional Range Box (if enabled)
• Shows the lookback area used for calculation
________________________________________
⚙️ 2. Key Settings
🔹 Lookback Bars
Controls how far back the POC is calculated
• Lower (50–100) → short-term / scalping
• Higher (150–300) → swing / structure
👉 This is the MOST important setting
________________________________________
🔹 Price Rows
Controls precision
• Lower → faster, less precise
• Higher → more precise, heavier
👉 Recommended:
• 48 → good balance
• 64–100 → advanced precision
________________________________________
🔹 Price Source
How volume is assigned:
• HLC3 (best default) → balanced
• Close → simpler
• HL2 → smoother
________________________________________
🎯 3. How to Trade With POC
🔥 1. POC as Magnet
👉 Price is often drawn back to POC
Example:
• Price moves away
• Later returns to POC
📌 Use it as:
• reversion target
• intraday pullback zone
________________________________________
🔥 2. POC as Support / Resistance
When price is ABOVE POC:
👉 POC acts as support
When price is BELOW POC:
👉 POC acts as resistance
________________________________________
🔥 3. Break & Hold Strategy
Bullish:
1. Price below POC
2. Breaks above
3. Holds above
👉 Enter long
________________________________________
Bearish:
1. Price above POC
2. Breaks below
3. Holds below
👉 Enter short
________________________________________
🔥 4. Rejection Trades
At POC:
If price:
• touches POC
• rejects (wick + close away)
👉 Trade the rejection
________________________________________
⚡ 4. Best Use Cases
🏎 Scalping
• Use small lookback (50–100)
• Trade reactions at POC
________________________________________
📊 Intraday Trading
• Use medium lookback (100–200)
• Combine with structure
________________________________________
🧠 Smart Money / SMC
Use POC with:
• BOS (Break of Structure)
• liquidity sweeps
• premium/discount zones
________________________________________
🚀 5. Pro Strategy (Best Setup)
Long Setup:
1. Price below POC
2. Liquidity sweep
3. Break above POC
4. Hold above
👉 Enter long
👉 Target highs
________________________________________
Short Setup:
1. Price above POC
2. Liquidity sweep
3. Break below POC
4. Hold below
👉 Enter short
👉 Target lows
________________________________________
⚠️ 6. Common Mistakes
❌ Using too small lookback
• POC becomes noisy
________________________________________
❌ Ignoring trend
POC works BEST with bias
________________________________________
❌ Treating it as exact line
It’s a zone, not a pixel-perfect level
________________________________________
🧠 7. What This Indicator Really Gives You
• 📍 Fair value area
• 🧲 Where price wants to return
• ⚖️ Market balance
• 🎯 High-probability reaction zone
________________________________________
🔑 Final Concept
👉 Price moves:
• away from POC (imbalance)
• back to POC (rebalance)
________________________________________
🔥 Best Combo
Use with your system:
• Koda BOS → structure
• Koda S/R → levels
• Koda POC → fair value
What the POC Shows
👉 POC = the price where the most volume traded within your selected range.
Think of it as:
• 🎯 Fair value
• ⚖️ Balance point
• 🧲 Price magnet
________________________________________
🧩 1. What You See on the Chart
🟡 POC Line
• Yellow horizontal line
• Extends across the chart
• Updates as price/volume changes
________________________________________
🏷 POC Label
• Displays exact price
• Example:
POC: 4325.50
________________________________________
🔲 Optional Range Box (if enabled)
• Shows the lookback area used for calculation
________________________________________
⚙️ 2. Key Settings
🔹 Lookback Bars
Controls how far back the POC is calculated
• Lower (50–100) → short-term / scalping
• Higher (150–300) → swing / structure
👉 This is the MOST important setting
________________________________________
🔹 Price Rows
Controls precision
• Lower → faster, less precise
• Higher → more precise, heavier
👉 Recommended:
• 48 → good balance
• 64–100 → advanced precision
________________________________________
🔹 Price Source
How volume is assigned:
• HLC3 (best default) → balanced
• Close → simpler
• HL2 → smoother
________________________________________
🎯 3. How to Trade With POC
🔥 1. POC as Magnet
👉 Price is often drawn back to POC
Example:
• Price moves away
• Later returns to POC
📌 Use it as:
• reversion target
• intraday pullback zone
________________________________________
🔥 2. POC as Support / Resistance
When price is ABOVE POC:
👉 POC acts as support
When price is BELOW POC:
👉 POC acts as resistance
________________________________________
🔥 3. Break & Hold Strategy
Bullish:
1. Price below POC
2. Breaks above
3. Holds above
👉 Enter long
________________________________________
Bearish:
1. Price above POC
2. Breaks below
3. Holds below
👉 Enter short
________________________________________
🔥 4. Rejection Trades
At POC:
If price:
• touches POC
• rejects (wick + close away)
👉 Trade the rejection
________________________________________
⚡ 4. Best Use Cases
🏎 Scalping
• Use small lookback (50–100)
• Trade reactions at POC
________________________________________
📊 Intraday Trading
• Use medium lookback (100–200)
• Combine with structure
________________________________________
🧠 Smart Money / SMC
Use POC with:
• BOS (Break of Structure)
• liquidity sweeps
• premium/discount zones
________________________________________
🚀 5. Pro Strategy (Best Setup)
Long Setup:
1. Price below POC
2. Liquidity sweep
3. Break above POC
4. Hold above
👉 Enter long
👉 Target highs
________________________________________
Short Setup:
1. Price above POC
2. Liquidity sweep
3. Break below POC
4. Hold below
👉 Enter short
👉 Target lows
________________________________________
⚠️ 6. Common Mistakes
❌ Using too small lookback
• POC becomes noisy
________________________________________
❌ Ignoring trend
POC works BEST with bias
________________________________________
❌ Treating it as exact line
It’s a zone, not a pixel-perfect level
________________________________________
🧠 7. What This Indicator Really Gives You
• 📍 Fair value area
• 🧲 Where price wants to return
• ⚖️ Market balance
• 🎯 High-probability reaction zone
________________________________________
🔑 Final Concept
👉 Price moves:
• away from POC (imbalance)
• back to POC (rebalance)
________________________________________
🔥 Best Combo
Use with your system:
• Koda BOS → structure
• Koda S/R → levels
• Koda POC → fair value
ملاحظات الأخبار
KODA POINT OF CONTROL (POC) The KODA Point of Control (POC) is a volume-based equilibrium indicator designed to identify the price level where the highest amount of trading activity has occurred within a defined range. This level represents the most accepted price by the market over that period and serves as a key reference for fair value, balance, and future price interaction.
Unlike traditional static levels, the KODA POC dynamically adapts to changing market conditions by recalculating as new price and volume data come in. This allows traders to continuously track where market participants are most actively engaged and where price is most likely to react.
________________________________________
What the POC Represents
The POC is the price level with the highest traded volume within a selected lookback window.
Conceptually, it reflects:
• Fair value: where buyers and sellers agree most
• Balance point: equilibrium between supply and demand
• Price magnet: an area price is naturally drawn back to
Markets tend to rotate around value. When price moves away from this equilibrium, it often seeks to return unless a strong directional imbalance is present.
________________________________________
How the Indicator Works
The KODA POC calculates volume distribution across a defined price range using a discretized approach:
1. The selected lookback period is divided into multiple price intervals (rows).
2. Volume is allocated to each price level based on the chosen price source (HLC3, Close, or HL2).
3. The total volume accumulated at each price level is tracked.
4. The price level with the highest volume concentration becomes the POC.
This method creates a simplified but efficient volume profile without requiring full tick-level data, making it both accurate and computationally efficient.
________________________________________
What You See on the Chart
POC Line
A horizontal line plotted at the price level with the highest traded volume.
It extends across the chart and updates dynamically as new data forms.
POC Label
Displays the exact value of the POC for precision and clarity.
Range Box (Optional)
A visual representation of the lookback window used for the calculation. This helps traders understand the context behind the current POC level.
________________________________________
Key Settings Explained
Lookback Bars
Defines how much historical data is used in the calculation.
• Lower values (50–100): more reactive, suited for short-term trading
• Higher values (150–300): more stable, suited for structure and swing analysis
This is the most important parameter because it determines whether the POC reflects short-term activity or broader market consensus.
________________________________________
Price Rows
Controls how finely the price range is divided.
• Lower values: faster computation, less precision
• Higher values: more precise volume distribution, heavier processing
Recommended ranges:
• 48: balanced performance and accuracy
• 64–100: higher precision for advanced users
________________________________________
Price Source
Determines how price is sampled when assigning volume.
• HLC3: balanced representation of price action (recommended default)
• Close: simplified and more direct
• HL2: smoother distribution
________________________________________
How to Use the POC in Trading
POC as a Magnet
Price frequently returns to the POC after moving away. This makes it useful as a reversion target or pullback level.
POC as Support and Resistance
• When price is above POC, it often acts as support
• When price is below POC, it often acts as resistance
This behavior reflects the shift in perceived value.
________________________________________
Break and Hold Strategy
Bullish scenario:
1. Price is below POC
2. Price breaks above POC
3. Price holds above it
This suggests acceptance of higher value and potential continuation upward.
Bearish scenario:
1. Price is above POC
2. Price breaks below POC
3. Price holds below it
This indicates acceptance of lower value and potential continuation downward.
________________________________________
Rejection Trades
When price interacts with the POC and fails to hold:
• A touch followed by a strong rejection (wick and close away)
• Indicates rejection of value
• Can be used for directional entries away from the POC
________________________________________
Best Use Cases
Scalping
Use a smaller lookback (50–100) to capture short-term equilibrium shifts and trade quick reactions.
Intraday Trading
Use a medium lookback (100–200) to align with session-based value areas and structure.
Smart Money Concepts (SMC)
The POC integrates effectively with:
• Break of Structure (BOS)
• Liquidity sweeps
• Premium and discount zones
It helps define where value is being established relative to structure.
________________________________________
Advanced Strategy Concept
Long Setup:
1. Price is below POC
2. Liquidity is swept below
3. Price breaks above POC
4. Price holds above
This indicates a shift in value and potential continuation upward.
Short Setup:
1. Price is above POC
2. Liquidity is swept above
3. Price breaks below POC
4. Price holds below
This signals a shift downward in accepted value.
________________________________________
Common Mistakes
Using too small a lookback
Results in a noisy and unstable POC that lacks meaningful context.
Ignoring trend direction
POC is most effective when aligned with market bias rather than traded in isolation.
Treating POC as an exact line
It should be interpreted as a zone of interest rather than a precise price.
________________________________________
What Makes KODA POC Distinct
The KODA POC is designed to balance precision, performance, and usability:
• Efficient volume distribution without requiring full volume profile complexity
• Customizable granularity through price rows
• Adaptive to different trading styles via lookback control
• Integrated seamlessly with structure-based systems like BOS and S/R
This makes it both accessible for newer traders and powerful enough for advanced strategies.
________________________________________
Core Market Principle Behind the Indicator
Markets alternate between imbalance and balance.
• When price moves away from POC, the market is in imbalance
• When price returns to POC, the market is rebalancing
Understanding this cycle is key to using the indicator effectively.
________________________________________
Integration Within the KODA System
The KODA POC is designed to complement:
• KODA BOS for structure and directional bias
• KODA S/R for key levels
• KODA POC for fair value and equilibrium
Together, they provide a complete framework for understanding price behavior:
structure, levels, and value.
نص برمجي مفتوح المصدر
بروح TradingView الحقيقية، قام مبتكر هذا النص البرمجي بجعله مفتوح المصدر، بحيث يمكن للمتداولين مراجعة وظائفه والتحقق منها. شكرا للمؤلف! بينما يمكنك استخدامه مجانًا، تذكر أن إعادة نشر الكود يخضع لقواعد الموقع الخاصة بنا.

إخلاء المسؤولية
لا يُقصد بالمعلومات والمنشورات أن تكون، أو تشكل، أي نصيحة مالية أو استثمارية أو تجارية أو أنواع أخرى من النصائح أو التوصيات المقدمة أو المعتمدة من TradingView. اقرأ المزيد في شروط الاستخدام.
نص برمجي مفتوح المصدر
بروح TradingView الحقيقية، قام مبتكر هذا النص البرمجي بجعله مفتوح المصدر، بحيث يمكن للمتداولين مراجعة وظائفه والتحقق منها. شكرا للمؤلف! بينما يمكنك استخدامه مجانًا، تذكر أن إعادة نشر الكود يخضع لقواعد الموقع الخاصة بنا.
إخلاء المسؤولية
لا يُقصد بالمعلومات والمنشورات أن تكون، أو تشكل، أي نصيحة مالية أو استثمارية أو تجارية أو أنواع أخرى من النصائح أو التوصيات المقدمة أو المعتمدة من TradingView. اقرأ المزيد في شروط الاستخدام.