OPEN-SOURCE SCRIPT
تم تحديثه RSI Divergence Detector
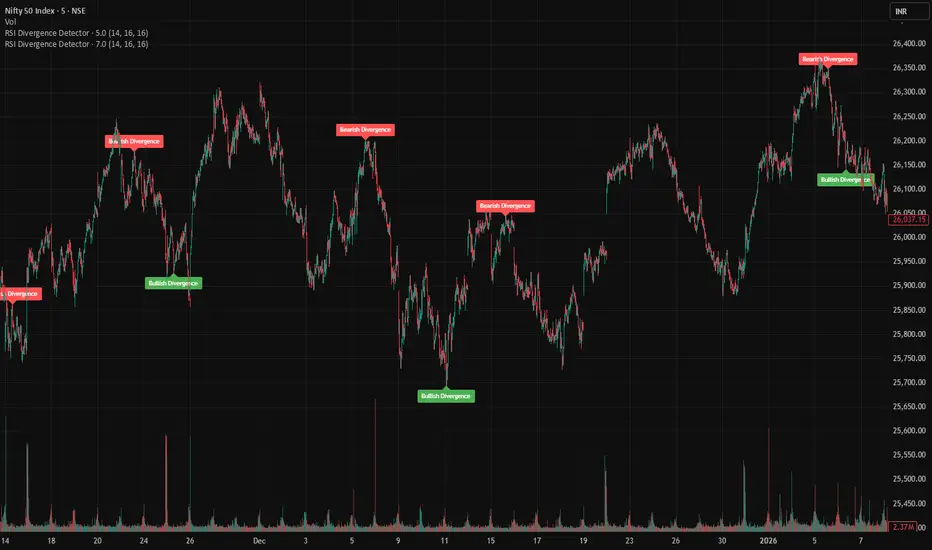
This indicator automatically detects bullish and bearish RSI divergences and displays them directly on the price chart.
A bullish divergence occurs when price forms a lower low while RSI forms a higher low, which may indicate weakening bearish momentum and a potential upward reversal.
A bearish divergence occurs when price forms a higher high while RSI forms a lower high, which may signal weakening bullish momentum and a possible downward reversal.
The script uses pivot highs and lows on both price and RSI to identify confirmed divergences and plots labels on the chart when they occur.
Inputs
RSI Length – period used to calculate RSI
Pivot Left Bars – bars required on the left to confirm a pivot
Pivot Right Bars – bars required on the right to confirm a pivot
Because pivots require confirmation, signals appear after several bars.
A bullish divergence occurs when price forms a lower low while RSI forms a higher low, which may indicate weakening bearish momentum and a potential upward reversal.
A bearish divergence occurs when price forms a higher high while RSI forms a lower high, which may signal weakening bullish momentum and a possible downward reversal.
The script uses pivot highs and lows on both price and RSI to identify confirmed divergences and plots labels on the chart when they occur.
Inputs
RSI Length – period used to calculate RSI
Pivot Left Bars – bars required on the left to confirm a pivot
Pivot Right Bars – bars required on the right to confirm a pivot
Because pivots require confirmation, signals appear after several bars.
ملاحظات الأخبار
Updateملاحظات الأخبار
updatesملاحظات الأخبار
updateملاحظات الأخبار
updatesملاحظات الأخبار
update: added alertنص برمجي مفتوح المصدر
بروح TradingView الحقيقية، قام مبتكر هذا النص البرمجي بجعله مفتوح المصدر، بحيث يمكن للمتداولين مراجعة وظائفه والتحقق منها. شكرا للمؤلف! بينما يمكنك استخدامه مجانًا، تذكر أن إعادة نشر الكود يخضع لقواعد الموقع الخاصة بنا.

إخلاء المسؤولية
لا يُقصد بالمعلومات والمنشورات أن تكون، أو تشكل، أي نصيحة مالية أو استثمارية أو تجارية أو أنواع أخرى من النصائح أو التوصيات المقدمة أو المعتمدة من TradingView. اقرأ المزيد في شروط الاستخدام.
نص برمجي مفتوح المصدر
بروح TradingView الحقيقية، قام مبتكر هذا النص البرمجي بجعله مفتوح المصدر، بحيث يمكن للمتداولين مراجعة وظائفه والتحقق منها. شكرا للمؤلف! بينما يمكنك استخدامه مجانًا، تذكر أن إعادة نشر الكود يخضع لقواعد الموقع الخاصة بنا.
إخلاء المسؤولية
لا يُقصد بالمعلومات والمنشورات أن تكون، أو تشكل، أي نصيحة مالية أو استثمارية أو تجارية أو أنواع أخرى من النصائح أو التوصيات المقدمة أو المعتمدة من TradingView. اقرأ المزيد في شروط الاستخدام.