مؤشر

مؤشر

مؤشر

مؤشر
SYP Daily SweepTired of drawing the same horizontal lines every single day? Welcome to your new favorite automated setup.
We all know the market is just one big hunt for liquidity. This indicator is specifically designed to map out exactly where the "Smart Money" is looking, turning your chart into a literal roadmap for high-probability setups. Stop guessing, start printing! 🖨️💵✨
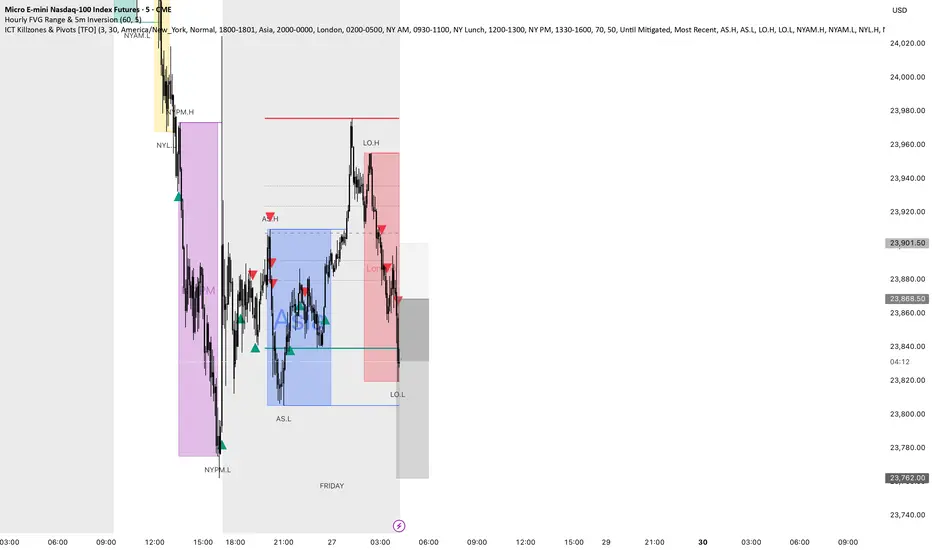
Here is what this all-in-one toolkit does for you automatically every day at UTC 00:00 (Daily Open):
🔥 CORE FEATURES
1. True FRVP POC (Point of Control) with Volume Data
Forget basic close-price calculations. We built a custom Fixed Range Volume Profile (FRVP) engine that distributes the previous day's volume across the entire high-to-low range. It plots a crisp white line starting from yesterday's open directly to the current price action, showing you exactly where the heaviest volume was traded (Complete with the actual volume number label!). When price approaches this level, pay attention.
2. Automated PDH & PDL (Previous Daily High/Low)
Previous daily extremes are massive magnets for price. This script plots the PDH and PDL perfectly, starting right from the exact candle that formed them, giving you clean, distraction-free charts.
3. Liquidity Sweep Detection (The Secret Sauce 🧪)
Did yesterday's candle sweep the day before yesterday's high or low? If yes, the script automatically plots the "Bullish Sweep" or "Bearish Sweep" levels. These are prime locations to look for nasty traps and explosive reversals.
4. Major Trading Session Killzones
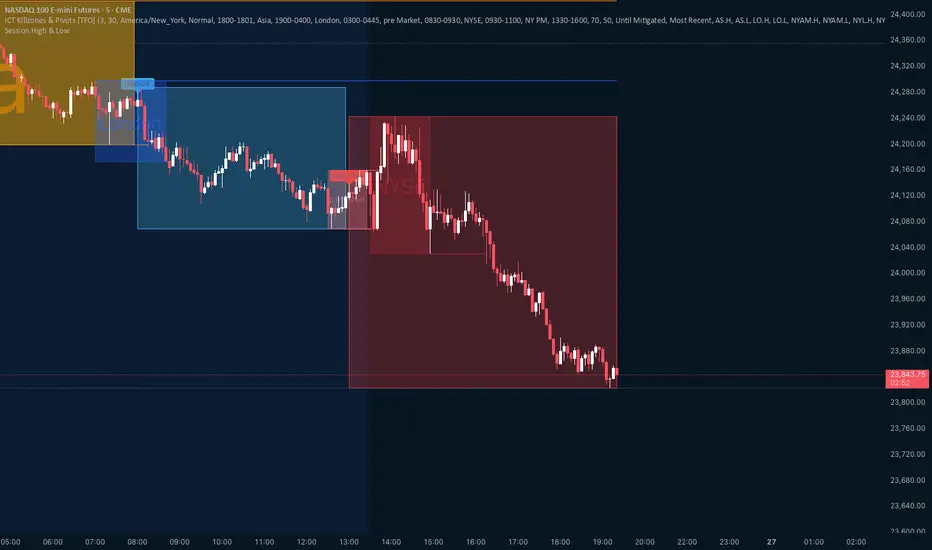
Asian, London, and New York sessions are beautifully highlighted with background boxes. Know exactly when the volatility is about to step into the market. (Fully customizable times and colors in the settings).
5. Daily Session Separators
Clean dashed vertical lines to separate your trading days visually.
💡 HOW TO USE THIS PRINTER:
Wait for London or NY session volume to kick in.
Look for price to interact with the PDH/PDL or our True POC.
Did we just hit a Liquidity Sweep level? Watch for a lower timeframe market structure shift or FVG.
Execute, manage your risk, take profit, and enjoy your day. 🍹
This indicator is built for day traders, scalpers, and SMC/ICT enthusiasts who want to keep their charts clean but insanely informative.
Drop a Boost 🚀 if this script helps you catch those easy setups! مؤشر

مؤشر

مؤشر
مؤشر

مؤشر

مؤشر

مؤشر

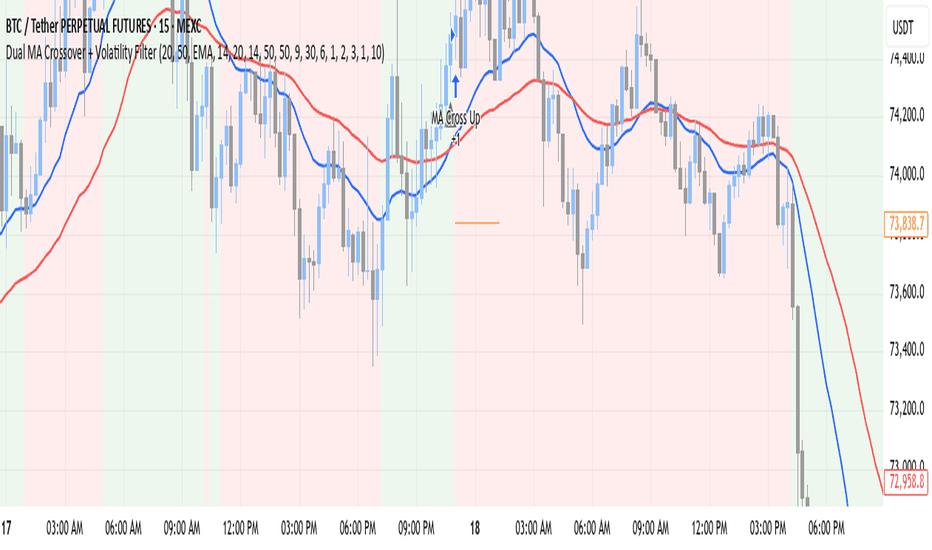
Dual MA Crossover + Volatility FilterOverview
The Dual MA Crossover + Volatility Filter is a comprehensive, trend-following framework designed primarily for futures and high-liquidity assets. Unlike standard moving average strategies that suffer during "choppy" or sideways markets, this system employs a multi-layered filtering process to ensure trades are only taken when momentum, volatility, and timing are in alignment.
Core Logic
The strategy triggers a signal when a Fast Moving Average crosses a Slow Moving Average. However, the signal must pass through three distinct "gates" before an order is executed:
Volatility Expansion Filter (ATR): Compares a short-term ATR against a longer-term baseline. Entries are only permitted when current volatility is higher than the baseline, signaling that a "breakout" or strong trend is likely beginning.
Momentum Filter (RSI): Confirmation of the trend's strength. Longs are only taken if RSI is above a user-defined threshold (default 50), ensuring we are not buying a "dead cat bounce."
Session Time Filter: Specifically designed for intraday traders. It allows users to skip the initial market "noise" (e.g., the first 30 minutes of the NY open) before allowing entries.
Key Features
Dynamic Risk Management: Automatically calculates position size based on a fixed percentage of account equity and the current ATR-based stop distance.
Smart Exit Logic: * Initial Stop: Set at a multiple of ATR from entry.
Breakeven Trigger: Moves the stop to entry price once the trade reaches a user-defined "R" (Risk) multiple.
Trailing Stop: Activates a trailing ATR-stop only after the breakeven trigger is hit, protecting profits during extended trends.
Time Stop: Closes the position if the market fails to make a new High (long) or Low (short) within a specific number of bars.
Futures Optimized: Includes built-in point value calculations for major contracts like ES, NQ, RTY, CL, and GC.
How to Use
Select MA Type: Choose between EMA, SMA, WMA, or HMA based on your preference for speed vs. lag.
Adjust Volatility Filter: If the strategy is too selective, increase the ATR Comparison Length.
Risk Settings: Set your Risk Percent per Trade (e.g., 1.0% for conservative trading).
Time Filter: On intraday charts (1m, 5m, 15m), set the Bars to Skip to avoid the opening volatility.
Disclaimer
This script is for educational and backtesting purposes only. Past performance does not guarantee future results. Trading futures and equities involves significant risk of loss استراتيجية
مؤشر

Multi Timeframe Fractal Map [Herman]Multi Timeframe Fractal Map
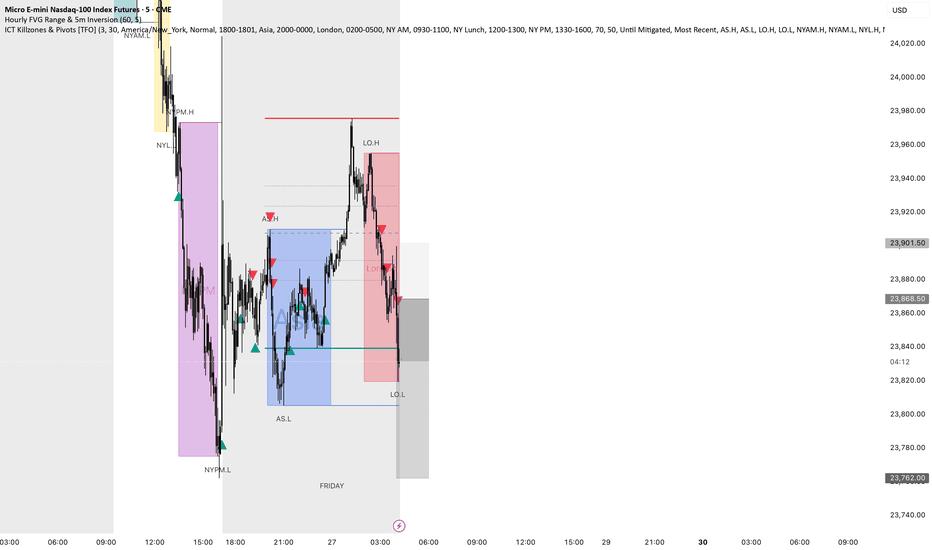
This script is a multi-timeframe chart-reading framework that evaluates how the current candle interacts with the previous candle’s range across several timeframes, then combines that higher-timeframe context with intermarket comparison, structural execution levels, and session reference prices on one chart.
The core concept behind the script is a range interaction and acceptance/rejection model:
first, higher timeframe candles are reconstructed on the active chart,
then the current higher timeframe candle is compared with the previous higher timeframe candle,
then the script evaluates whether price is accepting expansion beyond that prior range or rejecting it,
then correlated markets are checked for confirmation or divergence,
and only after that are lower timeframe structural levels used for execution reference.
The script does not generate automated buy/sell orders.
Its purpose is to organize context first and execution second.
Why these components are combined
In discretionary intraday trading, traders often read:
higher timeframe structure on one chart,
range interaction and liquidity events on another,
intermarket confirmation separately,
execution levels on lower timeframes,
and session anchors such as PDH/PDL or Daily Open somewhere else.
This separation can lead to inconsistent interpretation.
This script combines these elements because each one evaluates a specific stage of price behavior: range interaction defines direction, intermarket comparison evaluates confirmation, and lower-timeframe structure is only used after that context is established.
The intended order is:
define higher timeframe structure,
classify current interaction with the previous higher timeframe range,
check whether correlated markets confirm or diverge,
establish current price location using reference levels,
use lower timeframe structural levels only after that context is already defined.
For that reason, the script is not intended as a group of unrelated tools. Each part is included to evaluate a different stage of the same chart-reading process.
1) Higher timeframe candle reconstruction
The script reconstructs multiple higher timeframe candles directly on the active chart.
For each selected higher timeframe, it maintains rolling values for:
open,
high,
low,
close,
and time.
These values are built dynamically from lower timeframe data, so the candles update while they are still forming.
This allows the script to show:
the current developing HTF candle body and wick,
prior completed HTF candles,
current HTF range expansion,
and countdown information for the active HTF candle.
The purpose of reconstruction is to keep higher timeframe structure visible on the execution chart instead of requiring the user to switch layouts.
2) Higher timeframe range interaction model
For each selected higher timeframe, the script compares the current candle with the previous candle’s range.
Using the previous candle as C1 and the current candle as C2, it evaluates:
sweep high when C2 high exceeds C1 high,
sweep low when C2 low breaks below C1 low.
It then evaluates where C2 closes relative to C1:
close above C1 high = acceptance above the prior range,
close below C1 low = acceptance below the prior range,
sweep without close beyond the boundary = rejection / failed expansion.
If neither side is swept, or if both sides are swept without clear directional acceptance, the state is treated as neutral.
This classification defines whether price is:
expanding and being accepted,
expanding but being rejected,
or not interacting with the prior range in a meaningful way.
3) Candle progression logic (Candle 2 / Candle 3)
The script evaluates sequential HTF candle behavior.
Candle 2
A Candle 2 condition is identified when:
the previous candle has a defined direction,
the current candle interacts with the prior extreme (high or low),
and the current candle closes back through or beyond that level.
This marks a potential reversal attempt.
Candle 3
A Candle 3 condition requires:
a valid prior Candle 2,
directional continuation,
and a close condition relative to the prior range (configurable strength).
This marks follow-through after the initial reaction.
The purpose of this progression is to distinguish between:
an initial reaction at a level,
and confirmed expansion following that reaction.
4) HTF classification table
The classification table summarizes the same range interaction logic across all active higher timeframes.
For each timeframe, the script uses:
C2 high, low, close,
and C1 high, low.
Classification rules:
LONG → C2 closes above C1 high
SHORT → C2 closes below C1 low
AVOID → all other cases, including:
both sides swept,
no sweep,
sweep without acceptance.
This output is deterministic and reflects current HTF behavior.
A combined bias is calculated by counting agreement across timeframes.
It summarizes alignment, not prediction.
5) Intermarket comparison (SMT)
The script compares correlated index markets to evaluate confirmation or divergence.
General conditions:
bearish divergence → one market forms a higher high while another does not confirm,
bullish divergence → one market forms a lower low while another does not confirm.
This comparison is aligned with the same reconstructed HTF structure.
Its purpose is to evaluate whether a move is supported across markets or shows relative weakness.
6) Sweep visualization
The script highlights sweep behavior directly on higher timeframe candles.
A sweep occurs when price moves beyond a previous HTF high or low.
The subsequent close determines whether that move is accepted or rejected.
This is part of the same range interaction model and is not a separate signal.
7) CISD structural execution levels
CISD levels are derived from changes in candle direction on lower timeframes, using the open price of the candle where the directional shift occurs.
The script tracks these levels as:
pending → identified but not yet confirmed,
confirmed → price closes beyond the level.
These levels represent local structure and are intended for execution reference only after higher-timeframe context is established.
For example, if a higher timeframe shows acceptance above the previous range and correlated markets confirm the move, a CISD break in that direction can be used as execution alignment.
8) HTF imbalance (FVG)
The script evaluates imbalance using non-overlapping price ranges:
bullish imbalance → earlier high is below a later low,
bearish imbalance → earlier low is above a later high.
If price trades back through the zone, it is considered invalidated.
These zones are shown in the context of reconstructed HTF candles.
9) Reference levels (location)
The script plots:
Previous Day High / Low,
Previous Day midpoint (50%),
Daily Open,
Midnight Open,
4H Open.
These levels define location only and are not used for directional classification.
10) Optional time segmentation
The script can divide the session into fixed time blocks and track their high and low.
This allows observation of:
compression,
expansion,
and failed expansion
within repeated time intervals.
How to use the script
The script is intended to be used in sequence:
Observe higher timeframe candles to define structure.
Evaluate how the current candle interacts with the previous HTF range.
Determine whether expansion is accepted or rejected.
Check intermarket comparison for confirmation or divergence.
Review multi-timeframe classification for alignment.
Use reference levels to determine location.
Use CISD levels for execution only if higher-timeframe context is aligned.
Lower timeframe signals should not be used independently.
Intended use
This script is intended for traders who:
use multi-timeframe analysis,
focus on range interaction and structural behavior,
use intermarket comparison as context,
and require structured decision-making on one chart.
Not intended as
an automated trading system,
a standalone signal generator,
or a guarantee of future performance.
Credits
Portions of the higher timeframe candle reconstruction were adapted from open-source work by Çağrı Dikici and are used with permission.
Disclaimer
This script is provided for analytical and educational purposes only.
It does not constitute financial or investment advice.
All trading involves risk. مؤشر

مؤشر

مؤشر
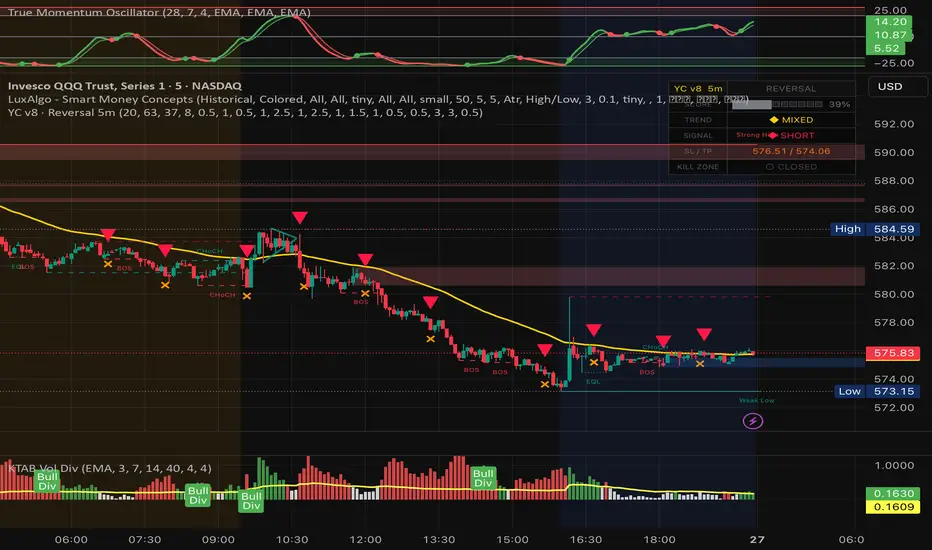
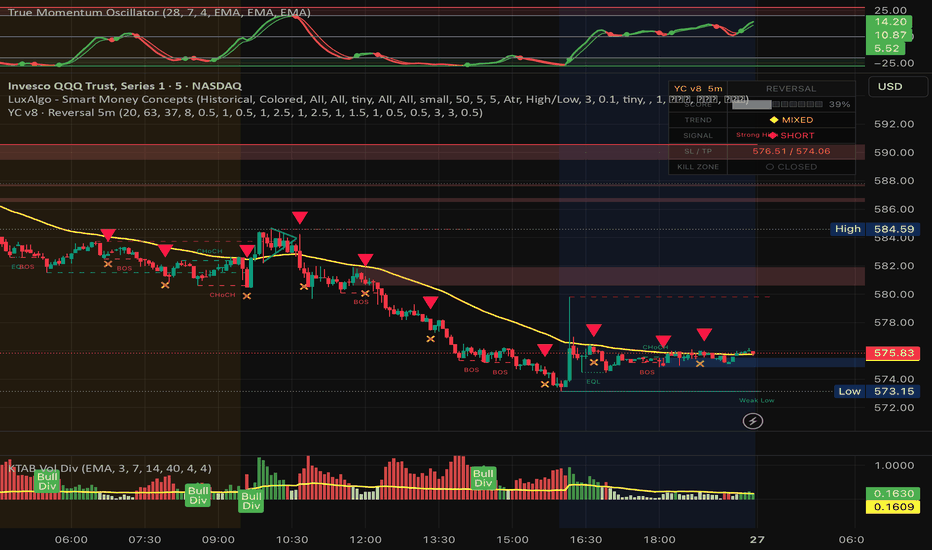
KT v8 Reversal 5ms_scalp = input.bool(true, "Scalp Mode (off = Swing)", group=grp_mode)
show_emas = input.bool(true, "Show EMAs", group=grp_mode)
show_signals = input.bool(true, "Show Entry Signals", group=grp_mode)
show_exit = input.bool(true, "Show Exit Marks", group=grp_mode)
show_trail = input.bool(true, "Show Trailing SL Line", group=grp_mode)
show_tp_sl = input.bool(true, "Show TP/SL Labels", group=grp_mode)
show_sr = input.bool(true, "Show S/R Exit Lines", group=grp_mode)
sr_lookback = input.int(20, "S/R Lookback (bars)", group=grp_mode, minval=5, maxval=100)
buy_thr = input.float(63.0, "Buy Threshold (0-100)", group=grp_mode, minval=51, maxval=95, step=1)
sell_thr = input.float(37.0, "Sell Threshold (0-100)", group=grp_mode, minval=5, maxval=49, step=1)
cooldown_bars = input.int(8, مؤشر
مؤشر

Fractal Support and Resistance Zones EngineFractal Support and Resistance Zones Engine is a market structure tool built to convert confirmed fractal pivots into filtered support, resistance, and S/R flip zones.
The main reason this script was created is practical rather than theoretical. Fractal highs and lows are already a familiar market structure concept, but many fractal-based tools become difficult to use once they start filling the chart with too many overlapping levels. When every pivot is treated as equally important, the result is often visual clutter, weak prioritization, and little help in deciding which areas still matter around current price.
This script was written to make that process more usable. Instead of simply marking fractal pivots, it manages them as zones with a lifecycle. It filters oversized zones, ignores zones that are too far from current price, merges overlapping structure, tracks repeated interaction, handles role reversal behavior, removes weak or aging zones, and then selects only the strongest visible candidates for display.
Why this indicator exists
This script does not claim to introduce a new theory of support and resistance. Its purpose is to provide a more structured implementation of a familiar concept.
The problem it tries to solve is straightforward:
raw fractal levels can accumulate too quickly,
overlapping levels can make the chart harder to read,
old or weak zones can remain on screen longer than they are useful,
and many simple fractal tools do not do much after the initial pivot is detected.
This indicator was built to address those issues by treating zones as dynamic objects instead of static drawings. Once a zone is created, it is managed over time based on interaction, break behavior, age, visibility ranking, and proximity to price.
That is the main reason the script was written. It is not meant to replace all support and resistance methods. It is meant to make fractal-based structure more organized and more practical to work with.
What the indicator does
The script detects confirmed fractal highs and lows using left and right pivot bars.
A confirmed pivot high can create a resistance zone.
A confirmed pivot low can create a support zone.
There is also an optional developing zone mode. When enabled, the script can show provisional zones before full pivot confirmation. These are intentionally temporary and may disappear if price invalidates them before confirmation.
After a zone is created, the script does not simply leave it untouched. It keeps evaluating that zone and updates its status over time.
The script can display three structural categories:
Resistance zones
Support zones
S/R flip zones, when a previously broken zone changes role
How the script works
The engine begins with fractal pivot detection.
For resistance, the zone is built from the pivot high area.
For support, the zone is built from the pivot low area.
From there, several control layers are applied:
1) ATR-based size control
Zone height is capped by an ATR multiple so unusually large candle ranges do not create oversized zones that dominate the chart. This helps keep zones more comparable and visually usable.
2) Minimum significance and maximum distance filtering
A new zone must still meet a minimum size requirement relative to ATR, and it must remain within the configured distance from current price. This prevents the script from storing zones that are either too small to matter or too far away to be useful in the current context.
3) Overlap and merge logic
If a newly detected zone overlaps with an existing one, the script does not always draw another separate zone. When the roles match, it can reinforce and blend the existing zone rather than duplicating structure. This is one of the main anti-clutter mechanisms in the script.
4) Touch tracking
Zones gain interaction history when price returns to them from outside and touches them again. This interaction history later contributes to ranking and lifecycle decisions. A zone that has been respected multiple times is treated differently from a fresh zone that has never been retested.
5) Break and S/R flip handling
When price breaks beyond a zone by a configurable ATR-based threshold, the script can treat that as a structural break. If retest confirmation is enabled, the zone does not immediately change role. Instead, it enters a waiting state and only flips after the retest condition is satisfied. If retest confirmation is disabled, the role change happens immediately on the break condition. This gives the user a choice between faster reaction and stricter confirmation.
6) Flip count and removal behavior
Zones are not allowed to survive forever in the same way. The script tracks flip count and interaction history. If a zone has already flipped multiple times, it can eventually be removed instead of continuing to recycle indefinitely. This prevents heavily reused or degraded structure from staying on the chart forever.
7) Age-based pruning
Zones are also removed as they get older. Stronger zones can survive longer because the lifespan is adjusted by interaction and flip history, but aging still matters. This helps the chart focus more on structure that is still relevant.
8) Spatially aware pool management
The script keeps a limited zone pool depending on the selected performance mode. When the internal pool gets too large, weaker zones are evicted using a score that considers relevance and local crowding. In practice, this means the engine is not only adding zones, but also actively managing what deserves to stay in memory.
9) Visibility ranking
The script scores zones using interaction history, flip history, distance from current price, and age. It then selects only the top visible resistance, support, and flip zones rather than showing everything at once. This is a key part of the workflow because the script is designed to prioritize readability, not maximum historical coverage.
What makes it different from simpler fractal indicators
The main difference is not the use of fractals themselves. Fractals are well known. The difference is what happens after the fractal is detected.
Many simpler scripts stop at the first step: they identify the pivot and draw a level or box.
This script continues beyond that step by adding:
zone size control,
distance filtering,
overlap management,
touch-based reinforcement,
optional retest-confirmed flips,
flip counting,
age-aware removal,
spatial eviction when the zone pool becomes crowded,
and visibility ranking so only the strongest nearby zones are shown.
That combination is the real distinguishing feature of the script.
It is not just a fractal marker. It is a fractal-based zone management engine.
Was this script really necessary?
In the strictest sense, the underlying market idea is not new. Fractal pivots, support, resistance, and role reversal are all established concepts.
So if the question is whether this script introduces a brand-new trading theory, the honest answer is no.
But that is not the reason it exists.
The reason it exists is that there is practical value in taking a familiar concept and implementing it in a cleaner, more selective, and more manageable way. A trader who already uses fractal structure may not need another script that simply draws more levels. What may still be useful is a script that helps reduce clutter, maintain zone quality, and keep attention on the strongest nearby structure.
That is the point of this indicator.
So the honest answer is:
it was not necessary as a new theory,
but it can be useful as a more organized implementation of fractal-based support and resistance.
That is the real justification for the script.
Inputs and behavior
The script includes a small set of controls that shape how selective or lightweight the engine becomes.
Strategy changes how strict the filtering logic is. Conservative settings keep fewer zones and require stricter behavior. Aggressive settings allow more zones and looser filtering.
Performance controls how many zones can be tracked internally. Lighter modes reduce tracking load, while fuller modes allow broader detection.
Top Resistance Zones, Top Support Zones, and Top S/R Flip Zones limit how many ranked zones are actually shown.
Pivot Left Bars and Pivot Right Bars control fractal confirmation.
Max Zone Height (ATR) caps zone height.
Merge Sensitivity changes how aggressively nearby zones are combined.
Max Age controls the base lifespan of zones before age pruning removes them.
Require Retest for Flip changes whether role reversal happens immediately after a qualified break or waits for a retest.
Show Developing Zones enables early provisional zones before full confirmation. Because these are not fully confirmed yet, they may disappear.
Left Extension, Box Length, labels, colors, and the optional info panel control the visual presentation.
Alerts and chart workflow
The script provides alerts for:
new resistance zones,
new support zones,
S/R flips,
and zone breaks.
A practical workflow is to use the indicator to monitor the strongest nearby structural zones, then combine those zones with your own trend analysis, execution criteria, risk plan, or broader market context.
Important notes
This is a structural analysis tool. It does not predict price, guarantee reversals, or guarantee trade outcomes.
Confirmed fractal pivots appear only after the required right-side confirmation bars exist, so confirmed zones naturally appear with that built-in confirmation delay. If developing zones are enabled, the script may show temporary structure earlier, but those developing zones can disappear if price invalidates them before full confirmation.
Because of that, this indicator is best used as a framework for organizing price structure rather than as a standalone trade system. مؤشر

مؤشر

مؤشر

مؤشر

مؤشر