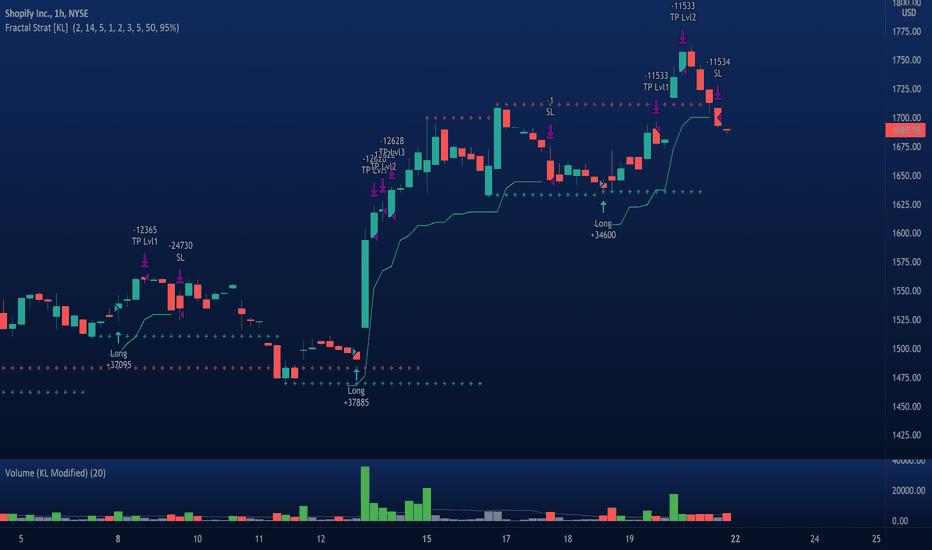
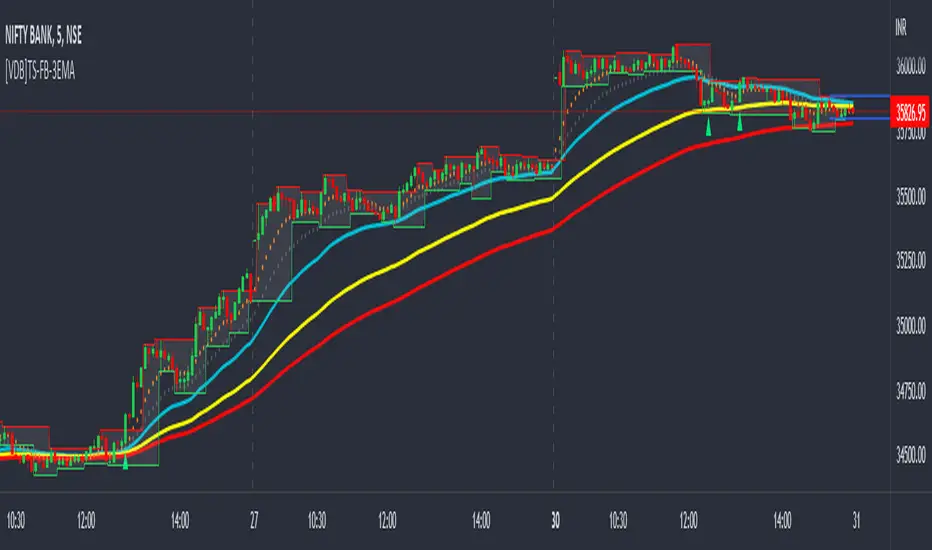
استراتيجية

مؤشر

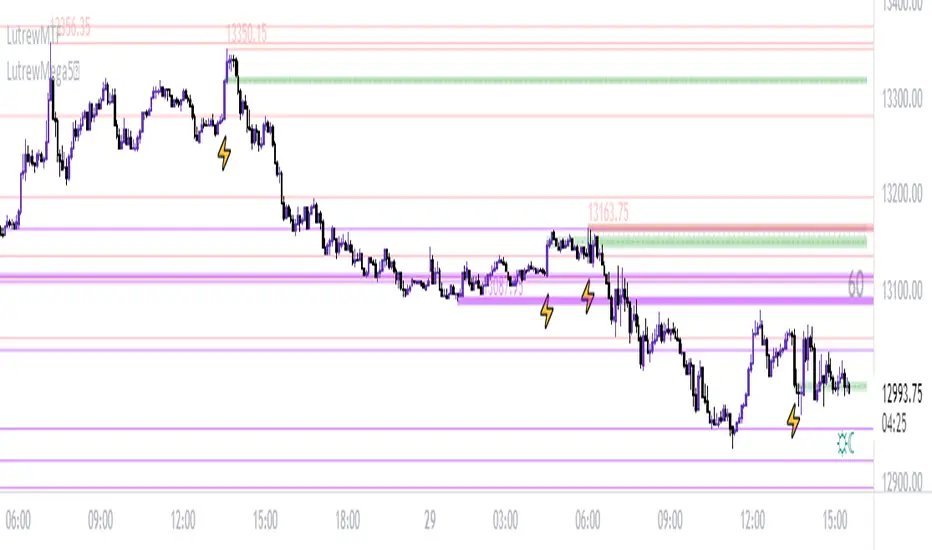
LutrewMTF// ————— Plots
var cMarkerUp = color.new(color.lime, 0)
var cMarkerDn = color.new(color.red, 0)
plotshape(A1U, "Marker 1 Up", shape.triangleup, location.belowbar, cMarkerUp, size = size.tiny, text = "1")
plotshape(A2D, "Marker 2 Dn", shape.triangledown, location.abovebar, cMarkerDn, size = size.tiny, text = "2")
plotshape(A3U, "Marker 3 Up", shape.triangleup, location.belowbar, cMarkerUp, size = size.tiny, text = " 3")
plotshape(A4D, "Marker 4 Dn", shape.triangledown, location.abo مؤشر

مؤشر

مؤشر
مؤشر

مؤشر

استراتيجية
مؤشر

مؤشر

مؤشر

مؤشر

مؤشر

مؤشر

مؤشر

مؤشر

مؤشر
مؤشر

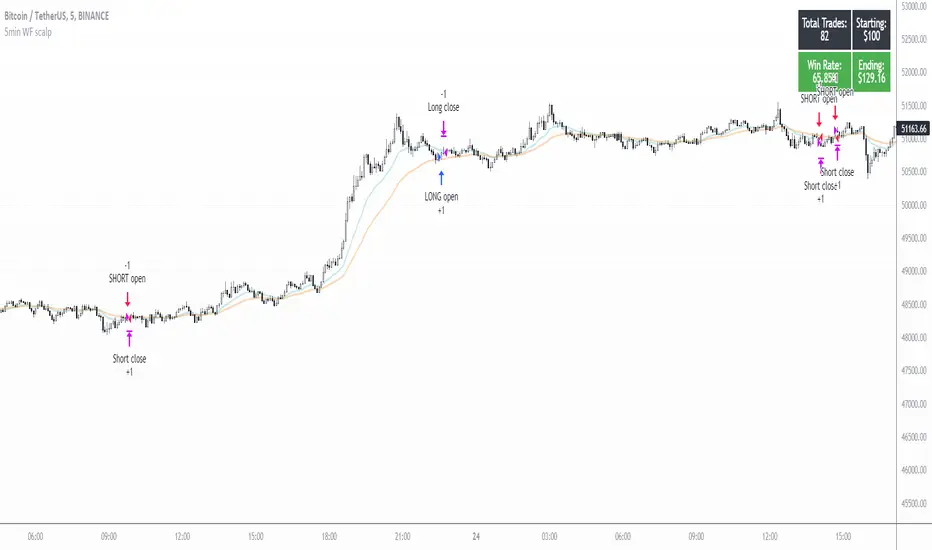
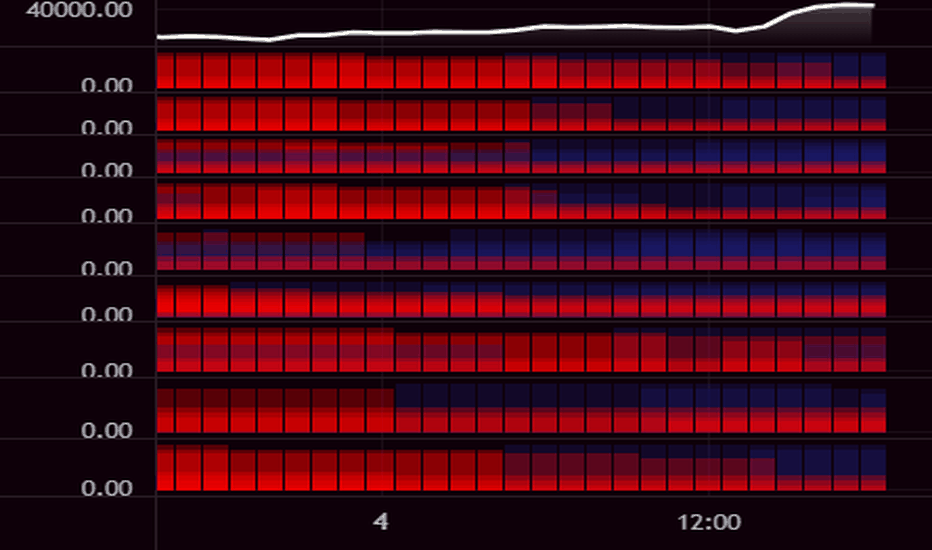
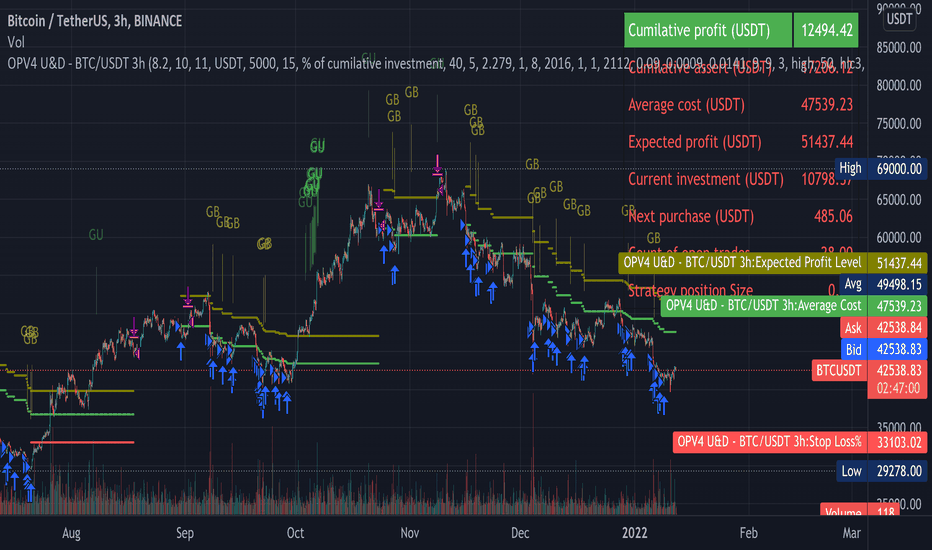
Up & Down Trend following trading strategy for BTC/USDT 3hThis strategy is based on multi time frame technical indicators such as;
1. RSI (10,50,100)
2. MFI (10,50,100)
3. RVI (10,50,100)
4. BOP (10,50,100)
5. Super Trend
6. SAR indicator
7. Higher highs and lower lows
8. SMA (9,500)
9. EMA (9,200)
After evaluating different parameters provided by those indicators, script is in a possition to determine optimul positions to enter in to market as well as exit from the market. In some cases stratergy will exit fully or partially depends on the situatio استراتيجية
استراتيجية

مؤشر

مؤشر

مؤشر

استراتيجية