مؤشر

AlligatorFlex Reversal Engine
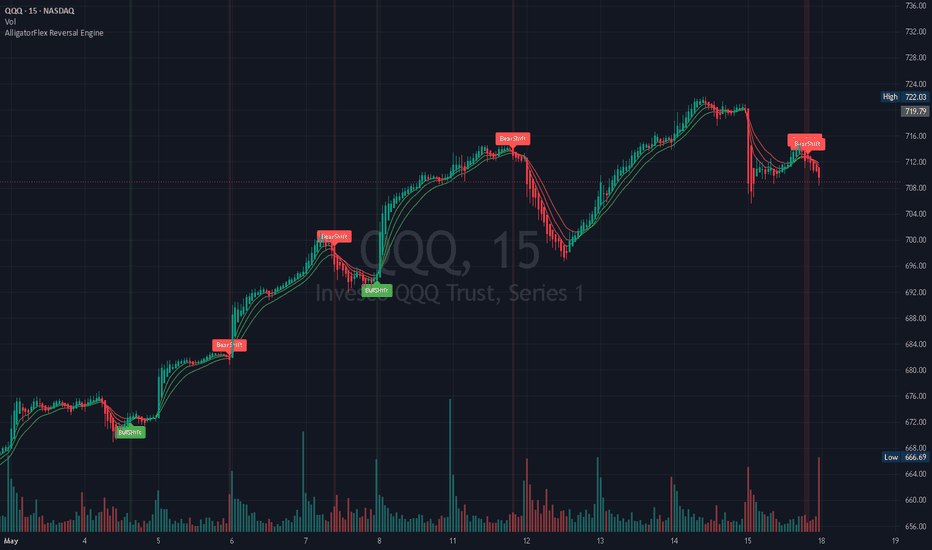
AlligatorFlex Reversal Engine detects potential early trend-shift conditions using modified Alligator structure, line slope, volume expansion, and range confirmation.
NASDAQ:QQQ
AlligatorFlex Reversal Engine is a modified Alligator-style indicator designed to identify potential early trend-shift conditions using slope, volume, and price-range validation.
Unlike a traditional Alligator indicator that only plots trend structure, AlligatorFlex adds confirmation filters to highlight moments where the market may be transitioning from one directional state to another.
The indicator uses three EMA-based Alligator lines:
- Jaw: slower structure line
- Teeth: medium structure line
- Lips: faster structure line
Each line changes color based on its current slope, allowing traders to quickly visualize whether the internal structure is pushing upward or downward.
Signal validation includes:
- All three Alligator lines must show directional slope.
- Current volume must exceed the average volume by a user-defined multiplier.
- The recent price range must expand beyond its average range.
- Line structure must meet the required alignment condition.
A LONG signal appears when the Alligator structure is still positioned in a bearish alignment, but all three lines are rising with strong volume and range expansion. This can suggest a possible bullish reversal or early recovery attempt.
A SHORT signal appears when the structure is still positioned in a bullish alignment, but all three lines are falling with strong volume and range expansion. This can suggest a possible bearish reversal or early rejection.
This makes the indicator useful for traders looking for possible transition zones, reversal pressure, momentum shifts, and early directional expansion.
Best used with:
- Higher timeframe trend context
- VWAP
- Support and resistance
- Market structure
- Volume analysis
- Breakout or reclaim setups
AlligatorFlex Reversal Engine helps traders detect potential early market shifts by combining a modified Alligator structure with slope, volume, and range expansion filters.
Instead of only showing moving average lines, the indicator evaluates whether the market is showing enough directional pressure to justify a possible transition signal.
It highlights moments where:
- Alligator lines begin to slope in the same direction
- Volume expands above average
- Price range expands beyond normal conditions
- Structure suggests a possible reversal or directional shift
LONG and SHORT labels are plotted directly on the chart when all confirmation layers align.
The goal of AlligatorFlex is to help traders spot possible early reversal pressure before a fully developed trend becomes obvious.
Jaw Length:
Controls the slowest Alligator structure line.
Teeth Length:
Controls the medium Alligator structure line.
Lips Length:
Controls the fastest Alligator structure line.
Volume Length:
Defines the lookback period used to calculate average volume.
Range Length:
Defines the lookback period used to calculate recent price-range expansion.
Slope Threshold:
Minimum slope required from each Alligator line before a signal can be considered valid.
Volume Multiplier:
Requires current volume to be greater than average volume by the selected multiplier.
Range Multiplier:
Requires the recent price range to expand beyond its average range by the selected multiplier.
Limitations:
- This is a modified Alligator-style indicator, not the classic Williams Alligator.
- Signals are designed for potential early shifts, not confirmed trend continuation.
- Volume filters may behave differently across markets with unreliable or synthetic volume.
- Range expansion can trigger late signals after a move has already started.
- Choppy markets can still produce false signals.
- The indicator does not include stop loss, take profit, or position sizing logic.
Important:
This indicator is not a standalone trading system and does not predict future price movement. It is designed as a visual confirmation tool for identifying potential directional shifts. Signals may fail during choppy, low-liquidity, or range-bound conditions. مؤشر
ALLIGATOR Early Reclaim Signals
Early Trend Shift Alerts Based on Alligator Structure
Early trend-shift alerts based on modified Alligator structure and price reclaim/rejection of the Teeth line.
Alligator Reclaim Signals is a simple trend-structure and price-reclaim indicator based on a modified Alligator-style moving average system.
The indicator plots three dynamic lines inspired by the traditional Alligator concept:
- Jaw: slower baseline
- Teeth: medium structure line
- Lips: faster structure line
Instead of focusing only on trend continuation, this tool looks for potential early shift conditions when price crosses back through the Teeth line while the Alligator structure is still positioned in the opposite direction.
A bullish signal is triggered when the fast, medium, and slow lines are still arranged in a bearish structure, but price closes back above the Teeth line. This may suggest an early recovery attempt or a possible bullish reclaim.
A bearish signal is triggered when the lines are still arranged in a bullish structure, but price closes back below the Teeth line. This may suggest a potential rejection, weakness, or early bearish shift.
This makes the indicator useful for traders who want to monitor possible transition zones, pullback failures, trend shifts, or reclaim setups around the middle Alligator line.
The script also includes built-in alert conditions for both bullish and bearish signals, allowing users to create TradingView alerts when a new Buy or Sell condition appears.
Best used with:
- Trend analysis
- Pullback/reclaim setups
- Breakout confirmation
- Multi-timeframe context
- Support and resistance zones
- Volume or momentum confirmation
Inputs:
Jaw Length:
Controls the slowest structure line. Higher values make the line smoother and slower.
Teeth Length:
Controls the middle structure line used as the main reclaim/rejection trigger.
Lips Length:
Controls the fastest structure line. Lower values make it more sensitive to short-term movement.
Limitations:
- Signals can appear during choppy or sideways market conditions.
- The indicator does not include volume confirmation.
- It does not define stop loss or take profit levels.
- It is not a full trading strategy.
- The script is inspired by the Alligator concept but does not use the classic forward-shifted Williams Alligator calculation.
Important:
This indicator does not predict price movement and should not be used as a standalone trading system. Signals may appear during ranging or choppy markets. Always combine it with proper risk management and additional confirmation. مؤشر

مؤشر
مؤشر

مؤشر

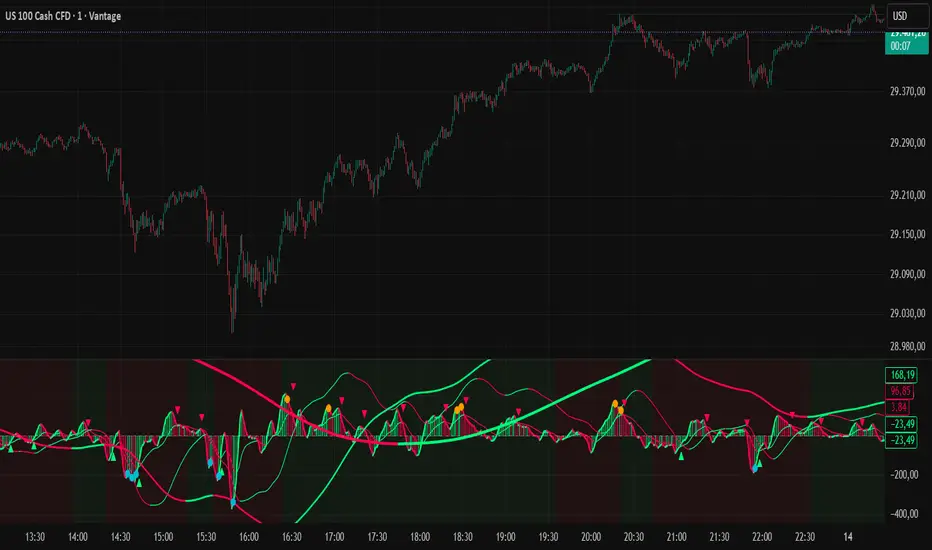
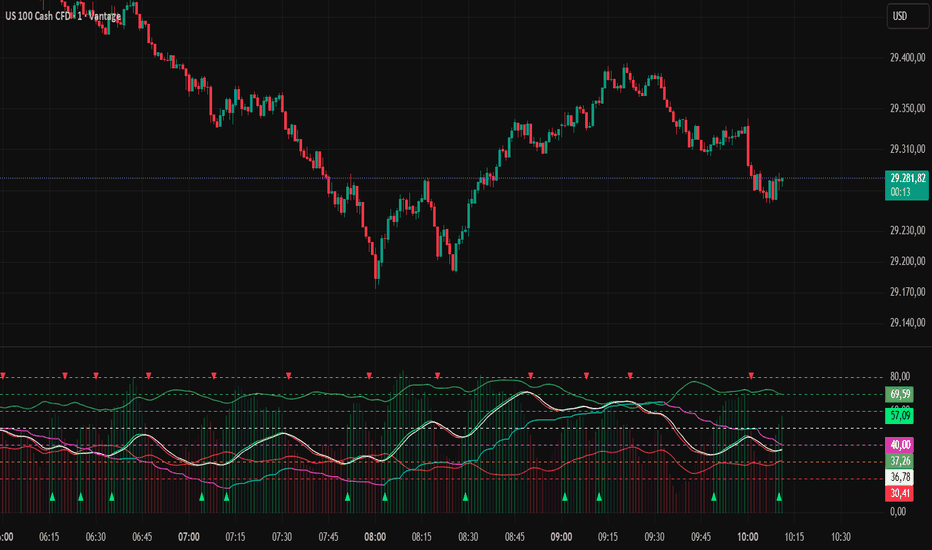
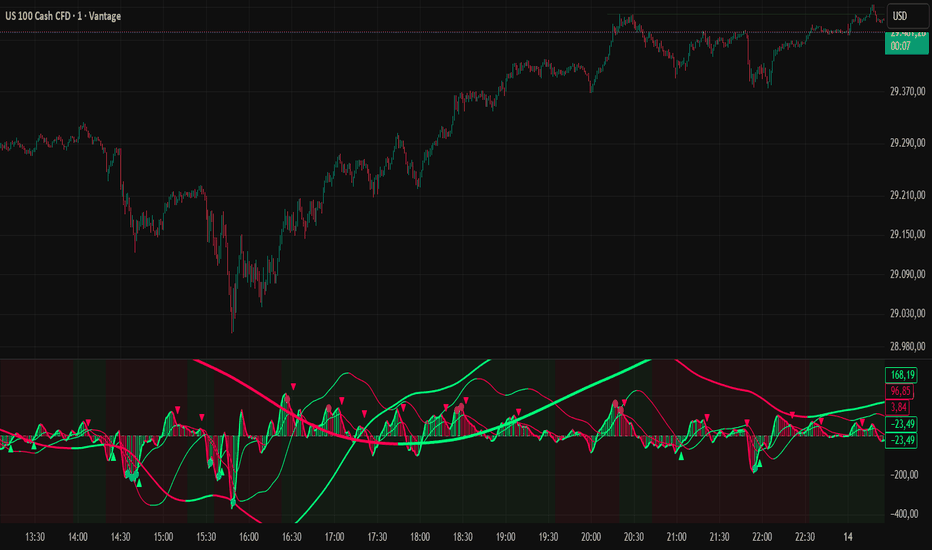
Momentum Bias Index PRO - M1 SWEET SPOTThe original Momentum Bias Index by AlgoAlpha was designed as a general-purpose momentum oscillator for detecting bullish and bearish market pressure. While the original concept worked well for broad market analysis, it was not specifically optimized for the extremely fast and aggressive behavior of NASDAQ on the 1-minute timeframe.
This custom PRO version was completely rebuilt and fine-tuned specifically for NASDAQ M1 scalping and intraday momentum trading.
Instead of measuring only standard momentum, this upgraded version combines:
raw momentum acceleration
EMA flow pressure
directional expansion
adaptive bias smoothing
higher timeframe trend control
into a single institutional-style momentum engine.
Why We Rebuilt the Original
The original version had several limitations when used on NASDAQ M1:
momentum spikes were often too noisy
trend phases were not stable enough
fast reversals created too many false shifts
higher timeframe direction lacked smoothness
momentum strength alone was not enough to measure real market pressure
NASDAQ on the 1-minute chart behaves differently from slower markets. It moves in aggressive liquidity waves, fast momentum expansions, and rapid algorithmic pullbacks.
Because of this, the original oscillator needed a complete restructuring to better detect:
real directional pressure
continuation phases
exhaustion moves
hidden pullbacks
institutional trend flow
What Makes This PRO Version Different
1. Flow Engine Integration
The biggest upgrade is the custom EMA Flow Engine.
The indicator now calculates the pressure difference between fast and slow EMAs and injects this information directly into the momentum calculation.
This creates a much more realistic representation of actual market pressure.
The result:
stronger trend detection
earlier momentum shifts
better continuation signals
cleaner trend structure
2. NASDAQ M1 Sweet Spot Tuning
Every setting was optimized specifically for NASDAQ M1 behavior.
The current tuning focuses on:
ultra-fast reaction speed
controlled smoothing
reduced fake spikes
stable directional bias
high trend responsiveness
This allows the indicator to react early while still filtering a large amount of lower-quality market noise.
3. Smoothed HTF Bias Line
The original higher timeframe logic was redesigned.
Instead of using a raw higher timeframe signal, this version applies additional smoothing to create a stable institutional-style bias filter.
The HTF line now acts as:
a directional trend guide
a trend continuation filter
a pullback confirmation tool
a market state detector
This dramatically improves trend stability during fast NASDAQ sessions.
4. Expansion & Compression Detection
The dynamic average bands now help visualize:
momentum expansion
exhaustion zones
compression phases
pressure imbalance
Strong histogram expansion outside the bands often signals aggressive directional movement, while contraction phases can indicate pullbacks or temporary liquidity pauses.
Advantages Over the Original
Compared to the original Momentum Bias Index, this PRO version offers:
much faster reaction speed
cleaner trend continuation behavior
better NASDAQ adaptation
stronger institutional flow detection
smoother higher timeframe direction
reduced market noise
more stable pullback structure
earlier momentum transitions
improved momentum expansion detection
Best Use Cases
This indicator was specifically designed for:
NASDAQ M1 scalping
intraday momentum trading
trend continuation setups
pullback entries
higher timeframe bias filtering
liquidity expansion detection
It performs especially well during:
New York Open
NASDAQ momentum sessions
breakout environments
trend continuation phases
Final Concept
This is no longer just a standard momentum oscillator.
It has evolved into a hybrid momentum-flow engine that combines:
directional bias
momentum acceleration
EMA pressure flow
higher timeframe structure
dynamic expansion analysis
into one highly responsive NASDAQ M1 trading tool.
The goal was simple:
Create a cleaner, faster, and more institutionally aligned version of the original Momentum Bias Index specifically for high-speed NASDAQ trading. مؤشر

استراتيجية
مؤشر
استراتيجية

استراتيجية

مؤشر

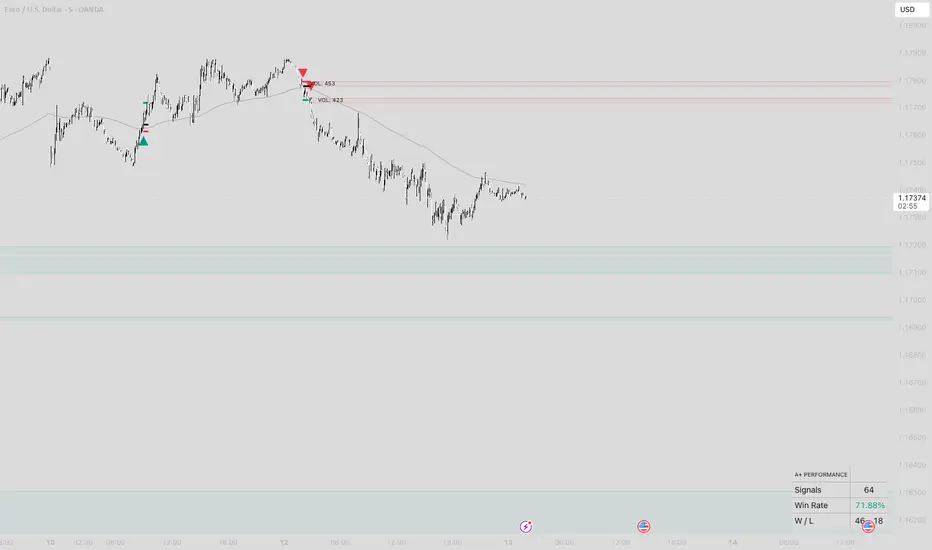
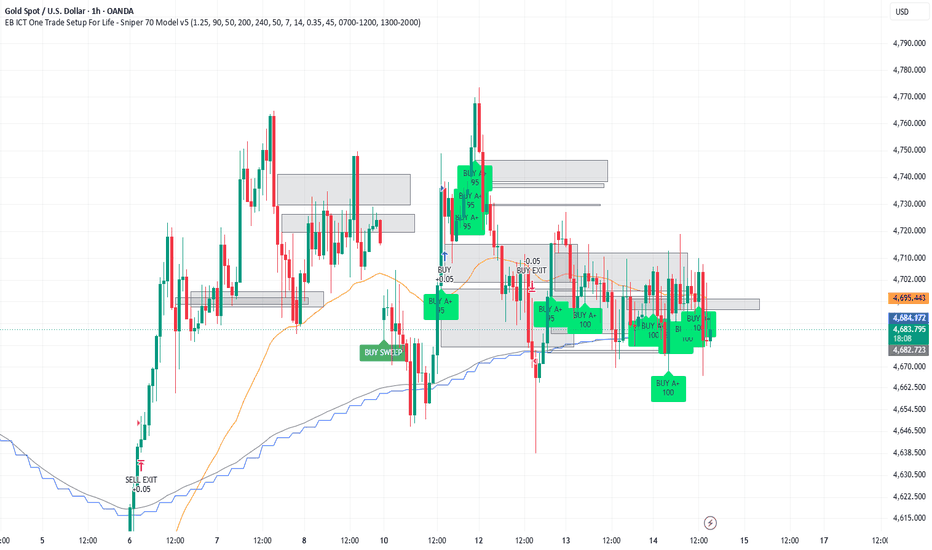
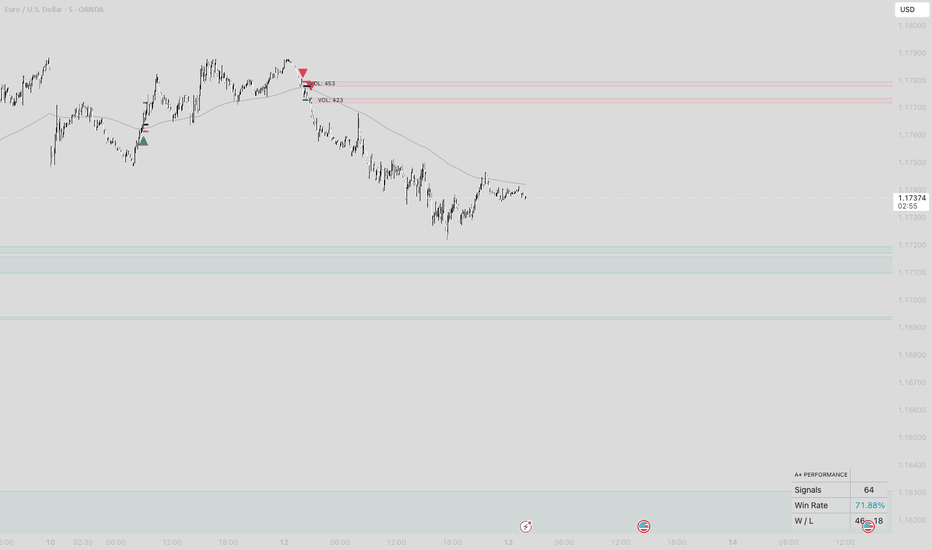
A+ Supply & DemandThe “A+ Supply & Demand” indicator is a high-probability institutional trading tool designed to identify only the strongest market zones with the highest potential for profitable reactions. It combines advanced supply and demand logic, trend confirmation, liquidity analysis, and automated risk management into one complete TradingView system.
The indicator detects powerful institutional supply and demand zones by analyzing aggressive price displacement and volatility using ATR-based filtering. Only high-quality zones created by strong buying or selling pressure are displayed, helping traders avoid weak or low-probability setups.
To improve accuracy, the system includes a 200 EMA trend filter that aligns trades with the dominant market direction. Demand zones are prioritized during bullish trends, while supply zones are prioritized during bearish trends, increasing the probability of successful entries.
A built-in liquidity and volume strength system estimates how much institutional activity and remaining liquidity exist inside each zone. Stronger zones are visually highlighted using volume-based scoring, color intensity, and liquidity labels, making it easier to identify where large unfilled orders may still be present. Zones that become partially mitigated automatically lose liquidity strength over time.
The indicator also provides complete trade execution planning:
* Automatic entry signals on the first retest of fresh zones
* Dynamic stop losses placed beyond previous swing highs/lows with ATR safety buffers
* Accurate take profit targets based on true risk distance
* Configurable Risk:Reward ratios (default 1:2)
For performance tracking, the indicator includes a live dashboard displaying:
* Total trades
* Win rate
* Wins and losses
* Active setup statistics
Additional visual enhancements include:
* Entry, stop loss, and take profit plotting
* Zone transparency based on liquidity strength
* Retest/touch tracking
* Automatic removal of invalid or mitigated zones
The goal of the indicator is to help traders focus exclusively on A+ institutional setups by combining trend alignment, liquidity analysis, displacement strength, and precision risk management into a clean and highly selective trading system.
مؤشر
مؤشر

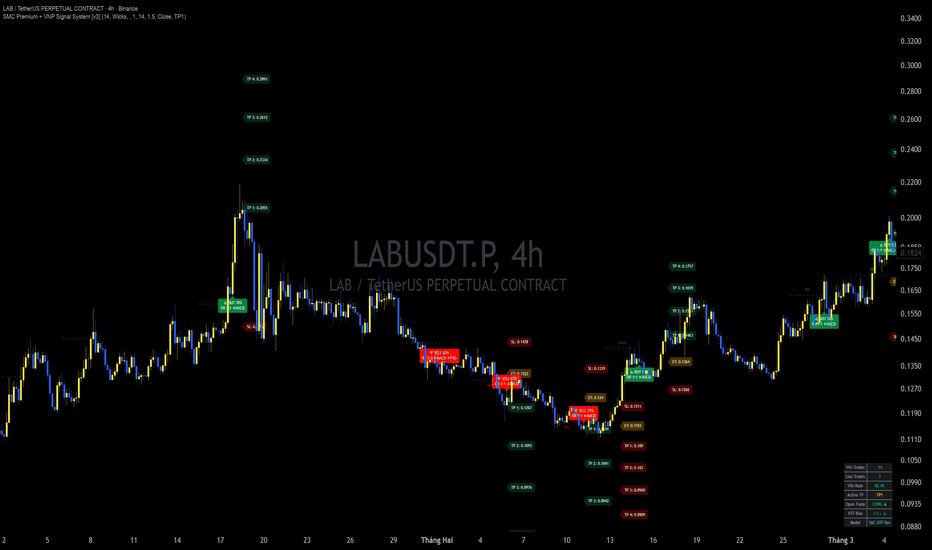
BW Ultimate Master V12.35 - The Final Mastery (PERFECT FULL)1. Precision Entry Logic (Signal Triggers)The system identifies high-probability entry points through two primary methodologies:Trend-Following (Perfect Buy/Sell): Signals are triggered when at least 3 out of 4 "pillars" align: a Breakout of Structure (BOS), a Price Action confirmation (such as Engulfing or Pin Bar patterns), a price pullback to the EMA 30, and synchronization with Higher Timeframe (HTF) trends. Institutional Reversal (SMC Special): This advanced logic detects "Smart Money" behavior by identifying a Liquidity Sweep (price dipping below old lows to hunt stop losses) followed by a Market Structure Shift (MSS/CHoCH). To prevent chasing the move, the indicator waits for a retest of the 50% Order Block level before issuing a signal. 2. Market Structure & VisualizationsMajor Swing Peak Markers: Key structural points are automatically labeled (HH, HL, LH, LL) using a 15-bar fractal filter, allowing you to see the trend hierarchy at a glance. SW ZONE (Accumulation Box): The indicator highlights yellow consolidation zones when the market is in a "sleeping" phase (determined by a low Alligator line spread). SWEEP RISK: It dynamically calculates potential "Stop Hunt" levels above and below consolidation zones, warning you of price areas where reversals are likely to occur after a fake breakout. Dynamic Session Boxes: Visualizes the opening and closing ranges for the Asia, London, and New York markets to help identify specific session-based volatility. 3. Smart Control Dashboards07:00 Daily Compass: Compares the Asia 07:00 open price with the actual daily close to establish a clear directional bias for the trading day. Institutional Pressure Score: Aggregates momentum data from 7 different timeframes (Weekly down to 1-Minute) into a 1,400-point score. It identifies "RSI Tension" and warns if higher and lower timeframes are in conflict, which typically precedes a sharp market correction. Live Market Summary: Provides a real-time assessment of the market phase, distinguishing between Accumulation, Trending Up, Trending Down, or high-risk Chop Zones. 4. Signal Integrity & Risk FilteringAnti-Spam Mechanism: The code includes a "locking" feature that prevents the indicator from firing multiple repetitive signals during a single market swing. Range Safety Filter: Automatically blocks "Buy" signals if the price is at the extreme top of a narrow range or "Sell" signals if at the extreme bottom, ensuring you never "chase" a move into a potential reversal point مؤشر

مؤشر
مؤشر
استراتيجية

مؤشر
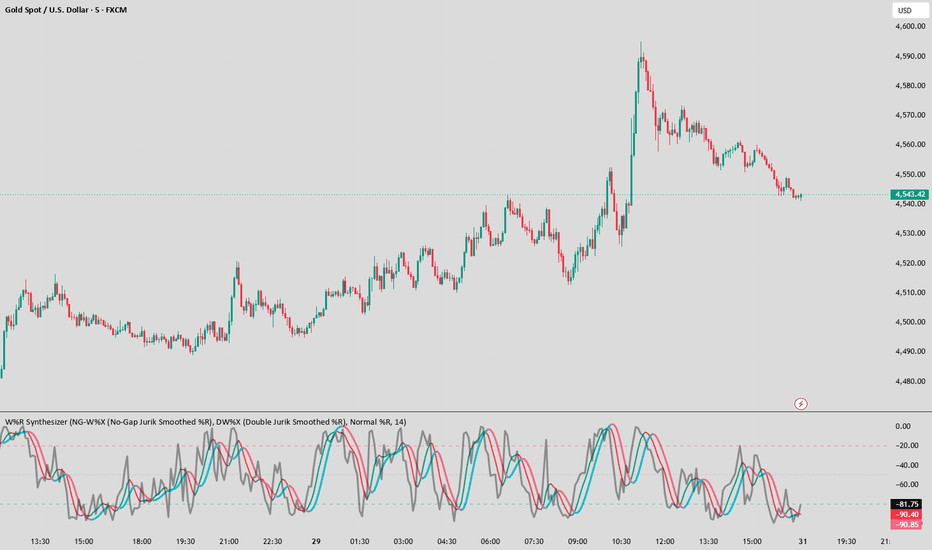
Williams %R Jaggedness fix
The standard Williams %R is extremely jagged. Relying on a naive (Highest - Close) / (Highest - Lowest) look-back formula makes it a victim of spatial illusion. It is highly vulnerable to "salt-and-pepper" noise, intraday microstructure stop-hunts, and high-frequency volatility spikes. It generates an erratic, jagged signal that triggers false regime shifts, trapping retail liquidity.
Solving the jaggedness problem is not about applying a single, lagging moving average. It requires a continuous-time signal processing pipeline. I developed 4, sovereign hypotheses to isolate the true kinematic intent of the market.
► HYPOTHESIS I: The Robust Nonlinear Butterworth %R (RNB-R)
The Mechanism: Amplitude and Noise Filtering.
The Execution: We cleanse the raw data using a 3-period Median Filter to instantly reject 1-bar liquidity sweeps without introducing lag. The resulting %R is then dynamically smoothed via a Volatility-Adaptive SuperSmoother. The lookback adapts kinematically—tightening during explosive volatility to capture breakouts, and expanding during consolidation to ignore chop.
► HYPOTHESIS II: The Decycled Zero-Lag Cycle Oscillator (DZL-R)
The Mechanism: Frequency Cancellation.
The Execution: We abandon the concept of "averaging" entirely. Using a 48-bar High-Pass filter, we isolate and subtract the high-frequency spectral noise directly from the price (Decycling). By mapping the Williams %R onto this Decycled Price, we produce a zero-lag, wave-like signal that perfectly reflects pure trend movement while ignoring micro-structural noise.
► HYPOTHESIS III: The IMF-Extracted Persistent Shape Wave (IMF-W)
The Mechanism: Spectral Shape Fitting & Empirical Mode Decomposition (EMD).
The Execution: We deconstruct the continuous price manifold into its intrinsic cyclical modes. We discard IMF 1 (high-frequency noise) and the residual (ultra-slow drift). By reconstructing the asset using only IMF 2 and IMF 3, we force the Williams %R to measure purely persistent, rhythmic structural cycles.
► HYPOTHESIS IV: The Bipolar Inverse Fisher Williams %R (BIF-R)
The Mechanism: Probability Distribution Transformation.
The Execution: To maximize state persistence, we smooth the standard oscillator with a 2-pole Gaussian filter, normalize it, and compress it through an Inverse Fisher Transform. This mathematical thermodynamic shift forces the oscillator into a bimodal, polarized state. It snaps quickly between extremes and stays there, eliminating nervous jaggedness in favor of pure regime tokenization. مؤشر
مؤشر

مؤشر

مؤشر