استراتيجية

مؤشر
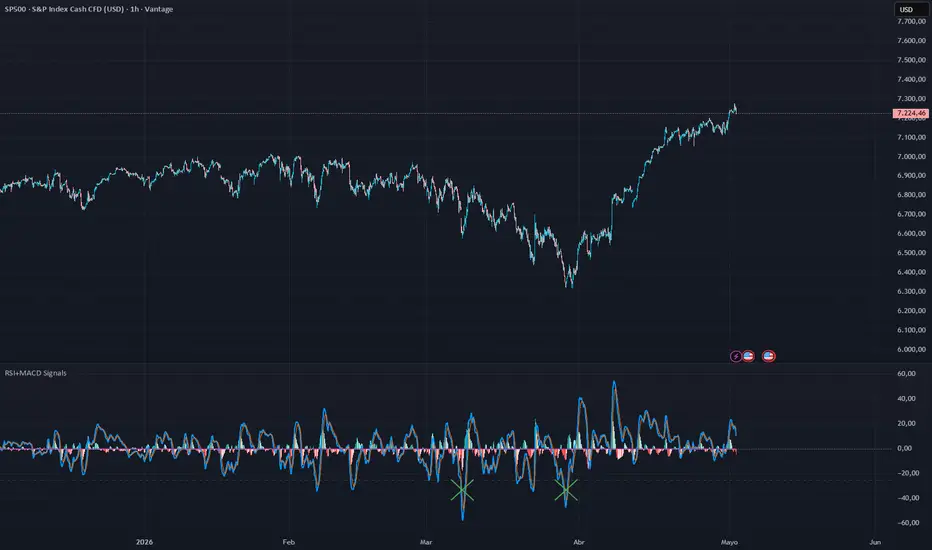
CRUXRSI + MACD Buy Signal
Indicador de senales de compra que combina el RSI y el MACD para detectar momentos de alta probabilidad de reversion alcista.
Como funciona:
El indicador monitoriza continuamente el RSI y el MACD. Cuando el RSI baja a zona de sobreventa extrema por debajo de 20 y luego se da la vuelta cruzando al alza ese nivel, y al mismo tiempo el MACD se encuentra en zona negativa, se genera una senal de compra representada por una cruz verde en la parte inferior del panel.
Senal de compra:
Se activa cuando se cumplen dos condiciones simultaneamente. El RSI cruza al alza el nivel 20, confirmando que el precio toco fondo y esta girando. El MACD esta por debajo de -25, confirmando que hay agotamiento vendedor real.
Importante:
Este indicador genera exclusivamente senales de compra. No genera senales de venta. Disenado para buscar rebotes en zonas de sobreventa extrema. Funciona en cualquier activo y temporalidad.
Configuracion recomendada:
Activo: cualquier activo, indices, acciones, forex, cripto, materias primas.
Timeframe: desde 15 minutos hasta diario.
RSI nivel sobreventa: 20 por defecto.
MACD nivel negativo: -25 por defecto, ajustar segun el activo.
Como usarlo:
Espera la cruz verde en la parte inferior. Activa la alerta para recibir notificacion automatica. Usar siempre con gestion de riesgo y stop loss. مؤشر

Universal Session Open V.2📌 Cos'è questo indicatore?
L'Apertura Borse Universale V.2 è un indicatore essenziale per chi fa trading usando i concetti di Smart Money (SMC) e Price Action. Traccia in modo millimetrico i prezzi di apertura delle tre sessioni principali: Tokyo, Londra e New York.
Il prezzo di apertura di una borsa funge spessissimo da livello istituzionale chiave (Supporto/Resistenza) durante la giornata di contrattazione. Questa versione 2 è stata completamente riscritta per eliminare ogni errore di calcolo e permetterti di vedere esattamente dove i mercati aprono le loro porte.
⚙️ Caratteristiche Principali
Precisione Millimetrica (UTC+2 Roma): Le aperture sono calcolate esattamente al primo minuto di ciascuna borsa (Tokyo 00:00, Londra 09:00, New York 14:30), senza sfasamenti dovuti al fuso orario del grafico.
Niente Sovrapposizioni Visive: Le linee orizzontali di apertura iniziano sulla prima candela della sessione e si fermano esattamente alla chiusura della sessione stessa.
Storico Completo (Novità V.2): Le linee dei giorni precedenti rimangono finalmente visibili nello storico, permettendoti di fare backtest visivo sui vecchi livelli di apertura.
Design Pulito: Un piccolo pallino segnala visivamente la candela esatta dell'apertura, lasciando il grafico libero dal rumore.
💡 Come usarlo nel Trading (SMC)
Identifica i livelli chiave: Usa le linee di apertura come zone di attrazione del prezzo o potenziali livelli di rimbalzo (Open Session Manipulation).
Analisi del contesto: Combinalo con il tuo indicatore di Range Medio o con i rettangoli delle sessioni per capire la struttura di mercato intraday.
Analisi multi-timeframe: Funziona perfettamente su qualsiasi timeframe (1m, 5m, 15m, ecc.), garantendo sempre la massima precisione della linea.
🛠️ Impostazioni Personalizzabili
Puoi modificare manualmente gli orari di apertura e chiusura delle sessioni direttamente dal menu delle impostazioni dell'indicatore per adattarli ai tuoi strumenti di trading preferiti.
🇬🇧 ENGLISH VERSION
Script Title
Universal Session Open V.2
Script Description
📌 What is this indicator?
The Universal Session Open V.2 is an essential indicator for anyone trading with Smart Money Concepts (SMC) and Price Action. It accurately tracks the exact opening prices of the three major trading sessions: Tokyo, London, and New York.
The opening price of a session very often acts as a key institutional level (Support/Resistance) during the trading day. This Version 2 has been completely rewritten to eliminate any calculation errors, allowing you to see exactly where the markets open.
⚙️ Key Features
To-the-Minute Precision (UTC+2 Rome): Openings are calculated exactly at the very first minute of each session (Tokyo 00:00, London 09:00, New York 14:30), without any offset caused by your chart's timezone.
No Visual Overlap: The horizontal open lines begin on the first candle of the session and stop exactly when the session ends.
Full Historical Data (New in V.2): Previous days' lines now remain visible in your chart's history, allowing you to visually backtest past opening levels.
Clean Design: A small dot visually marks the exact opening candle, keeping your chart clutter-free.
💡 How to use it in Trading (SMC)
Identify key levels: Use the opening lines as price magnets or potential bounce levels (Open Session Manipulation).
Analyze the context: Combine it with your Average Range indicator or session rectangles to understand the intraday market structure.
Multi-timeframe analysis: It works perfectly on any timeframe (1m, 5m, 15m, etc.), always guaranteeing the maximum precision of the lines.
🛠️ Customizable Settings
You can manually adjust the opening and closing hours of the sessions directly within the indicator settings menu to adapt them to your preferred trading assets.
مؤشر

مؤشر

استراتيجية

SMC Session Volume & Delta Tracker## 🇮🇹 Versione Italiana
### **Cos'è questo indicatore?**
Questo script è la versione avanzata (2.0) del nostro tracker volumetrico per Smart Money Concepts (SMC). Oltre a calcolare l'affluenza di capitali rispetto alla media storica degli ultimi 20 giorni, introduce una metrica fondamentale: il **Delta del Volume (Pressione B/S)**.
### **Come funziona il Delta del Volume?**
L'algoritmo analizza la Price Action e la struttura di ogni singola candela per scomporre il volume totale in volume d'acquisto (Buyer) e volume di vendita (Seller). Nella dashboard vedrai la percentuale esatta di forza tra le due fazioni:
* **Testo Verde (es. 55% / 45%):** I compratori hanno il controllo del volume di sessione.
* **Testo Rosso (es. 42% / 58%):** I venditori stanno dominando la sessione.
* **Testo Bianco:** Equilibrio e potenziale fase di accumulazione/distribuzione.
### **Perché è fondamentale per la tua strategia a 3, 5 e 15 minuti?**
Sui time frame bassi il mercato è pieno di rumore. Questo indicatore ti dà la conferma istituzionale:
* **Validazione dei CHoCH e BOS:** Se il prezzo rompe una struttura al rialzo e la Pressione B/S è sopra il 52% (Verde), hai la conferma che lo Smart Money sta comprando.
* **Filtro per i Fakeout:** Se vedi una rottura ma la pressione è contraria o in equilibrio, molto probabilmente è una Stop Hunt.
### **Caratteristiche principali**
* **Calcolo in tempo reale del Delta** (Buyer vs Seller).
* **Affluenza di Capitale %** rispetto alla media a 20 giorni.
* **Dashboard personalizzabile** in dimensione e posizione sul grafico.
---
## 🇬🇧 English Version
### **What is this indicator?**
This script is the advanced version (2.0) of our volume tracker designed for Smart Money Concepts (SMC). In addition to measuring capital flow against the 20-day historical average, it introduces a crucial metric: **Volume Delta (B/S Pressure)**.
### **How does the Volume Delta work?**
The algorithm dissects the Price Action and structure of every single candle to split total volume into buying volume (Buyers) and selling volume (Sellers). The dashboard displays the exact balance of power:
* **Green Text (e.g., 55% / 45%):** Buyers are in control of the session's volume.
* **Red Text (e.g., 42% / 58%):** Sellers are dominating the session.
* **White Text:** Market in balance, potential accumulation or distribution phase.
### **Why is it essential for 3m, 5m, and 15m timeframes?**
Low timeframes are filled with noise. This indicator provides institutional confirmation:
* **Validate CHoCH and BOS:** If price breaks structure to the upside and B/S Pressure is above 52% (Green), you have confirmation that Smart Money is buying.
* **Filter out Fakeouts:** If you see a breakout but the pressure is opposite or balanced, it is highly likely a Stop Hunt.
### **Key Features**
* **Real-time Delta Calculation** (Buyers vs Sellers).
* **Capital Flow %** compared to the 20-day average.
* **Customizable Dashboard** (adjust size and position on the chart). مؤشر

Berg EPS Line + EstimateThe Moving Average Trend System is a clean, powerful, and easy-to-use technical analysis indicator designed to help traders identify market direction, trend strength, potential entry zones, and possible reversal areas using a structured moving average methodology.
This indicator is built around one of the most widely used concepts in technical analysis: moving averages. By smoothing price action and filtering out short-term market noise, moving averages allow traders to focus on the broader market structure and make more objective trading decisions.
The purpose of this tool is to provide a clearer visual representation of trend behavior across different market conditions. Whether the market is trending upward, trending downward, consolidating, or preparing for a possible breakout, this indicator helps traders interpret price movement with greater confidence. مؤشر

مؤشر

SMC Session Range Converter Pro (%)Cos'è questo indicatore?
Questo script è uno strumento statistico avanzato progettato per i trader che utilizzano gli Smart Money Concepts (SMC).
Calcola la media del range percentuale di prezzo (Massimo - Minimo) degli ultimi 3 mesi per le tre sessioni principali: Tokyo, Londra e New York.
Perché è fondamentale per la tua strategia?
Nello Smart Money Concepts, conoscere la volatilità media di ogni singola borsa ti offre un vantaggio statistico enorme:
Target realistici: Evita di impostare Take Profit (TP) irrealistici che superano il movimento medio della sessione corrente.
Riconoscere l'espansione:
Se il range medio di Londra è dell'$1.4\%$ e oggi si muove già dell'$1.3\%$ prima di New York, sai che la sessione ha quasi esaurito la sua forza e potresti aspettarti una pausa o un'inversione.
Nessun fuso orario errato: Cattura il prezzo di apertura esatto della prima candela utile in base all'orario del tuo grafico, senza i classici problemi dei fusi orari standard degli altri indicatori.
Caratteristiche principali
Orari Europei di Default: Già preimpostato sugli orari della borsa in Europa/Roma (Tokyo 00:00-09:00, Londra 09:00-17:30, NY 14:30-22:00).Dashboard Pulita: Una tabella discreta posizionata in basso a destra per non coprire il grafico, indicatori FVG o altre analisi.
Completamente Personalizzabile: Nelle impostazioni puoi modificare gli orari, il colore di sfondo della tabella, la posizione e la dimensione del testo.Alert Integrati:
Possibilità di attivare un alert automatico che ti avvisa se la sessione corrente supera il suo range medio a 3 mesi.
---
What is this indicator?
This script is an advanced statistical tool designed for traders using Smart Money Concepts (SMC). It calculates the average percentage price range (High - Low) of the last 3 months for the three major sessions: Tokyo, London, and New York.
Why is it essential for your strategy?
In Smart Money Concepts, knowing the average volatility of each session gives you a huge statistical edge:
Realistic Targets: Avoid setting unrealistic Take Profits (TP) that exceed the average movement of the current session.
Recognize Expansion: If London's average range is 1.4% and today it has already moved 1.3% before New York opens, you know the session has almost exhausted its strength and you might expect a pause or a reversal.
No Wrong Timezones: It captures the exact opening price of the first available candle based on your chart's time, avoiding the typical timezone issues of standard indicators.
Key Features
Default European Hours: Already preset to European/Rome market times (Tokyo 00:00-09:00, London 09:00-17:30, NY 14:30-22:00).
Clean Dashboard: A discreet table positioned in the bottom right corner so it doesn't cover your chart, FVG indicators, or other analysis.
Fully Customizable: In the settings, you can edit session times, table background color, position, and text size.
Built-in Alerts: Option to set an automatic alert that notifies you if the current session exceeds its 3-month average range.
مؤشر

Apertura borse universale - SMC session trackerDescrizione dello Script
*"Questo indicatore è uno strumento essenziale e ultra-pulito progettato per i trader che utilizzano gli Smart Money Concepts (SMC). Traccia con assoluta precisione il livello di prezzo di apertura esatto delle tre sessioni principali di mercato e le collega tra loro.
A cosa serve operativamente:
Mappa della liquidità: Ti permette di vedere a colpo d'occhio come le istituzioni muovono il prezzo da una sessione all'altra.
Bias giornaliero: Mostra i punti di rotazione chiave (Tokyo, Londra, New York) senza riempire il grafico con rettangoli enormi e confusi.
Grafico pulito: Una volta rimosse le candele dal grafico, l'indicatore mostra la pura struttura dei movimenti del prezzo tra le sessioni.
Caratteristiche principali:
Universale e Multitimeframe: Funziona perfettamente sia sul Forex (es. EUR/USD) che sui metalli (es. Silver/XAGUSD) e su qualsiasi timeframe (dal 15m al 4H).
Linee di collegamento automatiche: Disegna una linea tra i punti di apertura delle sessioni consecutive per identificare istantaneamente il trend intraday.
Si abbina alla perfezione con il mio secondo indicatore: SMC Session Range Converter Pro (%), che mostra i dati statistici di volatilità in una comoda tabella."
-----
Description
*"This indicator is an essential, ultra-clean tool designed for traders using Smart Money Concepts (SMC). It accurately tracks the exact opening price levels of the three major market sessions and connects them.
How to use it for your trading:
Liquidity Map: It allows you to see at a glance how institutions move price from one session to the next.
Daily Bias: It highlights the key pivot points (Tokyo, London, New York) without cluttering the chart with huge, confusing rectangles.
Clean Charts: By hiding the candles on your chart, the indicator shows the pure structure of price movements between sessions.
Key Features:
Universal & Multi-timeframe: It works perfectly on Forex (e.g., EUR/USD), metals (e.g., Silver/XAGUSD), and any timeframe (from 15m to 4H).
Automatic Connection Lines: It draws lines between the opening prices of consecutive sessions to instantly identify the intraday trend.
It pairs perfectly with my second indicator: SMC Session Range Converter Pro (%), which displays historical volatility data in a clean dashboard." مؤشر

مؤشر

مؤشر

مؤشر

مؤشر

مؤشر

مؤشر

SWING ATR Based V2 - Weekly + DailyWhat does this indicator do?
This is a dual-timeframe extension of the original SGE script. It runs the same structural logic on Weekly (macro filter) and Daily (tactical trigger) simultaneously, with a new Price Discovery detection layer.
1. It identifies Market Swings on two timeframes
The script monitors price action on both the Weekly and the Daily charts at the same time. Each timeframe has its own ATR-based volatility filter, its own range threshold (kRange), and its own confirmation logic requiring at least two significant candles to validate a directional change. The Weekly is fetched via request.security; the Daily runs natively on the chart's bars.
2. It plots Support and Resistance zones for each timeframe
Weekly levels: solid lines, brighter colors (green/red by default).
Daily levels: dashed lines, accent colors (blue/orange by default), tagged with ▲D / ▼D markers.
Auto-cleaning: once a level is broken by a close, the line turns gray and stops extending. Only unbroken levels remain active.
3. It calculates two SGE Scores with a new Price Discovery layer
Each timeframe has its own score (-2 / 0 / +2), with the same one-candle delay as before. The new logic:
Breaking a support/resistance with other levels still standing → score goes to ±2 directly, or to 0 if the previous score was the opposite extreme (smooth transition).
Breaking the last support or the last resistance → Price Discovery mode: the score jumps directly to ±2 regardless of previous state, signaling that the structure has run out of opposing levels.
4. It simplifies visual reading
Each timeframe shows only its N closest unbroken levels (configurable per TF).
The chart candles are colored by the Weekly score (Weekly is treated as the dominant macro filter). If Weekly is disabled, the candles stay neutral.
5. Dashboard (top-right)
A side-by-side panel showing both timeframes:
Current SGE Score (-2 / 0 / +2)
Price Discovery state (UP / DOWN / Non)
Number of active supports
Number of active resistances
Number of levels currently displayed
Summary: A dual-timeframe structural detector. Weekly defines the dominant context; Daily provides faster signals within that context. The Price Discovery flag highlights moments when the market has broken all opposing structure — typically the highest-conviction zones for trend continuation.
Recommended Settings:
kRange: 1.3 / 1.4 (both TFs)
ATR Mult: 0.3 to 0.5
Trade ideas: take Daily entries only when Weekly score agrees (or is in Price Discovery in the same direction).
Script created with Claude AI. مؤشر

Absorcion + Envolvente + TendenciaAbsorcion + Vela Envolvente + Tendencia
Este indicador combina tres conceptos poderosos del análisis técnico: absorción de volumen, velas envolventes y filtro de tendencia con EMA 200, generando señales de alta probabilidad en cualquier activo y temporalidad.
Como funciona:
El indicador detecta primero una vela de absorción — una vela pequeña con volumen muy superior a la media donde los compradores o vendedores están absorbiendo el lado contrario sin dejar que el precio se mueva. Cuando en la siguiente vela aparece una vela envolvente que confirma la dirección, y además el precio está del lado correcto de la EMA 200, se genera la señal final.
Señal de COMPRA (BUY):
Se activa cuando se cumplen estas condiciones:
El precio está por encima de la EMA 200 (tendencia alcista confirmada)
Aparece una vela de absorción compradora con volumen mínimo 2x la media
La siguiente vela es una vela envolvente alcista que confirma el movimiento
Señal de VENTA (SELL):
Se activa cuando se cumplen estas condiciones:
El precio está por debajo de la EMA 200 (tendencia bajista confirmada)
Aparece una vela de absorción vendedora con volumen mínimo 2x la media
La siguiente vela es una vela envolvente bajista que confirma el movimiento
Colores en el grafico:
Burbuja azul con porcentaje → absorcion compradora detectada, espera confirmacion
Burbuja naranja con porcentaje → absorcion vendedora detectada, espera confirmacion
Etiqueta verde grande BUY → señal de compra confirmada
Etiqueta roja grande SELL → señal de venta confirmada
El porcentaje indica cuanto del volumen total fue comprador o vendedor
Configuracion recomendada:
Activo: cualquier activo (indices, acciones, forex, cripto, materias primas)
Timeframe: desde 15 minutos hasta diario
Volumen minimo: 2x la media (ajustable)
EMA tendencia: 200 periodos (ajustable)
Como usarlo:
Espera la burbuja azul o naranja como aviso
Confirma con la señal BUY o SELL en la siguiente vela
Opera siempre a favor de la EMA 200
Usar siempre con gestion de riesgo y stop loss مؤشر

مؤشر

ATC OBV Trend DivergenceWhat It Is
The ATC OBV Trend Divergence indicator is a structurally engineered version of On-Balance Volume — one of the oldest and most misunderstood volume tools in technical analysis. Where the standard retail OBV is a raw cumulative line that traders attempt to manually draw trend lines on (a subjective and unreliable process). This version replaces that guesswork with a fully objective, pivot-based structural analysis engine.
The result is an OBV indicator that tells you, with no manual interpretation required, whether volume flow is building in a bullish structure, breaking down in a bearish one, expanding out of a range, or contracting into one — and it flags only the highest-quality divergences between volume flow and price, confirmed by strict multi-condition logic before a signal ever appears on your chart.
________________________________________
Who It's Built For
This indicator is designed for traders who understand that price alone doesn't tell the full story. If you've ever used a standard OBV and found yourself staring at a messy cumulative line with no clear way to interpret it — this is what OBV should have been from the start.
It works best for:
• Swing traders and intraday traders who want volume-flow confirmation before entering trend trades
• Traders who use divergence as part of a reversal or exhaustion framework and need a tool they can actually trust
• Anyone learning to think beyond price and understand what smart money participation looks like beneath the surface
Recommended instruments: ES, NQ, YM, SPY, QQQ, large-cap equities, major forex pairs Recommended timeframes: 15-minute, 1-hour, 4-hour, daily
________________________________________
The Core Concept
On-Balance Volume works on a simple principle: when price closes up, the entire bar's volume is added to a running total; when price closes down, that volume is subtracted. Over time, this creates a directional volume-flow line that should trend in the same direction as price if buying and selling pressure are in agreement.
The problem with standard OBV is threefold. First, the raw line is extremely noisy. Second, there's no objective way to define trend structure on it without drawing trend lines manually — which are subjective, brittle, and inconsistent from trader to trader. Third, most retail divergence tools flag anything that remotely resembles a divergence pattern, flooding the chart with signals that don't hold up.
The ATC OBV Trend Divergence solves all three.
________________________________________
ATC OBV Trend Divergence Enhancements
1. HMA Smoothing Raw OBV is passed through a Hull Moving Average before any calculations are performed. HMA is ATC's standard smoothing method because it reduces noise significantly without introducing the lag bias that plagues SMA or EMA smoothing. The result is a cleaner OBV line that tracks true directional flow without reacting to bar-to-bar noise.
2. Pivot-Based Structure State Engine Instead of asking you to draw trend lines on OBV, the indicator does it objectively. It detects confirmed swing highs and lows on the smoothed OBV using a configurable left/right pivot lookback, then classifies the current volume flow structure into one of eight states:
• Uptrend (HH/HL) — volume flow is making higher highs and higher lows: the cleanest bullish structure
• Downtrend (LH/LL) — volume flow is making lower highs and lower lows: confirmed bearish structure
• Higher High / Lower High — partial structure information as the trend develops
• Higher Low / Lower Low — partial low-side structure
• Expanding — volume flow is making higher highs and lower lows simultaneously: a widening, volatile structure
• Contracting — volume flow is making lower highs and higher lows: compression, often preceding a breakout
• Forming — not enough pivot history yet to classify
This replaces subjective trend line drawing with a discrete, reproducible, rules-based classification you can read at a glance from the HUD.
3. Z-Score Normalized Slope Bias The indicator measures the rate of change in OBV slope over a configurable lookback, then normalizes that slope reading against its own rolling distribution using a Z-score calculation. This means the slope bias (Bullish / Neutral / Bearish) is not based on a fixed threshold — it adapts to the current instrument's behavior over time. When OBV momentum is statistically elevated above its own recent norm, slope bias reads Bullish. When it's statistically suppressed, it reads Bearish. Everything in between is Neutral. No hardcoded levels, no round numbers.
4. Conservative, Pivot-Confirmed Divergence Detection The divergence engine is the indicator's most technically demanding component, and it was built to be strict by design. A divergence signal is only issued when all of the following conditions are met simultaneously:
• Price and OBV each have two confirmed structural pivots of the same type (two highs for bearish divergence, two lows for bullish)
• The price pivots are separated by a minimum number of bars (configurable, default 10) to prevent noise on adjacent swings
• The price pivots are not too far apart (configurable, default 80 bars) to prevent flagging stale patterns
• The price pivot and OBV pivot are temporally close to each other — they're measuring the same swing
• Optionally, the slope bias must not be contradicting the divergence direction (the "Same-Side Slope" filter)
The result is that divergence signals are rare, which is exactly what you want. When the indicator prints a divergence, it means something.
________________________________________
Reading the Chart
The OBV Line The smoothed OBV line is the primary visual. Its color reflects the current slope bias: green when bullish, red when bearish, grey when neutral. This gives you an at-a-glance read on whether volume flow momentum is trending or flat.
The Baseline A softer line tracks the rolling mean of OBV over the Z-score window. Think of this as the "neutral equilibrium" for OBV on that instrument. When OBV is above the baseline, volume flow is in net positive territory relative to its own recent history. When below, it's in net negative territory. OBV crossing the baseline is one of the six available alerts.
The Fill The area between the OBV line and the baseline is shaded in the current bias color at low opacity. This makes it visually easy to see how far volume flow has extended from equilibrium, and when it's beginning to revert.
Pivot Markers Small triangles appear on the OBV panel at each confirmed structural pivot. Red downward triangles mark OBV swing highs. Green upward triangles mark OBV swing lows. These are the same pivots the structure engine and divergence engine use — seeing them lets you visually confirm what the HUD is reporting.
Divergence Lines When a divergence is confirmed, a dashed line is drawn across the two OBV pivots that created the pattern, and a label is placed at the most recent pivot. Bear divergence lines are red with a "Bear Div" label. Bull divergence lines are green with a "Bull Div" label. Lines only appear after full confirmation — there are no provisional signals on this indicator.
________________________________________
The HUD
The heads-up display in the corner of the panel gives you a real-time read of the indicator's full state without requiring you to inspect the chart visually. Every field updates on each bar close.
Slope Bias — The current directional read on OBV momentum: Bullish, Bearish, or Neutral. Colored to match the chart.
Slope Z — The raw Z-score driving the slope bias classification. Positive values indicate above-average upward momentum. Negative values indicate below-average, downward-leaning momentum. The threshold for Bullish/Bearish classification is configurable (default ±1.0).
Structure — The current OBV structural state: Uptrend (HH/HL), Downtrend (LH/LL), Expanding, Contracting, or a partial structure label as the pattern develops.
Last Div — The type and age of the most recent confirmed divergence signal. Displayed as "Bull (X bars)" or "Bear (X bars)" where X is how many bars ago the signal fired. Shows a dash if no divergence has been detected.
Div Engine — On or Off, reflecting whether the divergence detection module is enabled in settings.
OBV — Whether smoothed OBV is currently above or below the rolling baseline.
________________________________________
How to Trade With It
The ATC OBV Trend Divergence indicator is a confirmation and context tool. It is not a standalone entry signal generator. Use it alongside your price action, levels, and primary trend framework.
Step 1 — Establish the volume flow structure. Before considering any trade, check the Structure field in the HUD. An Uptrend (HH/HL) structure on OBV is the highest-confidence bullish volume environment. A Downtrend (LH/LL) is the highest-confidence bearish environment. If the structure reads Expanding, Contracting, or is still Forming, treat that as a low-conviction volume environment and apply higher selectivity to your trade entries.
Step 2 — Check slope bias alignment. The Slope Bias and Slope Z fields tell you whether current OBV momentum is statistically elevated or suppressed. For long bias trades, you want Bullish slope bias. For short bias trades, you want Bearish slope bias. A Neutral reading doesn't cancel a trade but should reduce your conviction — volume flow momentum is not supporting a directional move right now.
Step 3 — Check OBV vs. baseline. For long entries, OBV above the baseline is supportive. For short entries, OBV below the baseline is supportive. A divergence between price position and OBV baseline position — price near highs but OBV below baseline, for example — is worth noting even without a formal divergence signal.
Step 4 — Let divergence signals add weight, not replace analysis. When a Bull Div or Bear Div label appears, treat it as a significant weight-of-evidence addition to a trade you were already building a case for. Bull Div at a key support level, with a Higher Low structure printing on OBV and slope bias turning Bullish, is a high-confidence confluence setup. Bull Div in isolation, in the middle of a trending move with no structural or level support, is just a data point.
Step 5 — Use the alerts to stay hands-free. Set alerts for the events that matter most to your process — divergence confirmations, slope bias flips, or baseline crossovers — so you don't need to watch the panel continuously. The alerts fire only when conditions are fully confirmed.
What a strong long setup looks like: OBV Structure shows Uptrend (HH/HL) or a fresh Higher Low. Slope Bias reads Bullish. OBV is above baseline. Price is pulling back to a known level. Entry on the next confirmed price structure signal from your primary framework.
What a strong short setup looks like: OBV Structure shows Downtrend (LH/LL) or a fresh Lower High. Slope Bias reads Bearish. OBV is below baseline. Price is rallying into a known resistance zone. Entry on the next confirmed rejection signal from your primary framework.
What a high-quality divergence trade looks like: A Bear Div signal prints after price makes a new high but OBV fails to confirm. Structure has been degrading — recent pivots showing Lower High. Slope Z is declining toward neutral. Price is approaching a prior distribution zone. This is an exhaustion setup worth engaging with appropriate risk sizing.
________________________________________
Alerts
Six alert conditions are available. Configure them in TradingView's alert panel using "Once Per Bar Close" for all divergence and flip alerts.
• Bullish Divergence — Fires when a fully confirmed bull divergence condition is met (price LL, OBV HL, all confirmation filters passed)
• Bearish Divergence — Fires when a fully confirmed bear divergence condition is met (price HH, OBV LH, all confirmation filters passed)
• Slope Flipped Bullish — Fires on the first bar where slope bias crosses above the Bullish threshold
• Slope Flipped Bearish — Fires on the first bar where slope bias crosses below the Bearish threshold
• OBV Crossed Above Baseline — Fires when smoothed OBV crosses above the rolling mean
• OBV Crossed Below Baseline — Fires when smoothed OBV crosses below the rolling mean
• New Higher High on OBV — Fires when a new structural higher high pivot confirms on OBV
• New Lower Low on OBV — Fires when a new structural lower low pivot confirms on OBV
________________________________________
Settings Reference
OBV Core
• HMA Smoothing Length (default 14) — Controls the degree of noise reduction applied to raw OBV before any calculations. Increase for smoother, slower-reacting output. Decrease for faster but noisier response.
Pivot Structure
• Pivot Left Bars (default 5) — Number of bars to the left of a swing point that must be lower (for a high) or higher (for a low) for the pivot to confirm.
• Pivot Right Bars (default 5) — Number of bars to the right required for confirmation. Increasing this adds lag but improves signal quality. This is the primary control for how conservative the structure and divergence engines are.
Slope Bias (Z-Score)
• Slope Lookback (default 20) — Bars over which OBV momentum is measured.
• Z-Score Window (default 200) — Rolling history used to build the normalization distribution. Larger values create a more stable baseline against which current slope is measured.
• Slope Z Threshold (default 1.0) — The Z-score magnitude required to classify slope as Bullish or Bearish rather than Neutral. Higher values mean fewer directional readings; lower values are more sensitive.
Divergence Detection
• Enable Divergence Detection — Toggle the divergence engine on or off.
• Minimum Bars Between Pivots (default 10) — Prevents divergence from flagging on two adjacent swings that are too close to represent a meaningful structural comparison.
• Maximum Bars Between Pivots (default 80) — Prevents the engine from connecting pivots that are so far apart the comparison is no longer meaningful.
• Require Same-Side OBV Slope (default on) — An additional confirmation filter. When active, a bullish divergence also requires that OBV slope not be strongly negative at the time of the signal, and vice versa. Recommended to leave on for conservative operation.
Visuals
• Toggle OBV line, baseline, state fill, pivot markers, and divergence lines individually
• Full color control for bullish, bearish, neutral, accent, and pivot marker colors
________________________________________
Instruments and Timeframes
This indicator has been validated for use on US equity index futures (ES, NQ, YM), their ETF equivalents (SPY, QQQ), large-cap individual equities, and major forex pairs. It is designed for the 15-minute, 1-hour, 4-hour, and daily timeframes. Performance on lower timeframes or low-liquidity instruments is not guaranteed, as OBV structure analysis requires sufficient volume history to produce meaningful pivot sequences.
مؤشر

Crypto Sector Rotation Radar Pro | Altseason & Memecoin TrackerA live cross-sectional ranking of 7 crypto sectors that answers a question every alt and memecoin trader asks: where is capital actually flowing right now?
Most existing sector-rotation visualizations on TradingView normalize each sector independently against its own historical range. That approach has a fundamental flaw — when one sector reads "80" and another reads "70," those numbers are not comparable to each other, because each one is relative to its own past, not to the other sectors. You cannot rank sectors that way.
This script does it differently. Every sector's momentum is measured against the same benchmark — TOTAL crypto market cap — so the resulting scores are directly comparable. Then sectors are ranked #1 through #7 in real time. The output is a single dashboard table that tells you, at a glance, which sectors are leading, which are lagging, and which are accelerating or fading.
▸ WHAT IT DOES
For each of 7 crypto sectors, the script:
1. Computes the sector-cap-to-TOTAL ratio
2. Measures rate-of-change of that ratio across three windows (default: 7, 14, 30 bars)
3. Blends the three windows by user-configurable weights into a single raw RS reading
4. Cross-sectionally ranks all 7 sectors against each other (#1 strongest, #7 weakest)
5. Converts rank to a 0–100 RS Score (rank 1 → 100, rank 4 → 50, rank 7 → 0)
6. Tracks rank change over 3 and 7 bars to surface acceleration and rotation
7. Classifies each sector's flow as IN, OUT, or NEU based on rank and momentum
All of this is rendered in a sortable dashboard table, with optional smoothed RS lines plotted below for historical pattern context.
▸ SECTORS TRACKED
• 🚀 Memecoins (CRYPTOCAP:MEME.C)
• Ξ Ethereum Eco (CRYPTOCAP:ETHEREUM.C)
• 🏛 RWA (CRYPTOCAP:RWA.C)
• 🤖 AI (CRYPTOCAP:AI.C)
• ◎ Solana Eco (CRYPTOCAP:SOLANA.C)
• 🏢 Exchange Tokens (CRYPTOCAP:EXCHANGES.C)
• 🏦 DeFi (CRYPTOCAP:TOTALDEFI)
The benchmark for all RS calculations is CRYPTOCAP:TOTAL.
▸ HOW TO READ THE TABLE
Each row shows one sector with six columns:
• SECTOR — emoji and name
• RANK — current cross-sectional rank (#1 = strongest, #7 = weakest)
• RS — 0–100 score derived from rank
• Δ3D — rank change over the last 3 bars, with a heat badge (🔥 ▲ ↗ · ↘ ▼ ❄️)
• Δ7D — rank change over the last 7 bars
• FLOW — IN (top 3 + positive momentum), OUT (bottom 3 + negative momentum), NEU (mixed)
A footer row summarizes the regime in plain language:
• 🔥 Memes in Top 2 — Meme Rotation
• ⚠️ Risk-Off Regime — defensive sectors leading while risk-on lagging
• ❄️ Memes in Bottom 2 — sector weak
• Mixed Rotation — no clear leader pattern
The memecoin row is highlighted by default to make it stand out at a glance for memecoin-focused traders. This can be toggled off in settings.
▸ HOW TO READ THE LINES
Below the table, each sector's RS Score is plotted as a smoothed line using EMA smoothing (default: 5 bars). Because the raw RS Score takes only 7 discrete values (rank-derived), a small amount of smoothing turns step-function jumps into readable curves while preserving the cross-sectional comparability.
• Lines above 83 = sector is currently in top 2 by RS
• Lines below 17 = sector is currently in bottom 2 by RS
• Lines crossing through the middle band = active rotation in or out
• Multiple lines bunched together = no clear sector leadership
Smoothing length is user-adjustable. Set to 1 for raw stepped lines.
▸ INPUT SETTINGS
Calculation:
• Calculation Timeframe — default Daily, locked regardless of chart TF
• Short / Medium / Long Window — three momentum lookbacks (default 7, 14, 30 bars)
• Three weight inputs to blend the windows (default 40 / 35 / 25 %)
Display:
• Toggle the dashboard table
• Choose table position and size
• Toggle the memecoin row highlight
• Toggle the RS score lines
• Adjust line smoothing (EMA length)
Colors — all six dashboard color states are individually configurable.
▸ BUILT-IN ALERTS
The script defines 17 alert conditions, available through TradingView's standard Add Alert dialog:
Per-sector surges (rank improved by 2+ over 3 bars):
• 🚀 MEME surged
• Ξ Ethereum surged
• 🏛 RWA surged
• 🤖 AI surged
• ◎ Solana surged
• 🏢 Exchange surged
• 🏦 DeFi surged
Per-sector drops (rank declined by 2+ over 3 bars):
• same 7 sectors, mirrored
Memecoin-specific:
• 🔥 MEMES entered Top 2
• ❄️ MEMES dropped to Bottom 2
Regime:
• ⚠️ Risk-Off Regime — defensives leading, risk-on lagging
▸ HOW TO USE IT
The script pulls all of its data from CRYPTOCAP indices via request.security, so the chart symbol does not affect the calculation. Putting it on CRYPTOCAP:TOTAL on the Daily timeframe gives the cleanest macro context, but the radar will work identically on any chart.
Default timeframe is Daily, which is appropriate for sector-rotation analysis. Higher-timeframe rotations are typically slower-moving signals; lower timeframes will produce noisier rankings.
▸ LIMITATIONS AND HONEST CAVEATS
• This is a contextual / regime tool, not a predictive one. The radar tells you the current state of cross-sector capital flow. It does not predict which sector will lead next.
• Rank is a relative measure. A sector at rank #1 with weak absolute momentum is still rank #1 — but the broader market may be in a downtrend. Pair this with absolute price/cap context.
• When two or more sectors have very similar momentum, ranks can flip frequently. The Δ3D and Δ7D columns help filter noise from real rotation.
• Sector definitions follow TradingView's CRYPTOCAP indices, which themselves are subject to TradingView's classification logic. If a token is reclassified, all sectors will reflect that change.
• RS Score is derived from rank, so it can only take 7 discrete values (0, 16.7, 33.3, 50, 66.7, 83.3, 100). The smoothing on the plotted lines is purely cosmetic; the table values are exact.
▸ TECHNICAL NOTES
• Pine Script v6
• Open-source under the Mozilla Public License 2.0
• Uses 8 request.security calls (well below the 40-call limit), all to official CRYPTOCAP indices
• No repainting — all calculations use confirmed bar close values from the requested timeframe
• Designed to coexist with other indicators on the same chart
▸ DISCLAIMER
For educational and informational purposes only. This script is a market analysis tool, not financial advice. Nothing here constitutes a recommendation to buy or sell any asset. Past behavior of the radar in historical data is not a guarantee of future behavior. Cryptocurrency markets are highly volatile and can result in substantial losses. Always do your own research and trade with risk you can afford to lose.
مؤشر

مؤشر