مؤشر

Tubbsie's Chop Warning Indicator**Chop Warning**
A simple, at-a-glance indicator that tells you whether the market is trending cleanly or chopping sideways around a moving average — the kind of environment where breakouts fail, stops get hunted, and most trend-following setups don't work.
**How it works**
The indicator picks a reference EMA (13 by default) and counts how often each candle's high–low range contains that EMA. When price is trending, most candles sit cleanly above or below the moving average and the count stays low. When price is chopping, the EMA sits inside candle after candle and the count rises.
Two views are reported side by side:
- **Rolling** — the percentage of crosses over the last N candles, showing what's happening right now
- **Session** — the percentage across the whole trading session, showing the character of the day as a whole
Both figures appear in a small on-chart table, colour-coded green (clean), amber (mixed), or red (choppy). A single verdict line at the top summarises the current state in plain English.
**Settings**
Everything is configurable: EMA length, rolling window size, the two thresholds that define "clean" and "choppy", which view drives the warning (rolling, session, or either), the session window and timezone, table position and size, colours, and optional background shading when a warning is active. Alerts fire when chop is detected and when the market cleans up again.
**How to use it**
Works on any market and any timeframe. Add it to your chart alongside your existing setup and treat a red verdict as a filter — a signal to stand aside, reduce size, or wait for the environment to improve before taking a trend-based trade.
مؤشر

Market Regime Engine [NQ Labs] WHAT THIS ANSWERS
Almost every indicator tells you WHAT the market is doing. Very few tell you
whether the current market has enough exploitable structure to be worth
risking money on at all. The Market Regime Engine is built for that second
question: should I be trading this right now, and if so, what style of
approach do current conditions actually favour?
It is not a signal generator. It produces no entries. It is a filter you run
underneath whatever you already trade.
WHY IT IS BUILT THIS WAY
Two design decisions separate this from a conventional regime or trend filter.
1. EVERY AXIS IS PERCENTILE-RANKED AGAINST ITS OWN HISTORY.
Most regime tools use fixed thresholds - an ADX of 25, an ATR multiplier of 3.
Those numbers are calibrated to whatever the author tested on. They are the
reason a tool behaves sensibly on one instrument and nonsensically on the
next. Here, each axis is ranked against its own recent distribution on the
current symbol and timeframe, so a 65th-percentile reading carries the same
meaning on a crypto pair as it does on an FX major. Nothing needs retuning
per market.
2. THE THREE AXES ARE ORTHOGONAL BY DESIGN.
Many "confluence" tools stack three views of momentum and present the
agreement as confirmation. Correlated inputs agreeing is not evidence. These
three measure genuinely different properties:
DIRECTIONAL EFFICIENCY - net distance travelled divided by the total path
walked to get there. A value near 1 is a straight line. A value near 0 means
price ended where it started after a great deal of work. This is the most
direct available answer to "is there a trend here", and it is independent of
direction.
VOLATILITY STATE - ATR ranked against its own history. Not "is volatility
high" in absolute terms, but "is volatility high for this instrument".
RETURN PERSISTENCE - lag-1 autocorrelation of log returns. Positive means an
up bar tends to be followed by an up bar, so momentum approaches have
something to work with. Negative means the market reverts. Near zero means
returns carry no usable memory.
THE SCORING LOGIC
The Tradeability Score (0-100) rests on one idea:
Efficiency is the signal. Volatility is the cost of being wrong.
Volatility only hurts you when there is no direction to exploit.
So the noise penalty is the product of how little direction exists and how
violent the market is. It approaches zero inside a strong trend no matter how
wild conditions get - because volatility inside a trend is opportunity, not
noise - and it peaks precisely where traders are most reliably ground down:
low efficiency combined with high volatility. That specific combination is
what the engine exists to flag.
THE FIVE REGIMES
TREND Efficiency high. Directional. Follow it.
VOLATILE CHOP Efficiency low, volatility high. No direction, maximum cost
of being wrong. The state that does the damage.
COIL Efficiency low, volatility low. Compression. Wait.
RANGE Efficiency low, volatility middling. Edges are tradeable.
TRANSITION Efficiency mid-range. No clean read. Reduce size.
A raw regime read must hold for a configurable number of consecutive bars
before it is confirmed. Without that filter, readings that straddle a
threshold flip back and forth for single bars.
REGIME MATURITY - THE PART I HAVE NOT SEEN ELSEWHERE
The engine records the length of every completed regime run on the current
chart and reports the current run against that learned baseline, together with
the sample size behind it.
A trend at 0.3x its typical duration and a trend at 2.4x are not the same
trade, even though every conventional indicator prints the identical reading
for both. A compression that has lasted three times longer than compressions
normally last on this instrument is a different proposition to one that
started six bars ago.
The sample size (n=) is shown deliberately. Below the configured threshold the
cell dims, because a baseline built from two observations is not evidence and
should not be dressed up as though it were.
HOW TO USE IT
The engine is a gate, not a trigger. The intended workflow:
1. Read the Verdict first. STAND DOWN means your edge, whatever it is, is
probably not present. The most valuable output of this tool is the trades
it talks you out of.
2. Read the Regime and Favoured Style. Trend-following systems belong in
TREND. Mean-reversion belongs in RANGE, and only when Persistence confirms
the market is actually reverting rather than merely quiet. COIL means the
setup has not arrived yet. VOLATILE CHOP means nothing you own works here.
3. Read Persistence before choosing an approach. If it reads Random, the
market has no memory to exploit in either direction, and both momentum and
mean-reversion are coin flips.
4. Use vs Typical for position management, not entry. An extended regime is
not a reversal signal. It is a reason to stop adding and to tighten what
you already hold.
5. Let the ribbon and score do the work on the price chart. The dashboard can
be forced onto the main pane so the engine occupies a pane without costing
you chart real estate.
SETTINGS THAT ACTUALLY MATTER
RANKING LOOKBACK is the important one. It must span several complete regime
cycles on your timeframe or every axis will rank near the middle and
everything will read TRANSITION. 250 bars on a daily chart is roughly a year -
a real baseline. 250 bars on a 5-minute chart is under a day, and is not.
On intraday timeframes, raise it substantially.
MINIMUM REGIME RUN trades responsiveness for stability. Higher values give a
calmer read and a cleaner duration baseline at the cost of confirming changes
later. Set it to 1 to see the unfiltered classification.
CHOP PENALTY controls how hard low-efficiency volatility is punished. Set it
to 0 and the score becomes pure efficiency rank.
EFFICIENCY and VOLATILITY thresholds are percentiles, not raw values. They do
not need adjusting per instrument. That is the point.
LIMITATIONS - STATED PLAINLY
- This is a lagging, descriptive tool. It classifies conditions that have
already formed. It does not forecast, and it cannot tell you a regime is
about to end.
- Confirmation costs lag. A genuine regime change registers a few bars late by
design. That is the price of not flickering.
- The maturity baseline is learned from visible chart history and rebuilds
whenever settings, symbol, or timeframe change. It is not persistent memory.
Early in a chart, or for a rarely-occurring regime, the sample is thin. The
n= value tells you when to discount it.
- On intraday equity charts, overnight gaps inflate ATR and distort the
persistence reading. Daily and above, or extended hours, handle this better.
- Autocorrelation is a weak statistic on short samples. Persistence readings
close to zero should be read as "no information", not as a subtle signal.
- Efficiency is directionless. TREND tells you a trend exists, not which way
it points. Pair it with something that reads direction.
- No regime classification is correct at the moment it matters most, which is
the turn. Nothing here changes that.
This script is open-source. Read the code, disagree with it, improve it.
This is an analytical tool for studying market conditions. It is not financial
advice, and it does not generate trade recommendations. Trading involves risk
of loss. مؤشر

Choppiness Setup Planner [AGPro Series]Choppiness Setup Planner
🧠 Core Idea
Is this choppy market still a no-trade environment, or has it matured into a valid setup with defined risk, invalidation, and targets?
📌 Overview / What it does
Choppiness Setup Planner is a planner-style overlay built for one of the most common decision problems in technical analysis: what should a trader do when price is trapped inside a choppy range, but pressure starts building near the edge?
The script detects no-trade chop conditions, builds a decision range around the active structure, scores setup quality from 0 to 100, and turns a mature range release into a clear planning map with invalidation and target levels. Instead of only saying "the market is choppy," it answers whether the setup is still avoidable, preparing, weak, valid, active, or invalidated.
The cleanest visual use case is higher-timeframe planning. Weekly and daily charts allow the full range-to-plan lifecycle to breathe: no-trade structure, preparation, release, target, and invalidation can all be read without the chart feeling crowded.
It does not automate execution, predict future price, or replace personal trade selection. It is an analytical planner designed to organize context, risk, and next-action state directly on the chart.
🎯 Purpose & Design Philosophy
This script was built because many market-state tools show information without helping the user make a decision. A Choppiness Index value, ADX filter, or range box can be useful, but those outputs often stop before the practical question: what now?
Choppiness Setup Planner fills that gap by connecting chop detection with a structured planning workflow. It is intended for discretionary traders, breakout traders, and range-to-expansion traders who want to avoid low-quality noise while preparing for stronger releases from mature ranges.
The design philosophy is simple: first protect attention, then qualify the setup, then map risk only when the structure deserves it.
⚡ Why This Script Is Different
Most tools focus on detecting chop, drawing a box, or marking a breakout.
This script does NOT act like a generic signal indicator, generic support/resistance tool, or simple Choppiness Index panel.
Instead, it turns a choppy market into a decision sequence:
1. Detect the no-trade environment.
2. Track range age and pressure.
3. Grade setup validity with a 0-100 score.
4. Define the next action state.
5. Map invalidation and targets only after a valid release.
That makes the script closer to a decision engine than a visual marker. It is also intentionally separated from manual position planners: users do not enter their own position parameters. The script derives its planning levels from the detected chop range and the release quality model.
⚙️ Methodology
1. Context Detection
The engine blends Choppiness Index, directional weakness, path efficiency, range tightness, wick noise, and volatility behavior to determine whether the market is inefficient enough to qualify as a no-trade chop environment.
2. Reference Mapping
When chop persists long enough, the script builds a decision range around the active structure. This range is not a generic support/resistance zone; it is a planning container for the current no-trade condition.
3. Reaction Evaluation
The script evaluates whether pressure is improving through range age, chop release, ADX lift, path-efficiency improvement, ATR lift, edge pressure, candle body quality, close quality, and optional volume participation.
4. Visual Output
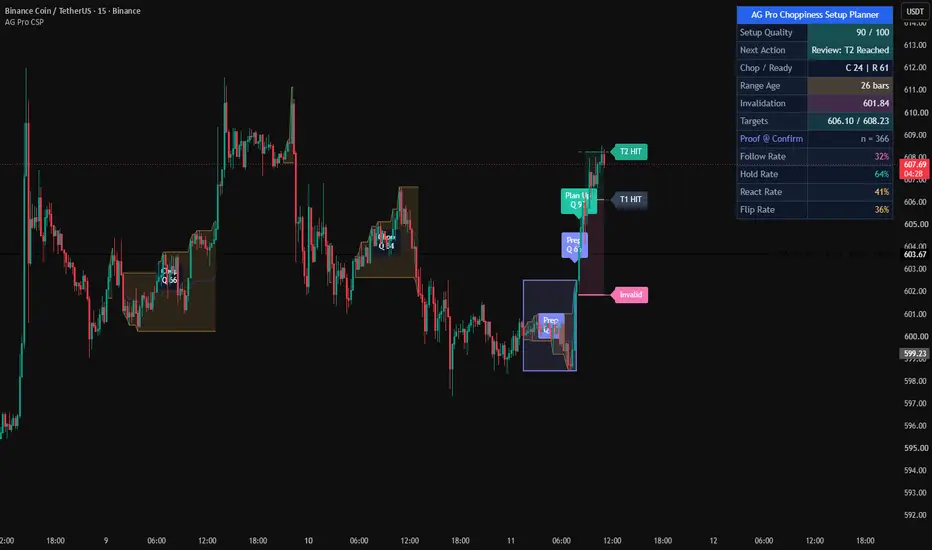
The chart displays the no-trade ribbon, decision range box, centered zone label, preparation markers, valid plan markers, weak-release markers, invalidation level, target levels, and a compact AGPro planner panel.
🗺️ How to Read the Chart
Zones represent the active no-trade decision range. A centered label inside the box shows whether the structure is still a no-trade zone or has moved into preparation mode.
Labels represent state changes. PREP marks a mature range with improving setup quality. PLAN UP and PLAN DN mark valid releases. SKIP marks a release that happened but failed the minimum plan-quality threshold. T1, T2, and INVALID track the active plan lifecycle.
Colors follow the AGPro state palette. Teal is used for stronger upside planning states, pink for downside or invalidation states, amber for caution and no-trade states, and indigo for preparation/readiness.
The panel shows Setup Quality, Next Action, Chop / Ready, Range Age, Invalidation, and Targets.
🚦 Signals & States
• Avoid: Chop → the market is inefficient and still belongs in no-trade mode.
• Prepare: Edge Watch → the range has matured and internal readiness is improving.
• Skip: Low Quality → price released from the range, but the quality score was not strong enough.
• Track Upside Plan → upside release met the minimum valid plan score.
• Track Downside Plan → downside release met the minimum valid plan score.
• Manage: T1 Reached → the active plan reached its first target level.
• Review: T2 Reached → the active plan reached its second target level.
• Reset: Invalidated → the active plan crossed its invalidation level.
🔔 Alerts Logic
Alerts are available for preparation state, valid upside plan, valid downside plan, weak release, Target 1 reached, Target 2 reached, and invalidation.
Each alert is an attention marker. Alerts are not trade instructions, not automation rules, and not execution commands.
🧩 Confluence Logic
The setup becomes stronger when a mature chop range aligns with improving readiness, edge pressure, candle body participation, release distance, and optional volume participation.
When these components align, the script can convert the release into a valid plan. When price releases without enough score, the script marks the event as SKIP instead of treating every breakout as useful.
📊 When to Use
• Choppy markets where the user needs a no-trade filter.
• Weekly, daily, and 4H planning where range structure matters more than micro-noise.
• Mature ranges that may be preparing for expansion.
• Breakout-preparation workflows.
• Range-to-trend transition monitoring.
• Symbols where invalidation and target structure should be visible before acting.
⚠️ When NOT to Use
• Extremely illiquid markets with unreliable candles.
• Symbols where volume data is misleading, unless volume participation is disabled.
• News-driven spikes where a single candle can distort range logic.
• Very low timeframes with excessive spread noise.
• Scalping workflows that require rapid-fire signals instead of structural planning.
• Markets where the user has no broader context for trend, liquidity, or session behavior.
🎛️ Key Inputs
• Choppiness Length → controls the chop-detection backbone.
• Decision Range Length → controls how the active no-trade range is framed.
• Minimum Range Age → controls how long chop must persist before planning begins.
• Preparation Threshold → controls when the range moves from avoid mode to preparation mode.
• Minimum Valid Plan Score → controls how selective valid plan labels should be.
• Release Buffer ATR → controls how far price must move beyond the range boundary.
• Invalidation Buffer ATR → controls the distance behind the released boundary used for invalidation.
• Target 1 / Target 2 R Multiples → control target projection from the plan risk.
• Panel Location / Theme / Font Size → control the AGPro panel interface.
• Label Font Size / Cooldown / Maximum Visible Labels → control chart readability.
🖥️ Interface & Visual Design
The interface is designed around fast decision reading. The chart carries the range box, no-trade ribbon, centered zone label, event labels, and active risk/target levels. The panel summarizes the same workflow without becoming a large dashboard.
The first panel row follows the AGPro standard: one merged blue header row containing only the script name.
Visual density is intentionally moderate. The chart should not look empty, but it should also avoid crowded signal spam.
🧪 Practical Usage Workflow
1. Read the panel.
Check Setup Quality and Next Action first.
2. Check the decision range.
If the box says NO-TRADE, the structure is still inefficient. If it says PREP, the range is maturing.
3. Evaluate the release.
A valid PLAN label means the release met the quality threshold. A SKIP label means the release was not strong enough.
4. Review invalidation and targets.
When a plan is active, use the plotted levels to understand structure, not as automatic orders.
5. Confirm broader context.
Combine the planner output with trend, liquidity, timeframe, session, and personal execution rules.
For publication screenshots, higher-timeframe examples are usually the cleanest because they show the complete planning sequence without compressing labels and boxes into a noisy layout.
🔍 Interpretation Guidelines
Think in states, not isolated signals.
NO-TRADE protects attention.
PREP means the market is becoming more interesting.
PLAN means the release has enough structure to track.
SKIP means the release happened but did not earn quality.
INVALID means the plan lost its structural premise.
🚫 What This Script Is NOT
This script is not a prediction engine.
It is not financial advice.
It is not auto trading.
It is not guaranteed signals.
It is not a strategy tester.
It is not a replacement for independent analysis.
⚠️ Limitations & Transparency
The script is rule-based and depends on selected inputs, timeframe, volatility, and available market data.
Different symbols and sessions can produce different behavior. Low liquidity, sudden volatility shocks, and abnormal gaps can reduce the usefulness of range-based planning.
Volume participation is optional because volume quality differs across markets and feeds.
🧠 Market Context Notes
Chop is not always weakness. Sometimes it is absorption, sometimes indecision, and sometimes simple noise. The script does not claim to know the cause. It organizes the observable structure so the user can decide whether the environment is worth attention.
🧾 Use Case Examples
When price spends several bars inside a tight inefficient range and the panel says Avoid: Chop, the script is acting as a no-trade filter.
When the range matures and the centered label changes to PREP, the script is showing that pressure has improved enough to monitor the edge.
When price releases and receives PLAN UP or PLAN DN, the script maps invalidation and targets from the structure.
When price releases but receives SKIP, the script is saying the event did not meet the model's quality threshold.
On weekly charts, a single valid plan can show the entire decision chain: range maturity, preparation, release, target reaction, and invalidation. This is the strongest showcase environment for the script.
🧱 System Philosophy
AGPro tools are built around structured decision support: define the condition, score the quality, map the relevant structure, and keep the chart readable.
Choppiness Setup Planner follows that philosophy by turning a noisy no-trade environment into a cleaner decision workflow.
🔐 Non-Promise Statement
No script can provide certainty.
No score guarantees follow-through.
No label guarantees an outcome.
📉 Risk Disclosure
Trading involves risk. Market conditions can change quickly, planned setups can fail, and losses can occur. This script is provided for educational and analytical use only. It does not provide financial advice or guaranteed trading outcomes. Users remain responsible for their own analysis, decisions, risk management, and execution.
📚 Educational Note
Use this script to study how choppy markets mature, how range releases differ in quality, and how invalidation and target logic can be organized visually before a decision is made. مؤشر

Apex Adaptive TrailApex Adaptive Trail: Adaptive Volatility Trend System
This custom trend-following indicator improves on standard SuperTrend implementations by addressing two key weaknesses: excessive whipsaws during high volatility and false signals in ranging markets.
Core Logic:
- Synthetic Heikin Ashi values are calculated internally (without changing chart candles) to provide smoother source data for trend detection.
- ATR-based trailing stop with adaptive multiplier: dynamically adjusts between 0.8x and 1.5x the base factor based on current volatility (ATR / 50-period SMA of ATR). Widens in volatile conditions, tightens in quiet markets.
- Weighted Confluence Score (0-100%): Combines four independent filters, each contributing 25%:
• Price position relative to 21-period EMA (trend alignment)
• ADX > 20 (momentum strength)
• Choppiness Index < 60 (trending vs ranging detection)
• Alignment with Daily EMA(50) trend direction
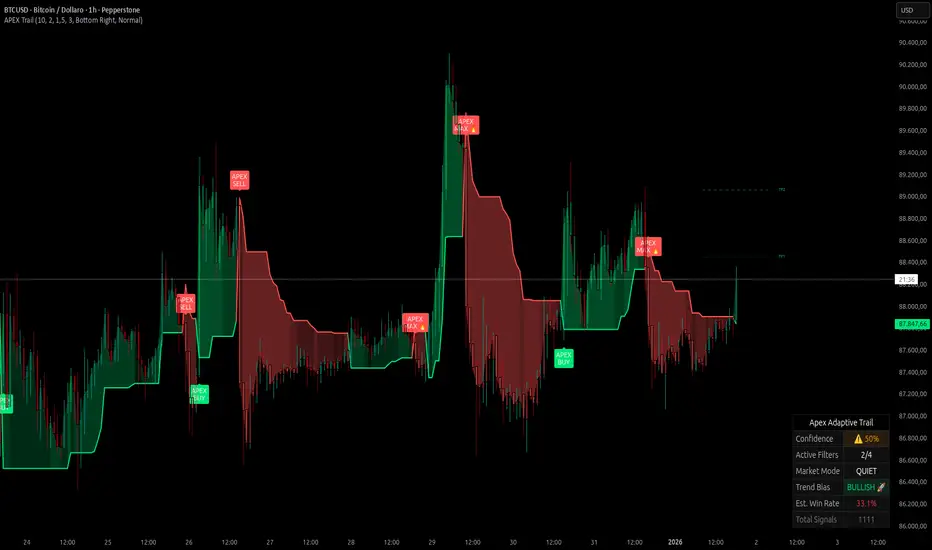
Signals are only generated when price crosses the adaptive trail AND the confluence score exceeds 75% (standard) or 90% (MAX 🔥 ultra-strong). This combination significantly reduces low-quality entries compared to traditional SuperTrend crossovers.
Key Features:
- Dynamic confidence cloud (opacity based on score)
- Real-time dashboard showing volatility state, active filters, trend bias, and estimated historical win rate
- Optional dynamic/fixed profit targets
- Fully customizable filters and adaptive behavior
Usage: Best on 15m to 4H timeframes for trend-following strategies (Crypto, Forex, Indices). Enter on APEX signals, use trail as stop-loss, TP lines for partial exits.
This script integrates established concepts into a unique adaptive framework with volatility-responsive risk management and multi-filter validation.
Disclaimer: For educational and analysis purposes only. Past performance is not indicative of future results. Always use proper risk management.
"This script combines established indicators (ATR trailing, ADX, Choppiness Index, EMA, MTF) into a unique adaptive system with dynamic volatility adjustment and weighted confluence scoring – features not found together in standard SuperTrend variations."
مؤشر

Filtered TEMA CrossoverFiltered Dual TEMA Crossover
This indicator is a trend-following tool based on the classic Dual Triple Exponential Moving Average (TEMA) Crossover strategy, enhanced with two robust filters: the Chop Index and the Average Directional Index (ADX).
The TEMA is known for its low lag and high responsiveness, making the crossover an effective signal for trend reversals. However, trading TEMA crossovers during sideways, choppy markets often leads to false signals. This is where the filters come in.
Key Features
▪️Dual TEMA Crossover: Plots two customizable TEMA lines (Fast and Slow) for clear visualization of the primary trend direction.
▪️Intelligent Signal Filtering: Buy and Sell signals are generated only when the market confirms it is in a trending state, thanks to two integrated filters:
➖Chop Index Filter: Blocks signals when the market is detected as sideways or consolidating (Chop Index reading above a user-defined threshold).
➖ADX Filter: Ensures signals are only taken when the trend strength is sufficient (ADX reading above a user-defined minimum threshold).
▪️Customizable Signals: Full control over the signal shapes (Arrows, Triangles, etc.), colors, text, and size.
How to Use It
Use the Filtered Dual TEMA Crossover to enter positions on trend continuation or reversal while dramatically reducing exposure to low-quality, whipsawing signals common in non-trending environments.
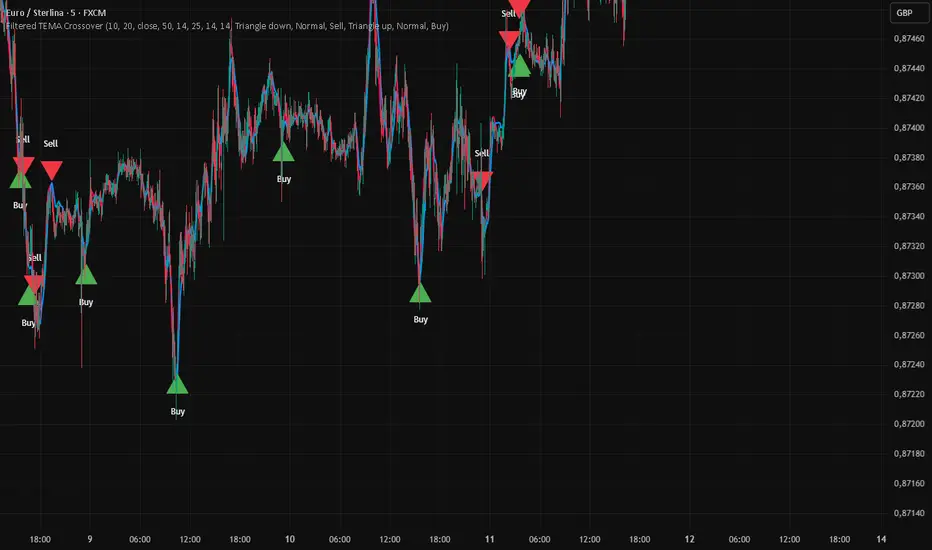
Before the filters:
After the filters:
Minimize Noise. Maximize Clarity. Trade the Trend. مؤشر

KST Strategy [Skyrexio]Overview
KST Strategy leverages Know Sure Thing (KST) indicator in conjunction with the Williams Alligator and Moving average to obtain the high probability setups. KST is used for for having the high probability to enter in the direction of a current trend when momentum is rising, Alligator is used as a short term trend filter, while Moving average approximates the long term trend and allows trades only in its direction. Also strategy has the additional optional filter on Choppiness Index which does not allow trades if market is choppy, above the user-specified threshold. Strategy has the user specified take profit and stop-loss numbers, but multiplied by Average True Range (ATR) value on the moment when trade is open. The strategy opens only long trades.
Unique Features
ATR based stop-loss and take profit. Instead of fixed take profit and stop-loss percentage strategy utilizes user chosen numbers multiplied by ATR for its calculation.
Configurable Trading Periods. Users can tailor the strategy to specific market windows, adapting to different market conditions.
Optional Choppiness Index filter. Strategy allows to choose if it will use the filter trades with Choppiness Index and set up its threshold.
Methodology
The strategy opens long trade when the following price met the conditions:
Close price is above the Alligator's jaw line
Close price is above the filtering Moving average
KST line of Know Sure Thing indicator shall cross over its signal line (details in justification of methodology)
If the Choppiness Index filter is enabled its value shall be less than user defined threshold
When the long trade is executed algorithm defines the stop-loss level as the low minus user defined number, multiplied by ATR at the trade open candle. Also it defines take profit with close price plus user defined number, multiplied by ATR at the trade open candle. While trade is in progress, if high price on any candle above the calculated take profit level or low price is below the calculated stop loss level, trade is closed.
Strategy settings
In the inputs window user can setup the following strategy settings:
ATR Stop Loss (by default = 1.5, number of ATRs to calculate stop-loss level)
ATR Take Profit (by default = 3.5, number of ATRs to calculate take profit level)
Filter MA Type (by default = Least Squares MA, type of moving average which is used for filter MA)
Filter MA Length (by default = 200, length for filter MA calculation)
Enable Choppiness Index Filter (by default = true, setting to choose the optional filtering using Choppiness index)
Choppiness Index Threshold (by default = 50, Choppiness Index threshold, its value shall be below it to allow trades execution)
Choppiness Index Length (by default = 14, length used in Choppiness index calculation)
KST ROC Length #1 (by default = 10, value used in KST indicator calculation, more information in Justification of Methodology)
KST ROC Length #2 (by default = 15, value used in KST indicator calculation, more information in Justification of Methodology)
KST ROC Length #3 (by default = 20, value used in KST indicator calculation, more information in Justification of Methodology)
KST ROC Length #4 (by default = 30, value used in KST indicator calculation, more information in Justification of Methodology)
KST SMA Length #1 (by default = 10, value used in KST indicator calculation, more information in Justification of Methodology)
KST SMA Length #2 (by default = 10, value used in KST indicator calculation, more information in Justification of Methodology)
KST SMA Length #3 (by default = 10, value used in KST indicator calculation, more information in Justification of Methodology)
KST SMA Length #4 (by default = 15, value used in KST indicator calculation, more information in Justification of Methodology)
KST Signal Line Length (by default = 10, value used in KST indicator calculation, more information in Justification of Methodology)
User can choose the optimal parameters during backtesting on certain price chart.
Justification of Methodology
Before understanding why this particular combination of indicator has been chosen let's briefly explain what is KST, Williams Alligator, Moving Average, ATR and Choppiness Index.
The KST (Know Sure Thing) is a momentum oscillator developed by Martin Pring. It combines multiple Rate of Change (ROC) values, smoothed over different timeframes, to identify trend direction and momentum strength. First of all, what is ROC? ROC (Rate of Change) is a momentum indicator that measures the percentage change in price between the current price and the price a set number of periods ago.
ROC = 100 * (Current Price - Price N Periods Ago) / Price N Periods Ago
In our case N is the KST ROC Length inputs from settings, here we will calculate 4 different ROCs to obtain KST value:
KST = ROC1_smooth × 1 + ROC2_smooth × 2 + ROC3_smooth × 3 + ROC4_smooth × 4
ROC1 = ROC(close, KST ROC Length #1), smoothed by KST SMA Length #1,
ROC2 = ROC(close, KST ROC Length #2), smoothed by KST SMA Length #2,
ROC3 = ROC(close, KST ROC Length #3), smoothed by KST SMA Length #3,
ROC4 = ROC(close, KST ROC Length #4), smoothed by KST SMA Length #4
Also for this indicator the signal line is calculated:
Signal = SMA(KST, KST Signal Line Length)
When the KST line rises, it indicates increasing momentum and suggests that an upward trend may be developing. Conversely, when the KST line declines, it reflects weakening momentum and a potential downward trend. A crossover of the KST line above its signal line is considered a buy signal, while a crossover below the signal line is viewed as a sell signal. If the KST stays above zero, it indicates overall bullish momentum; if it remains below zero, it points to bearish momentum. The KST indicator smooths momentum across multiple timeframes, helping to reduce noise and provide clearer signals for medium- to long-term trends.
Next, let’s discuss the short-term trend filter, which combines the Williams Alligator and Williams Fractals. Williams Alligator
Developed by Bill Williams, the Alligator is a technical indicator that identifies trends and potential market reversals. It consists of three smoothed moving averages:
Jaw (Blue Line): The slowest of the three, based on a 13-period smoothed moving average shifted 8 bars ahead.
Teeth (Red Line): The medium-speed line, derived from an 8-period smoothed moving average shifted 5 bars forward.
Lips (Green Line): The fastest line, calculated using a 5-period smoothed moving average shifted 3 bars forward.
When the lines diverge and align in order, the "Alligator" is "awake," signaling a strong trend. When the lines overlap or intertwine, the "Alligator" is "asleep," indicating a range-bound or sideways market. This indicator helps traders determine when to enter or avoid trades.
The next indicator is Moving Average. It has a lot of different types which can be chosen to filter trades and the Least Squares MA is used by default settings. Let's briefly explain what is it.
The Least Squares Moving Average (LSMA) — also known as Linear Regression Moving Average — is a trend-following indicator that uses the least squares method to fit a straight line to the price data over a given period, then plots the value of that line at the most recent point. It draws the best-fitting straight line through the past N prices (using linear regression), and then takes the endpoint of that line as the value of the moving average for that bar. The LSMA aims to reduce lag and highlight the current trend more accurately than traditional moving averages like SMA or EMA.
Key Features:
It reacts faster to price changes than most moving averages.
It is smoother and less noisy than short-term EMAs.
It can be used to identify trend direction, momentum, and potential reversal points.
ATR (Average True Range) is a volatility indicator that measures how much an asset typically moves during a given period. It was introduced by J. Welles Wilder and is widely used to assess market volatility, not direction.
To calculate it first of all we need to get True Range (TR), this is the greatest value among:
High - Low
abs(High - Previous Close)
abs(Low - Previous Close)
ATR = MA(TR, n) , where n is number of periods for moving average, in our case equals 14.
ATR shows how much an asset moves on average per candle/bar. A higher ATR means more volatility; a lower ATR means a calmer market.
The Choppiness Index is a technical indicator that quantifies whether the market is trending or choppy (sideways). It doesn't indicate trend direction — only the strength or weakness of a trend. Higher Choppiness Index usually approximates the sideways market, while its low value tells us that there is a high probability of a trend.
Choppiness Index = 100 × log10(ΣATR(n) / (MaxHigh(n) - MinLow(n))) / log10(n)
where:
ΣATR(n) = sum of the Average True Range over n periods
MaxHigh(n) = highest high over n periods
MinLow(n) = lowest low over n periods
log10 = base-10 logarithm
Now let's understand how these indicators work in conjunction and why they were chosen for this strategy. KST indicator approximates current momentum, when it is rising and KST line crosses over the signal line there is high probability that short term trend is reversing to the upside and strategy allows to take part in this potential move. Alligator's jaw (blue) line is used as an approximation of a short term trend, taking trades only above it we want to avoid trading against trend to increase probability that long trade is going to be winning.
Almost the same for Moving Average, but it approximates the long term trend, this is just the additional filter. If we trade in the direction of the long term trend we increase probability that higher risk to reward trade will hit the take profit. Choppiness index is the optional filter, but if it turned on it is used for approximating if now market is in sideways or in trend. On the range bounded market the potential moves are restricted. We want to decrease probability opening trades in such condition avoiding trades if this index is above threshold value.
When trade is open script sets the stop loss and take profit targets. ATR approximates the current volatility, so we can make a decision when to exit a trade based on current market condition, it can increase the probability that strategy will avoid the excessive stop loss hits, but anyway user can setup how many ATRs to use as a stop loss and take profit target. As was said in the Methodology stop loss level is obtained by subtracting number of ATRs from trade opening candle low, while take profit by adding to this candle's close.
Backtest Results
Operating window: Date range of backtests is 2023.01.01 - 2025.05.01. It is chosen to let the strategy to close all opened positions.
Commission and Slippage: Includes a standard Binance commission of 0.1% and accounts for possible slippage over 5 ticks.
Initial capital: 10000 USDT
Percent of capital used in every trade: 60%
Maximum Single Position Loss: -5.53%
Maximum Single Profit: +8.35%
Net Profit: +5175.20 USDT (+51.75%)
Total Trades: 120 (56.67% win rate)
Profit Factor: 1.747
Maximum Accumulated Loss: 1039.89 USDT (-9.1%)
Average Profit per Trade: 43.13 USDT (+0.6%)
Average Trade Duration: 27 hours
These results are obtained with realistic parameters representing trading conditions observed at major exchanges such as Binance and with realistic trading portfolio usage parameters.
How to Use
Add the script to favorites for easy access.
Apply to the desired timeframe and chart (optimal performance observed on 1h BTC/USDT).
Configure settings using the dropdown choice list in the built-in menu.
Set up alerts to automate strategy positions through web hook with the text: {{strategy.order.alert_message}}
Disclaimer:
Educational and informational tool reflecting Skyrexio commitment to informed trading. Past performance does not guarantee future results. Test strategies in a simulated environment before live implementation. استراتيجية

مؤشر

مؤشر
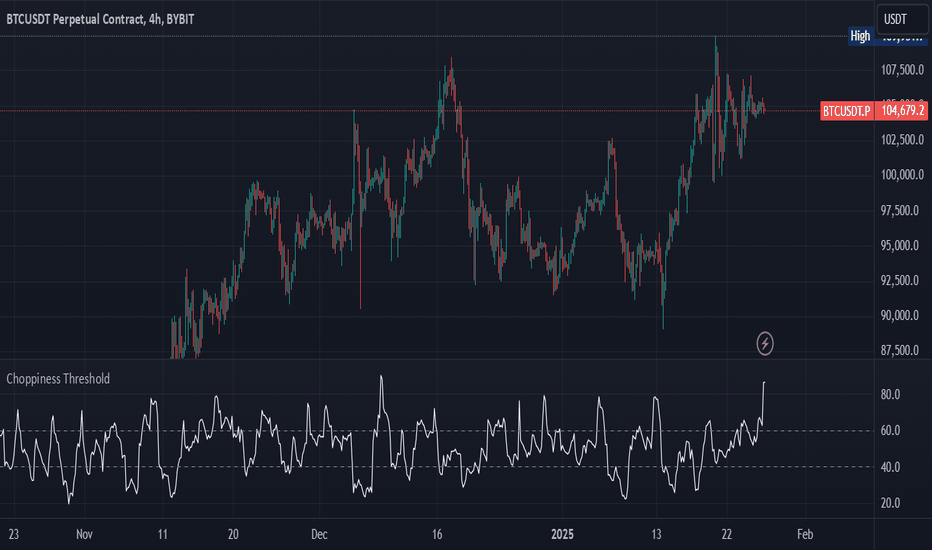
Reversion Zone IndexThe Reversion Zone Index (RZI) is an indicator that combines the Commodity Channel Index (CCI), Choppiness Index (CI), and Bollinger Bands Percentage (BBPct) to identify mean reversion signals in the market. It is plotted as an Exponential Moving Average (EMA) smoothed oscillator with overbought and oversold zones, and mean reversion signals are represented by red and green arrows.
The three indicators are combined to benefit from their complementary aspects and create a more comprehensive view of mean reversion conditions. Here's a brief overview of each indicator's benefits:
1. Commodity Channel Index (CCI): CCI measures the current price level relative to its average over a specified period. It helps identify overbought and oversold conditions, as well as potential trend retracements. By incorporating CCI, the RZI gains insights into momentum and potential turning points.
2. Choppiness Index (CI): CI quantifies the market's choppiness or trendiness by analyzing the range between the highest high and lowest low over a specific period. It indicates whether the market is in a trending or ranging phase. CI provides valuable information about the market state, which can be useful in mean reversion analysis.
3. Bollinger Bands Percentage (BBPct): BBPct measures the current price's position relative to the Bollinger Bands. It calculates the percentage difference between the current price and the bands, identifying potential overbought or oversold conditions. BBPct helps gauge the market's deviation from its typical behavior and highlights potential reversal opportunities.
The RZI combines the three indicators by taking an average of their values and applying further calculations. It smooths the combined oscillator using an EMA to reduce noise and enhance the visibility of the trends. Smoothing with EMA provides a more responsive representation of the overall trend and helps filter out short-term fluctuations.
The overbought and oversold zones are marked on the chart as reference levels. When the combined oscillator is above the overbought zone or below the oversold zone, it suggests a potential mean reversion signal. Red and green arrows are displayed to visually indicate these mean retracement signals.
The RZI is a valuable tool for identifying mean reversion opportunities in the market. It incorporates multiple indicators, each providing unique insights into different aspects of mean reversion, such as momentum, volatility, and price positioning. Traders can use this indicator to spot potential turning points and time their trades accordingly. مؤشر

مؤشر

مؤشر

مؤشر

مؤشر

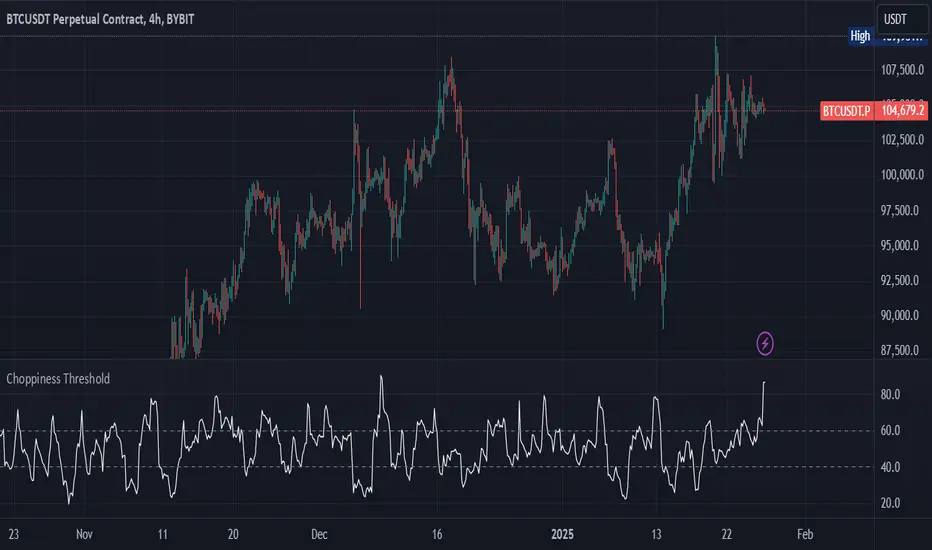
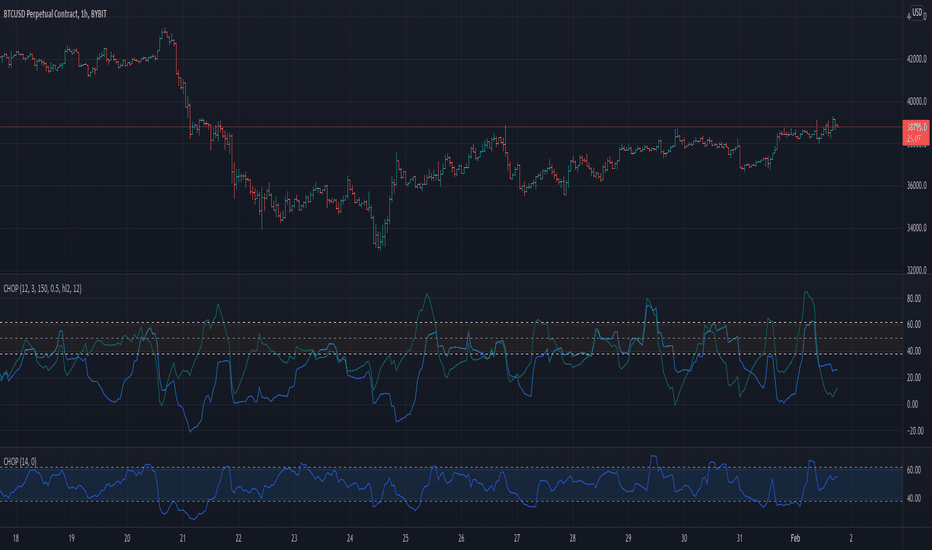
CHOPperIt is based on the Choppiness Index indicator. It can show you when the market is in range. If the lines are below the lower band, it can be a strong trend, if it is inside the 2 bands, it is considered to be a choppy market, and if it is crossed down the upper band, it can be a developing trend.
This indicator does not show you the trend direction! This may be used as a confirmation indicator.
The improvements this indicator provides over the original:
It uses ATR instead of just TR (if ATR length is 1, it is the original TR)
It uses my ATRWO (ATR Without Outliers) indicator inside, which can remove extreme highs and lows from calculation. You can tune this by the "ATRWO STDev Mult" parameter. Higher value means more outliers are allowed.
It has 2 lines, one uses ATR(WO) (the blue one), which can be similar to the original Choppiness Index, the other uses standard deviation (the teal one).
The 2 lines can be used together, or you can hide one of them. مؤشر
مؤشر

استراتيجية

Choppiness Index and RSI by ceyhun
Choppiness Index and RSI by ceyhun
This indicator is based on the inverse relationship between CHOP and RSI.
Bar color
If the RSI is greater than CHOP, the Bar color will be blue.
If CHOP is greater than RSI, the bar color will be red.
CHOP
If CHOP is less than 38.2, the color will turn blue. positive
If the CHOP is between 38.2 and 61.8, the color will be yellow and neutral.
If CHOP is greater than 61.8, the color will turn red. negative
Rsi
If Rsi is greater than 61.8, the color will turn blue, positive
If Rsi is between 38.2 and 61.8, the color will be hexagonal and neutral
If Rsi is less than 38.2 the color will be red, negative
The Choppiness Index (CHOP) is an indicator designed to determine if the market is choppy (trading sideways) or not choppy (trading within a trend in either direction). The Choppiness Index is an example of an indicator that is not directional at all. CHOP is not meant to predict future market direction, it is a metric to be used to for defining the market's trendiness only. A basic understanding of the indicator would be; higher values equal more choppiness, while lower values indicate directional trending.
Relative Strength Index (RSI)
The Relative Strength Index (RSI) is a well versed momentum based oscillator which is used to measure the speed (velocity) as well as the change (magnitude) of directional price movements. Essentially the RSI, when graphed, provides a visual mean to monitor both the current, as well as historical, strength and weakness of a particular market. The strength or weakness is based on closing prices over the duration of a specified trading period creating a reliable metric of price and momentum changes. Given the popularity of cash settled instruments (stock indexes) and leveraged financial products (the entire field of derivatives); RSI has proven to be a viable indicator of price movements. مؤشر

WhipLashThis is a study to determine if small candle bodies (little difference between open and close), regardless of overall candle length (high/low), can be used to filter choppy markets.
The indicator will calculate the selected average "MA Mode" of (close-open). To standardize this result and ensure any filters/thresholds do not need to be recalculated for each instrument the result will be used to calculate the Z Score.
The idea is that when candle bodies are small there is very little actual price movement, and therefore price is choppy. When considering the Z Score of that result, any outliers ie larger candle bodies, could show a potential trend forming. This indicator is similar to QStick but allows more customization by the user.
MA Mode determines which MA is used to smooth the results of (close-open)
Price Smoothing is the number of running periods the MA Mode is calculated for.
The three Thresholds are preset to the 90%, 95%, and 99% levels for Z Score. If these thresholds are altered you may wish to also alter the horizontal lines programmed for each level on the positive and negative sides.
The Z Length is the period for which the Z Score is calculated
Multiple MA Options Credits to @Fractured
Bits and Pieces from @AlexGrover, @Montyjus, and @Jiehonglim
As always, trade at your own risk. مؤشر

مؤشر

مؤشر

مؤشر

مؤشر