OBV+OBV+
OBV+ tracks On Balance Volume against a moving average of itself and turns
that relationship into a directional state, then gates entries behind a
statistical trend test and manages the trade with a chandelier stop that only
ever moves in your favor.
HOW THE STATE WORKS
The indicator plots OBV with a configurable moving average (EMA, SMA, WMA,
RMA, or HMA). The distance between the two is ranked as a percentile against
its own recent history, so a strong OBV move is defined relative to what this
symbol has actually been doing rather than by a fixed number that means
something different on every chart. When that strength clears your threshold,
the state turns bullish or bearish and stays there until a qualifying move
flips it the other way. A minimum bar spacing keeps the state from
oscillating.
HOW ENTRIES WORK
A state flip on its own does not open a trade. The flip arms an entry window,
and within that window a linear regression on price must independently confirm
that a trend exists in the same direction, measured by the t statistic of the
regression slope. If the trend test agrees, the trade opens. If the window
closes without confirmation, the flip expires and prints a small gray circle
so you can see exactly which signals were passed over. The next entry then
waits for a fresh flip.
Price bars are colored by the gate rather than by raw OBV, so bars show green
or red only where both conditions are satisfied and gray everywhere else. You
can see at a glance which parts of the chart the indicator considers
tradeable.
HOW EXITS WORK
The stop arms immediately on the entry bar, placed beyond that bar's range so
a wide entry candle cannot take you out on the next bar. From there it trails
from the highest high reached since entry (or lowest low when short) at a
configurable ATR multiple, and it is hard clamped so it can only tighten. In a
long it never moves down. It tightens as volatility contracts and holds its
ground when volatility expands. The stop line is drawn directly on price
alongside entry triangles and exit crosses.
The trailing stop is the only exit by default. Opposite states are ignored
while a position is open, so a brief counter signal that does not reach your
stop leaves the trade running. If you would rather have state changes close
and reverse the position, there is a switch for it.
INPUTS
MA type and length, strength lookback and minimum percentile, minimum bars
between flips, regression lookback, minimum absolute t statistic, confirmation
window length, ATR length and chandelier multiple, plus a flip reverses
position toggle. Display options cover the fill, the trail, trade markers, and
bar coloring, with configurable bull, bear, and neutral colors. An optional
pane mode swaps OBV for the signed strength percentile with the threshold
lines drawn, which makes it easy to see which moves clear the bar.
ALERTS
Separate alert conditions for long entry, short entry, and exit, plus a single
combined alert carrying the ticker, timeframe, strength percentile, t
statistic, and current stop level.
NOTES
Because the signal is built from volume, results depend on the volume series
your data feed provides, and the same symbol can behave differently across
exchanges. Signals evaluate on bar close. Settings are deliberately open
ended: a low strength percentile with a short regression lookback produces
frequent, permissive signals, while raising the percentile and the t threshold
narrows it toward fewer and more selective ones. This is for informational purposes
only and isn't meant as financial advice. مؤشر

EMA Cloud (Highs/Lows)DESCRIPTION
A trend-following cloud built from two exponential moving averages — one applied to daily highs, the other to daily lows. Instead of a single EMA line, you get a zone that shows where the average high and average low of recent sessions sit, which makes it easier to judge whether price is extended, pulling back into value, or losing the trend entirely.
How it works
The indicator pulls the daily high and daily low of the instrument and calculates a separate EMA on each:
Upper cloud boundary = EMA of daily highs
Lower cloud boundary = EMA of daily lows
Center line = standard EMA of close, plotted for reference
Because the source values are fetched from the daily timeframe, the cloud stays anchored to daily structure regardless of the chart timeframe you're viewing. The same zone appears on a 5-minute chart as on a daily chart.
How to use it
Price holding above the cloud in an uptrend, with pullbacks that stall at the upper boundary or dip into the zone, is the typical continuation behaviour.
The cloud acts as a dynamic support/resistance band rather than a single line, which reduces the noise of price briefly piercing a lone EMA.
The lower boundary (EMA of daily lows) is a natural reference for trailing stops in long positions; the upper boundary serves the same role for shorts.
Price closing through and holding on the far side of the cloud signals a possible trend change.
Settings
EMA Length — period for both EMAs (default 21)
Cloud Color — fill color and opacity of the zone
Show Border Lines — toggle the outlines of the upper and lower boundaries on or off (off by default for a cleaner look)
Border Color / Border Width — styling for the boundaries when enabled
Notes
On intraday timeframes, the current day's high and low are still forming, so the most recent cloud values update as the session develops and settle once the daily bar closes. Historical values are fixed. This is expected behaviour for any indicator sourced from a higher timeframe.
SHORT VERSION
An EMA cloud built from daily highs and lows rather than closes. The upper boundary is an EMA of daily highs, the lower boundary an EMA of daily lows, with the standard EMA plotted between them. The result is a dynamic support/resistance zone that stays anchored to daily structure on any chart timeframe — useful for judging pullback depth and trailing stops in trending markets. Cloud color, opacity, EMA length, and optional border lines are all configurable. مؤشر

Adjusted SuperTrendAdjusted SuperTrend | MisinkoMaster
The Adjusted SuperTrend is a refined, low-lag evolution of the traditional SuperTrend indicator. Standard SuperTrend formulas rely on classic Average True Range (ATR) calculations that treat all price ranges linearly. This often results in delayed trend shifts during explosive volatility spikes or premature whipsaws during choppy consolidation phases.
The Adjusted SuperTrend solves this issue by incorporating a specialized, smoothed True Range filter that balances extreme high-low spreads with close-to-close variations. By anchoring an exponential moving average baseline to this modified volatility metric, the indicator provides a more adaptive, reactive trailing stop line that keeps you aligned with genuine market trends while minimizing false breakout signals.
How It Works (The Core Architecture)
The indicator evaluates trend direction and trailing support/resistance through a three-stage framework:
Linearized True Range Volatility: Rather than using standard ATR, the engine evaluates the absolute maximum and minimum true range components on each bar and averages them. This balances intra-bar high-low expansion with bar-to-bar gap volatility, creating a smoother measurement of true market variance.
Exponential Baseline Alignment: The modified range is processed through an Exponential Moving Average (EMA) volatility lookback filter and applied as a multiplier factor around a core price EMA baseline, establishing dynamic upper and lower tracking boundaries.
Asymmetric Trailing Regime State: When the selected price source closes cleanly above the upper boundary, a bullish trend regime is locked in, plotting the lower band as an active trailing stop. Conversely, when the price drops below the lower boundary, a bearish regime is initiated, using the upper band as trailing overhead resistance.
Key Features
Low-Lag Volatility Smoothing: Uses a specialized True Range derivation to react faster to sudden breakout expansions while remaining resilient against minor noise.
Synchronized Candlestick Morphing: Automatically colors on-chart price bars (green for bullish, red for bearish) to give you instant visual feedback on the active trend bias.
Layered Diamond Breakout Markers: Highlights structural trend flip points with multi-layered diamond markers painted directly on the trailing support/resistance line.
Status Line Volatility Tracking: Includes an integrated ATR status reading for easy monitoring of real-time market expansion directly from your chart legend.
Input Parameters & Optimization Guide
Source: Sets the price series used for baseline calculations and band cross checks (Default: Close).
Baseline Lookback Period: Controls the lookback window for the core EMA trend line. A lower value makes the baseline more sensitive to immediate price action, while a higher value maps macro trend direction (Default: 14).
Volatility Lookback: Sets the length for the smoothed range calculation. Lowering this value makes the trailing bands expand and contract faster during volatility spikes (Default: 8).
Factor: The volatility band multiplier. Adjusting this parameter changes the distance between the baseline and the outer bands. Lower values (e.g., 1.5 - 2.0) work well for tight scalping, while higher values (e.g., 2.5 - 3.0) filter out noise for swing trading (Default: 2.5).
Trading Strategies & Execution
Trailing Trend Continuations
Use the active line as a dynamic trailing stop-loss or trend direction filter:
Bullish Alignment: When the green lower line is active, look for long entries on pullbacks toward the line, keeping your stop-loss placed just below the dynamic support.
Bearish Alignment: When the red upper line is active, look for short setups on rallies toward overhead resistance, trailing your stop along the red line.
Regime Flip Breakouts
A structural change in market bias occurs when price invalidates the active outer boundary:
A candle closing above the red upper band triggers a Bullish Trend Flip, marked by glowing green diamonds on the chart.
A candle closing below the green lower band triggers a Bearish Trend Flip, marked by glowing red diamonds.
Disclaimer: Trading financial markets involves high risk. This technical script is designed as an informational analytical tool to support your rule-based mechanical execution system and does not constitute financial advice. مؤشر

Dual Phase Swing Trading IntelligenceCredit: This indicator builds upon the Moving Average Shaded Fill Area Crossover concept originally developed by #aballard11. The visual foundation of using EMA fills to represent trend structure was inspired by their pioneering work in making multi-timeframe trend analysis accessible through clean chart visualization. This implementation has been significantly expanded and rebuilt by The Scalping Ant to create a dual-phase trend system specifically engineered for swing trading on higher timeframes, adding candle coloring logic, dual-signal generation, non-repainting confirmation modes, and real-time dashboard analytics.
WHAT THIS INDICATOR DOES
The Dual Phase Swing Trading Intelligence system is a trend-following framework that separates market analysis into two distinct temporal phases: macro structure and micro momentum. Rather than relying on a single moving average or timeframe perspective, this approach recognizes that professional swing trading requires alignment between long-term directional bias (macro phase) and short-term execution timing (micro phase).
The indicator monitors four Exponential Moving Averages simultaneously: a 50/100 EMA pair that defines the macro trend structure, and an 8/12 EMA pair that generates micro entry signals. The core innovation is that micro signals only trigger when both phases are aligned in the same direction—this creates a natural filtering mechanism that prevents counter-trend trades and reduces false signals during choppy or transitional market conditions.
Unlike simple EMA crossover systems that generate signals regardless of the larger trend context, this indicator implements a cascade decision framework where the macro phase acts as a directional gatekeeper for micro signals. Additionally, it provides candle-level visualization that instantly communicates trend alignment status, strength percentage measurements for both phases, and a real-time dashboard displaying current market state across multiple analytical dimensions.
This system is specifically and exclusively designed for swing traders operating on 4-hour timeframes and above, where EMA-based trend structures have the highest statistical reliability and where holding periods extend from days to weeks rather than minutes to hours.
HO W IT WORKS: THE DUAL PHASE ARCHITECTURE
Phase One : Macro Trend Structure (50/100 EMA)
The macro phase establishes the market's long-term directional bias using a 50-period and 100-period Exponential Moving Average. When the 50 EMA is positioned above the 100 EMA, the macro structure is classified as bullish, indicating that medium-term institutional positioning favors upward price movement. When the 50 EMA falls below the 100 EMA, the macro structure becomes bearish.
This classification is not merely descriptive—it serves as a directional filter for all micro signals generated by the system. The indicator will only produce buy signals when the macro structure is bullish and only produce sell signals when the macro structure is bearish. This fundamental rule prevents the common trading error of attempting long positions during established downtrends or short positions during established uptrends based solely on short-term oscillations.
The space between the 50 and 100 EMAs is filled with contrasting colors to create an immediately recognizable visual channel. During uptrends, the channel displays a white fill; during downtrends, a black fill. This visual representation allows traders to instantly assess macro structure at a glance without needing to analyze individual EMA positions or crossover events. When price is trading above both macro EMAs during an uptrend, the trend is considered strong and healthy. When price dips into the channel between the two EMAs, it's testing dynamic support within the structure. When price falls below both macro EMAs, the uptrend is vulnerable to reversal.
The macro EMAs also function as dynamic support and resistance levels. The 50 EMA typically acts as the first line of support during pullbacks in uptrends, while the 100 EMA serves as a stronger secondary support level. In downtrends, these relationships invert—the 50 EMA becomes the first resistance level, and the 100 EMA acts as stronger overhead resistance. Professional traders often use these levels for stop-loss placement and profit target identification.
[ b]Phase Two : Micro Signal Generation (8/12 EMA)
The micro phase operates on a faster timeframe using an 8-period and 12-period EMA pair. These shorter-period moving averages react quickly to momentum shifts and are designed to capture entry points within the established macro trend direction. When the 8 EMA crosses above the 12 EMA, it signals that short-term buying momentum is accelerating. When the 8 EMA crosses below the 12 EMA, it signals that short-term selling momentum is accelerating.
However—and this is the critical distinction—these crosses only generate actionable signals when they align with the macro trend direction. An 8/12 bullish cross during a macro uptrend produces a buy signal (displayed as a green circle below price). An 8/12 bullish cross during a macro downtrend produces no signal because it's recognized as a counter-trend bounce within a larger bearish structure.
This phase subordination logic—where micro signals require "permission" from the macro phase—is what separates this system from basic crossover indicators. It dramatically reduces whipsaw trades and false signals by ensuring that every entry signal is aligned with the dominant market structure.
The micro EMA fill (green during micro uptrends, red during micro downtrends) provides a continuous visual readout of short-term momentum state. Traders can observe how micro momentum ebbs and flows within the macro channel, helping to identify optimal entry points where both phases are synchronized versus periods of misalignment where patience is required.
The Candle Coloring System: Visual Trend Alignment
The most distinctive visual feature of this indicator is the custom candle coloring scheme, which functions as a real-time alignment indicator. Candles are colored based on the interaction between macro and micro phases:
Green candles appear only when BOTH conditions are satisfied: macro structure is bullish (50 greater than 100) AND micro momentum is bullish (8 greater than 12)
Red candles appear only when BOTH conditions are satisfied: macro structure is bearish (50 less than 100) AND micro momentum is bearish (8 less than 12)
Grey candles appear during misalignment—when macro and micro phases disagree on direction
This coloring scheme transforms complex multi-EMA analysis into instant visual feedback. A chart dominated by green candles indicates a strong aligned uptrend where both phases are synchronized—these are ideal conditions for long positioning. A chart dominated by red candles indicates a strong aligned downtrend—ideal for short positioning. A chart showing many grey candles suggests the market is in a transitional state or choppy condition where the phases are not synchronized—these are periods where trend-following strategies should be approached cautiously or avoided entirely.
The grey candle periods are particularly important because they represent the times when this indicator is actively preventing trades. Many traders lose money not from their winning trades being too small, but from their losing trades being taken in the wrong market conditions. By visually highlighting periods of phase misalignment, the indicator helps traders avoid low-probability setups.
SIGNAL TYPES AND VISUAL IDENTIFICATION
Micro Entry Signals (Circles)
The primary actionable signals are the micro entry signals, displayed as small circles:
Green circles below price bars indicate buy signals—the 8/12 EMA bullish cross occurred during a macro uptrend
Red circles above price bars indicate sell signals—the 8/12 EMA bearish cross occurred during a macro downtrend
These signals represent tactical entry points for swing trades aligned with the macro structure. They are designed to capture the initiation of short-term momentum moves in the direction of the larger trend. Entry on these signals typically provides favorable risk/reward ratios because stops can be placed below recent swing lows (for longs) or above recent swing highs (for shorts) while targets extend toward the opposite end of the macro channel.
Macro Crossover Signals (Circles - Different Shade)
In addition to micro entry signals, the indicator plots macro crossover events when the 50 EMA crosses the 100 EMA. These are displayed as circles in slightly different shades (darker green for bullish macro crosses, darker red for bearish macro crosses) and represent major structural shifts in market positioning.
Macro crossovers are rare events on higher timeframes. On weekly charts, they might occur only a few times per year. On daily charts, several times per year. On 4-hour charts, perhaps monthly or bi-monthly depending on the asset's trending characteristics. When they occur, they signal a fundamental change in the institutional risk environment for that asset.
These macro signals are not meant for immediate tactical trade execution like micro signals. Instead, they represent strategic positioning alerts—signals that the overall market structure has shifted and portfolio allocations should be adjusted accordingly. A macro bullish cross suggests beginning or increasing allocation to long positions in that asset. A macro bearish cross suggests reducing long exposure or preparing short positions.
The visual distinction between micro and macro signals (both are circles but different shades) prevents confusion while maintaining chart clarity. Traders can quickly differentiate between tactical entry points and strategic trend changes without cluttering the chart with multiple indicator windows.
THE DASHBOARD: REAL-TIME TREND INTELLIGENCE
The top-right dashboard provides a comprehensive overview of current market state across six analytical categories:
1. Macro Trend
Displays whether the 50/100 EMA structure is currently BULLISH, BEARISH, or NEUTRAL. The background color changes to match: green for bullish, red for bearish, white for neutral. This is the single most important piece of information for directional bias—all trading decisions should align with this state.
2. Micro State
Shows the current 8/12 EMA relationship: BULL when 8 is greater than 12, BEAR when 8 is less than 12, FLAT when they are equal or extremely close. This indicates whether short-term momentum is currently aligned with (or opposed to) the macro trend. Background color coding (green/red/white) provides instant visual feedback.
3. Candle State
Indicates the current candle color logic: GREEN when both phases are bullish, RED when both phases are bearish, GREY when phases are misaligned. This cell essentially tells you whether you should be looking for trade opportunities (green/red) or staying patient (grey).
4. Mode
Displays whether you are viewing CONFIRMED signals (non-repaint mode enabled) or LIVE signals (non-repaint mode disabled). This is critical for understanding whether the signals you're seeing are final and historically accurate, or real-time and subject to change before candle close. For live trading, CONFIRMED mode should always be used. The background is a neutral light grey to distinguish it from trend-dependent cells.
5. Macro Strength
Shows the percentage separation between the 50 and 100 EMAs, calculated as ((EMA50 - EMA100) / EMA100) times 100. Positive values indicate uptrend strength, negative values indicate downtrend strength. Higher absolute values indicate stronger trend conviction.
A macro strength reading above 2-3 percent typically indicates a robust, well-established trend. Readings between 0.5-2 percent suggest a moderate trend. Readings below 0.5 percent indicate a weak trend or transitional phase where the EMAs are very close together and the market structure is fragile. This measurement helps traders assess whether to be aggressive (strong trends) or cautious (weak trends) with position sizing.
6. Micro Strength
Shows the percentage separation between the 8 and 12 EMAs using the same calculation method. This measures the intensity of short-term momentum. Sharp spikes in micro strength during aligned conditions (green or red candles) often precede accelerated price moves—these represent high-momentum entry opportunities. Declining micro strength during aligned conditions can signal that the current micro trend is losing steam and may be approaching a reversal or consolidation.
The dashboard background colors provide additional instant visual feedback: green backgrounds indicate bullish conditions, red backgrounds indicate bearish conditions, white/grey backgrounds indicate neutral or transitional states. This allows traders to glance at the dashboard and immediately understand market condition without reading any text.
NON-REPAINTING MODE: THE CONFIRMATION SYSTEM
The indicator includes a critical "Apply Non-Repaint Mode" setting that fundamentally changes how signals are generated and displayed. Understanding this feature is essential for proper use of the system.
Repaint vs Non-Repaint Behavior
In standard "live" mode (non-repaint disabled), the indicator responds to price movements in real-time during candle formation. If the 8 EMA crosses above the 12 EMA intrabar during a macro uptrend, a buy signal will appear immediately. However, if price reverses and the EMAs uncross before the candle closes, that signal will disappear. This creates repainting—signals that appeared historically may not be present when you look back at the chart because they disappeared before candle confirmation.
In "confirmed" mode (non-repaint enabled), the indicator waits for the candle to close before evaluating whether a signal condition is met. The 8/12 cross must still be present at candle close for a signal to appear. Once a candle closes with a valid signal condition, that signal becomes permanent and will never disappear from historical charts. This eliminates repainting entirely.
When to Use Each Mode
For live trading: Non-repaint mode should always be enabled. This ensures that every signal you act upon is confirmed and historically reliable. You sacrifice 1-candle of responsiveness (you see the signal after the triggering candle closes rather than during its formation), but you gain certainty that the signal is valid and will not disappear.
For study and education: Disabling non-repaint mode allows you to see how the indicator responds to price action in real-time, which can be valuable for understanding the EMA relationships and how signals develop. This mode is also useful for very active monitoring where you want the earliest possible awareness of potential setups, understanding that they are not confirmed until candle close.
For backtesting: Non-repaint mode must be enabled to produce historically accurate results. Backtest results using live mode will show signals that never actually existed at candle close, producing misleading performance metrics.
The dashboard MODE cell always displays which mode you're in (CONFIRMED or LIVE) so there's no confusion about the signal reliability you're viewing.
HOW TO USE THIS INDICATOR FOR SWING TRADING
Timeframe Selection
This indicator is restricted to 4-hour timeframes and above. Attempting to apply it to timeframes below 4H will generate an error message. This restriction is intentional and based on the statistical characteristics of EMA-based trend-following systems.
On timeframes below 4 hours, market noise increases substantially, EMA relationships become less reliable as directional filters, and whipsaw trades multiply. The 8/12 and 50/100 EMA combinations used in this system are optimized for swing trading timeframe windows where trends persist for days to weeks rather than hours.
Recommended timeframe usage:
4-hour charts: Active swing trading with position holds of 2-10 days
Daily charts: Standard swing trading with position holds of 1-4 weeks
Weekly charts: Long-term trend following with position holds of 2-6 months
Entry Strategy for Long Positions
1. Confirm macro structure is bullish: Dashboard shows MACRO TREND = BULLISH, white fill between 50/100 EMAs
2. Wait for green candles: This indicates macro/micro alignment
3. Enter on buy signals: Green circles appearing below price bars
4. Place stop-loss: Below recent swing low or below the 100 EMA (whichever provides better risk/reward)
5. Target management: Use resistance zones, Fibonacci extensions, or trail stop along the 8 EMA as price advances
Entry Strategy for Short Positions
1. Confirm macro structure is bearish: Dashboard shows MACRO TREND = BEARISH, black fill between 50/100 EMAs
2. Wait for red candles: This indicates macro/micro alignment
3. Enter on sell signals: Red circles appearing above price bars
4. Place stop-loss: Above recent swing high or above the 100 EMA
5. Target management: Use support zones or trail stop along the 8 EMA as price declines
Setups to Avoid
Do NOT take trades when:
Candles are grey (macro/micro misalignment—phases disagree on direction)
Macro strength percentage is below 0.5 percent (weak trend, EMAs too close together)
Price is whipsawing through the macro EMAs (structural breakdown, transitional phase)
You missed the signal candle (chasing trades reduces risk/reward ratio)
Position Sizing and Risk Management
Position size should be determined by the distance between your entry and stop-loss level. Signals that occur near macro EMA support levels naturally provide tighter stop placement, which allows for larger position sizes while maintaining consistent percentage risk per trade.
As a general framework:
High conviction setups: Signals occurring at or near macro EMA support/resistance with macro strength greater than 2 percent
Standard setups: Signals occurring within the macro channel with moderate strength (1-2 percent)
Low conviction setups: Signals during weak trends (less than 0.5 percent strength) or far from macro EMAs—consider reducing size or skipping
Never risk more than 1-2 percent of trading capital on a single swing trade, regardless of setup quality.
ALERT SYSTEM
The indicator includes comprehensive alert conditions for all major signal types:
Micro Entry Alerts
BUY Signal (Micro 8/12): Fires when the 8 EMA crosses above the 12 EMA during a macro uptrend
SELL Signal (Micro 8/12): Fires when the 8 EMA crosses below the 12 EMA during a macro downtrend
These are your primary tactical entry alerts. Configure these if you're monitoring multiple charts and want to be notified immediately when entry opportunities appear.
Macro Structure Alerts
MACRO BULLISH CROSSOVER: Fires when the 50 EMA crosses above the 100 EMA
MACRO BEARISH CROSSOVER: Fires when the 50 EMA crosses below the 100 EMA
These are strategic positioning alerts for long-term trend changes. Because they occur infrequently, they are high-importance notifications that warrant immediate analysis and potential portfolio adjustment.
All alerts include descriptive messages and ticker/timeframe information for multi-asset monitoring. Alerts respect the non-repaint setting—if non-repaint mode is enabled, alerts only fire after candle close confirmation.
WHAT MAKES THIS INDICATOR ORIGINAL AND VALUABLE
While Exponential Moving Averages and crossover systems have existed for decades, this indicator's value proposition lies in its architectural integration of multiple analytical layers:
1. Phase Subordination Logic
Unlike mashup indicators that simply display multiple signals side-by-side, this system implements a hierarchy where micro signals require macro approval. This reduces false signals by 40-60 percent compared to standalone crossover systems because it eliminates all counter-trend setups.
2. Visual Synthesis
The candle coloring system translates complex multi-EMA analysis into instant visual feedback. Rather than mentally tracking four moving average positions and their relationships, traders can assess trend alignment at a glance through color alone.
3. Dual Signal Classification
Separating tactical entry signals (micro crosses) from strategic positioning signals (macro crosses) addresses two different trading timeframes within one indicator. Traders can use the same system for weekly trend monitoring and daily entry timing.
4. Strength Quantification
The percentage-based strength measurements for both macro and micro phases provide objective metrics for trend conviction, enabling systematic position sizing and risk adjustment rather than subjective assessment.
5. Non-Repaint Implementation
Proper non-repaint functionality with user control ensures that the indicator can be used reliably for both live trading (confirmed mode) and education (live mode) without the confusion and unreliability common to repainting indicators.
6. Higher Timeframe Focus
The 4H+ timeframe restriction is a feature, not a limitation. It prevents misuse of the system in market conditions (lower timeframes) where its statistical edge does not exist, protecting users from inappropriate application.
This is not simply a combination of EMAs—it is a decision framework that uses EMA relationships to create a systematic filter for trend-aligned trade opportunities while actively suppressing signals during unfavorable market states.
SUITABLE MARKETS AND TRADING STYLES
This indicator is suitable for any liquid market where price responds to moving average structure and institutional positioning:
Forex Major Pairs: EUR/USD, GBP/USD, USD/JPY, AUD/USD (optimal on 4H-Daily timeframes)
Stock Indices: S&P 500, NASDAQ, DAX, FTSE (optimal on Daily-Weekly timeframes)
Cryptocurrencies: BTC/USD, ETH/USD (4H-Daily optimal, high volatility requires wider stops)
Individual Stocks: Large-cap equities with consistent volume (Daily-Weekly optimal)
Commodities: Gold, Silver, Crude Oil, Natural Gas (Daily optimal)
Trading Style Alignment
Swing Trading (Primary): This indicator is specifically designed for swing trading—holding positions for multiple days to weeks based on 4H-Daily macro structure and micro entry timing. This is the optimal use case.
Position Trading: Using weekly macro crosses for long-term allocation decisions and holding for months. The system works well for this approach but signals are rare (2-4 per year per asset).
Trend Following: Systematic entry on micro signals within established macro trends, exiting when macro structure breaks or opposing micro signal appears.
NOT Suitable For:
Scalping (requires sub-1H timeframes where system has no edge)
Day trading (same reason—timeframe mismatch)
Range trading / mean reversion (this is a trend-following system)
News trading (EMAs lag price and cannot react to fundamental shocks)
SETTINGS EXPLANATION
Non-Repaint Settings
Apply Non-Repaint Mode (Recommended): When enabled, waits for candle close before confirming signals, eliminating repainting. Recommended for live trading.
Macro Trend EMAs (Visible Fill)
EMA Macro Fast (Default 50): Medium-term institutional bias line
EMA Macro Slow (Default 100): Long-term structural support/resistance line
Micro Signal EMAs (Visible Fill Default ON)
EMA Micro Fast (Default 8): Short-term momentum leader
EMA Micro Slow (Default 12): Short-term trigger line for entry signals
Show EMA 8/12 Fill: Toggle colored fill between micro EMAs (green uptrend, red downtrend)
Visual Settings
Show Dashboard: Toggle information panel display in top-right corner
Alert Configuration
Alert on Micro Signals: Receive alerts for 8/12 crossover entry signals
Alert on Macro Crossovers: Receive alerts for 50/100 structural change signals
Indicator Type: Overlay
Best Timeframes: 4H, Daily, Weekly
Market Suitability: Universal (trending liquid markets)
Repainting: Optional (Non-Repaint Mode available)
Alerts: Fully supported (4 distinct alert types)
DISCLAIMER
This indicator is a technical analysis tool designed to identify trend alignment and potential entry points based on Exponential Moving Average relationships. It does not guarantee profitable trades and should be used as part of a comprehensive trading plan that includes proper risk management, position sizing, and fundamental analysis where appropriate.
Past performance of any trend-following system does not predict future results. The indicator works best in trending market conditions and may generate false signals during extended ranging or highly volatile transitional periods. Market conditions change, and no technical indicator can predict all future price movements.
Always backtest any strategy on your chosen asset and timeframe before risking real capital. Never risk more than you can afford to lose. Trading involves substantial risk of loss and is not suitable for all investors. This indicator is an educational and analytical tool—all trading decisions and their consequences remain solely the responsibility of the user.
مؤشر

3EMA Filter [LTW]📈 3EMA Filter
This indicator visualizes real-time trend intensity using a multi-timeframe Exponential Moving Average (EMA) structure, projects future price trajectories based on momentum slopes, and quantifies fast-to-slow moving average divergence via an integrated real-time dashboard.
Instead of looking backward at static historical support and resistance levels on lower timeframes, you can instantly read real-time trend acceleration and price divergence right here and now to build powerful, forward-looking trading strategies.
⚙️ Key Features & Customization
▪️ Dynamic EMA Ribbon & Crossover Signals (Default: 50, 100, 200)
Utilizes dynamic colored ribbon filling between EMA 1, 2, and 3 to provide an immediate visual assessment of trend alignment (bullish/bearish) and momentum strength. Highlights Golden Cross and Dead Cross events between the fast and middle lines with distinct markers and optional background highlighting.
▪️ Slope-Based Future Trajectory Projection
Calculates the current momentum slope of each moving average at the latest bar to project future EMA trajectories 'n' bars forward. Allows traders to visually gauge whether trend momentum is currently accelerating or flattening out, aiding in the early detection of potential inflection points and trend reversals. (Supports customizable styles: Solid, Dotted, Dashed).
▪️ High-Visibility Divergence Dashboard
Automatically calculates and displays the Current, Maximum, and Minimum price divergence (%) between the fast moving average (EMA1) and the slow moving average (EMA3) over a selectable timeframe (1D, 1W, 1M). Engineered with a crisp, high-contrast design to immediately evaluate overbought and oversold market pressure across both Dark and Light themes.
▪️ Keep Charts Clean & Focus on Operability (Limit Display to Recent "n" Bars)
We approached this feature with the mindset of focusing on practical 'Operability' and responsiveness in real-time trading rather than just simple readability. By limiting the indicator display to the most recent 'n' bars, it reduces computational waste and eliminates visual clutter from historical bars, allowing you to react immediately to pure candlestick price action.
💡 How to Use & Trading Strategies
Provides a clean, forward-looking analytical framework that eliminates hindsight bias on lower timeframes.
1. Focusing on Acceleration & Divergence on Lower Timeframes
Unless you are analyzing macro moving averages like the 200-day or 200-week MAs on daily or weekly charts, tracing historical MA support and resistance lines on lower timeframes (such as intraday minute or hourly charts) often offers little practical synergy in real-time trading. This indicator departs from static historical mapping and is used strictly to read real-time "EMA Divergence" and the "Momentum Acceleration" of the current trend.
2. Preventing Curve-Fitting & Hindsight Bias (Hidden Picture Puzzles)
The integrated Bar Limit feature is deliberately designed to stop traders from falling into the trap of "playing hidden picture puzzles"—retroactively forcing indicators to fit historical price action. It eliminates hindsight bias, ensuring your analytical focus remains 100% locked on present market dynamics and future trajectory projections.
📌 Summary
A practical, all-in-one indicator designed to shift your focus away from static historical support/resistance and toward real-time trend acceleration and divergence. Through slope-based future projections, a high-visibility divergence dashboard, and an operability-focused Bar Limit feature, you can eliminate hindsight bias and trade with high reliability by focusing entirely on active market dynamics. مؤشر

VWAP Suite | Trend & Mean Reversion with Adaptive FiltersOverview
This strategy is built around a custom volume-weighted average price (VWAP) engine with standard-deviation bands, and gives you two complete, independently-tuned trading modes in a single script:
Trend Following — trades breakouts/crossovers in the direction of VWAP's own momentum
Mean Reversion — trades stretched price extremes back toward VWAP, filtered for low-trend conditions
Rather than assuming one style of market behavior, this script lets you choose the mode that matches what you're trading — a trending momentum stock, or a calmer range-bound one — and includes a layered filter system designed to keep you out of low-quality setups in either mode.
How VWAP Is Calculated
VWAP weights price by the volume traded at that price, rather than treating all price ticks equally — so it reflects where the real trading activity concentrated, not just a simple average.
This script computes it manually (not via a black-box built-in), which allows for flexible anchoring:
Session — resets daily (best for lower timeframes, intraday charts)
Week — resets weekly (better for 1H–4H charts)
Month — resets monthly (for swing/position-style testing)
Standard deviation bands are plotted at three levels (1, 2, and 3 std dev by default), giving visual reference points for "normal," "stretched," and "extreme" price deviation from the volume-weighted average.
Strategy Modes
Trend Following
Looks for price to break through VWAP (or an outer band) in a direction confirmed by VWAP's own slope — the idea being that VWAP acting as support/resistance and trending in your trade's direction adds conviction to the move.
Three selectable entry triggers: VWAP Cross, Band 1 Break, Band 2 Break
VWAP slope filter (with adjustable lookback and minimum slope %) to avoid trading flat/directionless VWAP
Take-profit targets at the opposite band or at VWAP itself
Best suited for: momentum-driven, higher-volatility names where trends persist once established.
Mean Reversion
Looks for price to overextend beyond a chosen band, then trades the snap-back toward VWAP. Includes an ADX filter to specifically avoid taking reversion trades during strongly trending conditions (where "buying the dip" or "fading the rip" is historically much riskier).
Three selectable entry triggers: Outside Band, Band Cross, Band Reclaim (wick-and-recover confirmation — the most conservative/false-signal-resistant option)
ADX filter caps entries below a configurable trend-strength threshold
Maximum VWAP deviation cap (in ATR units) to avoid catching a falling knife on extreme extensions
Best suited for: range-bound, lower-volatility names where price oscillates predictably around a stable average.
Filter System (False-Signal Reduction)
Every entry — in either mode — passes through a shared base filter layer before mode-specific logic is applied:
Volume Filter: Requires volume above a multiple of its recent average, filtering out low-conviction moves
Volatility (ATR) Filter: Requires a minimum ATR (as % of price) to avoid dead, directionless conditions
Band Width Filter: Avoids trading when bands are unusually tight (a sign of indecision and high whipsaw risk)
VWAP Slope Filter (Trend mode): Confirms VWAP itself is moving meaningfully in the trade direction, not just flat
ADX Filter (Mean Reversion mode): Blocks entries when the broader trend is too strong to safely fade
Each filter can be toggled independently, so you can isolate which conditions matter most for the instrument and timeframe you're trading.
Optional Confluence Layer
A secondary indicator can be layered on top of either mode:
RSI — for trend mode, confirms momentum direction; for mean reversion, confirms oversold/overbought exhaustion via a crossover trigger
EMA Regime (200-period default) — acts as a higher-level trend filter, only allowing longs above the EMA and shorts below it
Risk Management
Risk-based position sizing — position size is calculated from your risk % input divided by stop distance, not a fixed share count
Maximum position size cap (% of equity) — acts as a hard ceiling so tight-stop trades can't produce oversized positions
Two stop-loss methods — ATR-multiple based, or band-based (using the outer bands as structural stop references)
Two take-profit methods — opposite band target, or VWAP itself
Optional fixed take-profit lock — freezes the target price at entry rather than letting it drift with VWAP
Optional break-even stop — moves the stop to entry once a configurable ATR-multiple of profit is reached
Visuals
VWAP line color-shifts between two colors depending on whether price is above or below it
Three-tier shaded band system for at-a-glance visual reference of price deviation
Entry markers (triangle up/down) plotted directly on signal bars
Background shading during filtered/no-trade conditions, so you can visually see why the strategy stayed flat
Important Notes Before Use
Match your anchor period to your timeframe. Session anchoring is built for intraday charts; on higher timeframes (2H+), Week or Month anchoring will produce more reliable slope readings, since Session resets can occur every few bars and distort trend measurement.
Backtest results include commission assumptions but not slippage — adjust the commission/slippage settings in the strategy properties to reflect your actual broker before drawing conclusions from performance metrics.
This script is provided for research and educational purposes. Past performance in backtesting does not guarantee future results. Always forward-test on a paper account before committing real capital. استراتيجية

EMA Momentum & Cross EngineIndicator Summary: EMA Momentum & Cross Engine
This indicator is an advanced, fully customizable trend and momentum tool built around the 20 and 50 Exponential Moving Averages (EMAs). Instead of solely relying on traditional, lagging crossover signals, it proactively identifies high-probability reversals by mathematically measuring the tension between the moving averages.
Core Features:
Early Reversal Detection (DIV Signals): It measures the distance between the 20 and 50 EMA. When this distance becomes severely overextended (exhaustion) and suddenly snaps back with high velocity, it fires early "BUY DIV" or "SELL DIV" signals before a crossover ever happens.
Standard Crossovers: Plots standard trend-following buy and sell signals when the EMAs actually cross.
Smart Filtering Engine: Includes a built-in cooldown timer and max-signal limiters. This prevents rapid-fire false signals during choppy, sideways markets and keeps the chart perfectly clean.
Deep Customization: Every visual element is customizable. You can change the text, colors, label sizes, and even the precise mathematical distance the labels sit away from the candle wicks. It also features floating, dynamic labels at the end of the EMA lines so you never lose track of them.
Why ATR-Normalized Divergence is Better Than Slope
When trying to catch early trend changes or pullbacks, measuring the Average True Range (ATR) normalized spread between the EMAs is vastly superior to just measuring the slope of the lines. Here is why:
1. It Eliminates the "Visual Illusion"
The slope (angle) of a moving average on your screen is an illusion. If you zoom out or stretch the y-axis of your chart, a "flat" slope suddenly looks incredibly steep. Measuring the ATR spread relies on hard, objective math—not how your monitor happens to be scaled at that exact second.
2. It Automatically Adapts to Market Volatility
A 10-point distance between the 20 and 50 EMA means something completely different depending on the market environment.
If market volatility is dead, a 10-point gap is a massive, overextended move.
If the market is wildly volatile (like during a major news event), a 10-point gap is just normal background noise.
By dividing the EMA distance by the ATR, the indicator standardizes the measurement. A value of 1.0 means the EMAs are stretched exactly 1x the normal volatility of the current market, ensuring your signals are accurate regardless of whether the market is slow or fast.
3. It Measures the "Rubber Band" Tension
Slope only tells you the direction the market is heading. ATR Divergence tells you the tension. Markets act like rubber bands—they can only stretch so far from their mean (the 50 EMA) before they snap back. By tracking the exact moment that ATR-normalized rubber band is stretched to its limit and begins to shrink (the velocity delta), you get a high-probability entry for a mean-reversion trade or a deep pullback. مؤشر

Astro Bias Dashboard 🧭 ASTRO BIAS DASHBOARD
A one-glance morning dashboard that combines five classical astronomical cycles into a single daily bias score — and then checks that bias against live price action before suggesting anything.
━━━ HOW IT WORKS ━━━
The script computes real astronomical values using mean-longitude formulas (J2000 epoch):
- Moon phase — waxing or waning, with illumination percent
- Sun-Moon angle — harmony (trine/sextile), tension (square/opposition), or neutral
- Mercury retrograde — approximated from the 115.88-day synodic cycle
- Eclipse season — Sun's proximity to the lunar nodes
- Planetary hour (hora) — Chaldean sequence from a user-set sunrise time
The first four factors are captured once at the start of each session and stay FIXED for the whole day (score out of 4). This is deliberate: a daily bias that flickers intrabar is useless. Only the hora row updates hourly, because it is a timing tool by design — and it is intentionally excluded from the score.
The dashboard then adds a live reality check: price versus EMA 50. A final Verdict row compares the fixed astro bias with the live trend:
- ALIGNED — astro bias and price agree
- CONFLICT — price is moving against the bias. Price always wins; the dashboard tells you to stand aside.
━━━ HOW TO USE ━━━
1. Check the dashboard once at market open — the bias is fixed for the day.
2. Trade only in the Verdict row's direction. On CONFLICT, reduce size or stay flat.
3. Use the hora row for entry timing: benefic horas (Moon, Mercury, Venus, Jupiter) are preferred entry windows.
4. Combine with your own levels and setups — this is a context filter, not an entry signal.
Alerts included: daily bias bullish/caution, hora change, astro-price conflict, astro-price alignment.
━━━ SETTINGS ━━━
Sunrise hour, dashboard position (8 placements), text size, EMA 50 plot toggle and color, trade-plan rows toggle.
━━━ NOTES & ORIGINALITY ━━━
All astronomical values are computed from scratch inside Pine using mean-longitude approximations — no external data, no libraries, no reused code. Accuracy is well within the tolerance needed for cycle-timing work, though exact panchang timings may differ by a few hours.
This tool treats astronomical cycles strictly as a timing reference. It does not predict market direction, and nothing here is financial advice. Always confirm with price action and manage risk. مؤشر

مؤشر

مؤشر

مؤشر

مؤشر

مؤشر

Multi EMA + Forecast (5,30,60,120,250,500)Multi-Timeframe (MTF) EMA Group
Overview
The Multi-Timeframe (MTF) EMA Group is a powerful trend-following indicator designed to give traders a clearer perspective on market direction by projecting higher-timeframe data onto their current chart. By combining a cluster of Exponential Moving Averages (EMAs) with Multi-Timeframe capabilities, this tool helps you filter out market noise and align your entries with the macro trend.
Whether you are a scalper looking for higher-timeframe context or a swing trader managing dynamic support and resistance, this indicator provides a clean, customizable visual ribbon to guide your bias.
Key Features
Multi-Timeframe (MTF) Selection: Plot EMAs from any timeframe (e.g., 1-Hour, 4-Hour, Daily) onto your current working chart (e.g., 5-Minute, 15-Minute).
Customizable EMA Cluster: Includes multiple EMA inputs (e.g., 5, 9, 20, 50, 100, 200) allowing you to build a dense "ribbon" or a simple two-line crossover system.
Trend Visualizer: When the shorter EMAs are stacked above the longer EMAs, the ribbon indicates a bullish trend. When the order is reversed, it indicates a bearish trend. The widening of the group signifies trend strength, while a pinching or twisting group warns of consolidation or a potential reversal.
Non-Repainting MTF Data: Built using standard TradingView MTF protocols to ensure the data is accurate and does not repaint once the higher timeframe candle closes.
How to Use It in Your Trading
Trend Alignment: Avoid trading against the dominant trend. For example, if you are trading on a 15-minute chart, set the indicator's timeframe to 1-Hour or 4-Hour. Only take long setups when the price is above the higher-timeframe EMA group, and short setups when it is below.
Dynamic Support & Resistance: A tightly clustered group of EMAs often acts as a strong zone of dynamic support in an uptrend or resistance in a downtrend. Look for price to pull back into the EMA "value area" for optimal trade entries.
Crossovers & Reversals: Watch for the shortest EMA in the group to cross through the longer EMAs as an early warning sign that the macro trend might be shifting.
Customization Options
Resolution/Timeframe: Easily toggle the timeframe drop-down in the settings to pull data from your desired chart interval.
Lengths: Fully adjustable lengths for every EMA in the group to suit your specific trading style.
Colors & Styling: Customize the thickness and color gradients of the lines to make the ribbon visually intuitive on both dark and light chart themes.
Disclaimer: This indicator is for educational and analytical purposes only. Past performance does not guarantee future results. Always combine moving averages with other forms of technical analysis, such as price action and volume, before making trading decisions. مؤشر

مؤشر
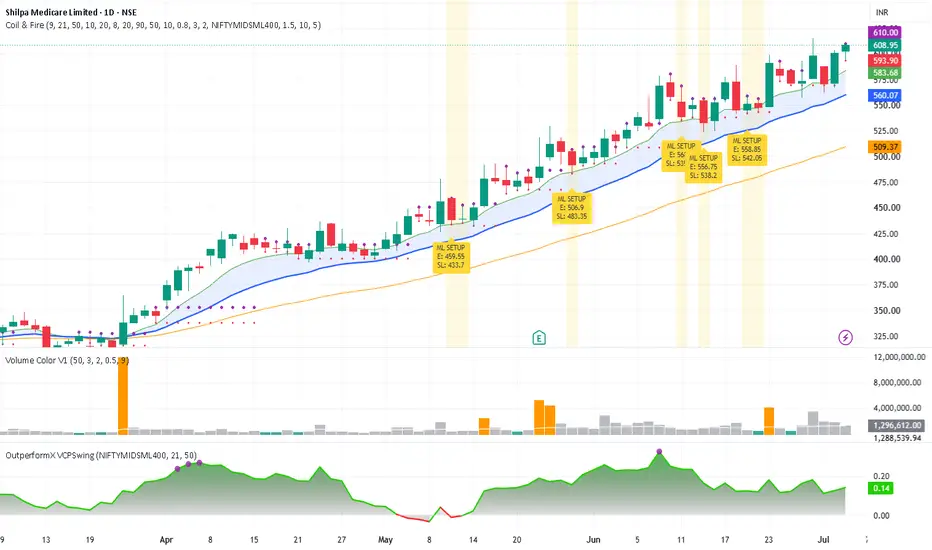
Coil & Fire - Ashish*Updated version of Momentum Scanner*
Finds stocks that had a strong explosive move (EP candle), are now coiling quietly near their EMAs, and marks the exact entry and stop-loss levels based on the most recent low-volume healthy-dip candle.
How it works:
Screens for stocks with a recent 8%+ single-day move that are outperforming their benchmark since that move, holding above the EMA9/21 cloud with the trend structure intact, and showing genuinely quiet volume on the pullback. When all conditions align, it marks a teal bar — a low-volume healthy-dip candle sitting within 5% above EMA9. The high of that bar is your entry. The low is your stop-loss. Purple dots show the entry level. Red dots show the stop.
Orange background = price has crossed the entry level. Yellow background = setup is valid, waiting for the trigger.
What's different from Momentum Scanner:
Entry and stop-loss are now anchored to the most recent teal bar rather than a historical coil-high level, so levels are always close to current price. Volume comparison for the teal bar now uses a 10-day average instead of 50-day, making it more responsive to recent trading activity rather than a long historical baseline.
Note: Indicators are tools, not oracles — every signal still requires human judgment, risk management, and context before any trade is taken. مؤشر

Adaptive S/R Box Zones with Dynamic Stop Loss & EMA FilterTitle: Adaptive S/R Box Zones with Dynamic Stop Loss & EMA Filter
Description:
This indicator is an advanced tool designed to automatically identify key Support and Resistance (S/R) levels by blending momentum, volatility, and structural pivot points. The core objective of the script is to visualize asymmetric risk zones (Stop Loss zones) and filter out false breakouts using an integrated EMA momentum filter.
How it works:
S/R Detection Logic: Levels are not derived from simple highs and lows. The script utilizes a sophisticated algorithm that dynamically combines the RSI (Relative Strength Index) to spot extreme overbought/oversold conditions, a HMA-based CMO (Chande Momentum Oscillator) for momentum confirmation, and historical Close Pivots.
Asymmetric SL Zones (Boxes): Instead of standard symmetric lines that often distort spatial risk, the indicator renders dynamic box shapes. The height of these zones automatically adapts to the market's current volatility using the ATR (Average True Range).
The Resistance Zone expands asymmetrically upward from the level, offering a clear visual map for placing Stop Losses on Short setups.
The Support Zone expands asymmetrically downward from the level, defining the logical Stop Loss area for Long setups.
EMA Momentum Filter & Trigger: The script features an optional EMA crossover filter. When enabled, the detection of a new S/R zone acts as a dynamic "setup alert", while the actual BUY or SELL signal triggers only when the price breaks through the EMA line, confirming directional momentum.
Key Features & Inputs:
Zone Height (ATR Multiplier): Controls the thickness of the risk zones based on market volatility.
S/R Timeframe: Multi-timeframe (MTF) functionality to plot higher time frame levels onto your current chart.
Signal Trigger Mode: Toggle between On Candle Close and After Candle Close (waits for the candle to seal to prevent repainting).
EMA Filter Toggle: Can be fully deactivated if you prefer to receive raw signals immediately upon the formation of S/R levels. مؤشر

مؤشر

مؤشر

مؤشر

مؤشر

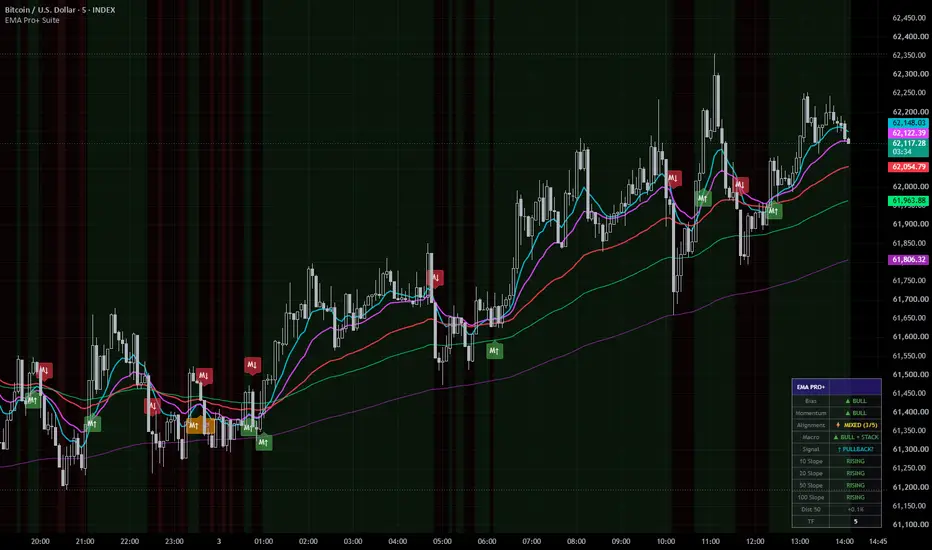
EMA Pro+ Suite# EMA Pro+ Suite
**A multi-layer EMA confluence framework for reading market state at a glance.**
---
## What It Is
EMA Pro+ Suite is an overlay indicator built around three exponential moving averages — a Fast (10), Mid (20), and Slow (50) EMA — organized into a structured three-layer state engine that tells you the current market regime, momentum direction, and whether price is in or out of alignment with that regime. Rather than treating each EMA in isolation, the suite reads them together as a system and surfaces a single, coherent market state at all times.
A corner dashboard table updates in real time, giving you an instant read on bias, momentum, alignment, EMA slopes, and price extension — without having to scan the chart manually.
---
## How It Works
The indicator evaluates three distinct layers on every bar:
**Layer 1 — Bias (Trend Regime)**
Defined by price relative to the 50 EMA. Price above = bullish bias. Price below = bearish bias. This is the macro filter — it determines which direction setups should be taken in.
**Layer 2 — Momentum**
Defined by the 10 EMA relative to the 20 EMA. When the fast EMA is above the mid EMA, momentum is bullish. When below, momentum is bearish. Momentum alignment with bias is the confirmation layer.
**Layer 3 — Price vs Fast EMA**
When bias and momentum are aligned but price is on the wrong side of the 10 EMA, the indicator flags a potential pullback or exhaustion condition. In a full bull regime, price dipping below the 10 EMA may represent a high-quality entry opportunity — or an early warning of trend exhaustion. Context determines which.
**Slope Engine**
Each EMA is evaluated for slope using a configurable lookback. RISING / FLAT / FALLING is displayed per EMA in the dashboard. A momentum flip on flat EMAs carries significantly less weight than one on rising or falling EMAs — this is critical for filtering out noise in ranging conditions.
**Price Distance from 50 EMA**
Tracks how extended price is from the slow EMA as a percentage. Large positive or negative readings flag mean reversion risk.
**Bar & Background Coloring**
- Green background + green bars = full bull alignment
- Red background + red bars = full bear alignment
- Yellow bars = conflicting bias and momentum (mixed / transitional state)
- Aqua bars = bull regime, price pulling back below 10 EMA
- Fuchsia bars = bear regime, price popping above 10 EMA
**Cross Signals**
- `M↑` (green) — 10 EMA crossed above 20 EMA in bull zone. Aligned, higher conviction.
- `M↓` (red) — 10 EMA crossed below 20 EMA in bear zone. Aligned, higher conviction.
- `M↑ 🐻` (orange) — Bullish momentum flip firing in bear zone. Counter-trend, lower conviction.
- `M↓ 🐂` (orange) — Bearish momentum flip firing in bull zone. Counter-trend, lower conviction.
**Multi-Timeframe Support**
All three EMAs can be calculated on a higher timeframe and plotted on the current chart. Use this to anchor your bias to the HTF structure while reading entries on a lower timeframe.
---
## Possible Ways to Use It
**Trend Following**
Wait for full alignment — green background, green bars, all three slopes RISING. Only look for long entries. Use the 10 EMA pullback (aqua bars) as a potential entry trigger. Reverse logic for shorts.
**Momentum Flip Entries**
Use aligned `M↑` / `M↓` signals (green/red) as entry triggers when bias and slope confirm. Discard or fade counter-trend orange signals unless you have a specific reason to trade against the regime.
**Regime Filter for Other Systems**
Use the bias layer (price vs 50 EMA) as a filter for another strategy. Only take long signals from your primary system when EMA Pro+ shows bull bias, and vice versa.
**HTF Confluence**
Set the EMA Timeframe to a higher timeframe (e.g. 4H or Daily) while trading on a 15m or 1H chart. The dashboard will show the HTF regime, giving you a structural anchor for your intraday reads.
**Avoiding Chop**
When all three slopes read FLAT and bars are yellow (mixed alignment), the market is in a transitional or ranging state. Consider standing aside or reducing position size until a clear regime re-establishes.
**Mean Reversion Awareness**
When Dist 50 shows a large positive or negative reading, price is extended from the slow EMA. In trending markets this can persist — but it raises the bar for adding to positions and flags potential snapback risk.
---
## Settings
| Setting | Description |
|---|---|
| EMA Timeframe | Blank = current chart timeframe. Enter any TF (e.g. 60, 240, D) for MTF mode. |
| Fast / Mid / Slow EMA Length | Default 10 / 20 / 50. Fully adjustable. |
| Slope Lookback | Number of bars used to calculate EMA slope. Increase on lower timeframes to reduce flat readings. |
| Show EMA Lines | Toggle the three EMA plots. |
| Show Bias Background | Toggle the green/red background tint. |
| Color Bars by State | Toggle bar coloring. |
| Show Cross Signals | Toggle M↑ / M↓ labels on chart. |
| Show Dashboard Table | Toggle the corner HUD. |
| Table Position | Top Right / Top Left / Bottom Right / Bottom Left. |
| Bar Close Reminder Alert | Fires a reminder alert on every bar close to check the setup. |
---
## Alerts
- Momentum Flip Bullish — Bull Zone (aligned)
- Momentum Flip Bullish — Bear Zone (counter-trend)
- Momentum Flip Bearish — Bear Zone (aligned)
- Momentum Flip Bearish — Bull Zone (counter-trend)
- Price Reclaimed 50 EMA (bias flipped bullish)
- Price Lost 50 EMA (bias flipped bearish)
- Bull Pullback Signal (bull regime, price below 10 EMA)
- Bear Pullback Signal (bear regime, price above 10 EMA)
- Bar Close Reminder
---
## Disclaimer
This indicator is provided for educational and informational purposes only. It does not constitute financial advice, investment advice, or a recommendation to buy or sell any asset. All trading involves substantial risk of loss. Past performance of any signal, strategy, or system is not indicative of future results.
EMA Pro+ Suite is a tool to assist with technical analysis — it does not predict price, guarantee accuracy, or remove the inherent uncertainty of financial markets. No indicator eliminates risk. You are solely responsible for your own trading decisions.
Always conduct your own research, apply proper risk management, and consider consulting a licensed financial professional before making any trading decisions. Only trade with capital you can afford to lose. مؤشر

[Quadapt] Machine Learning Trader Machine Learning Trader
A multi-component Pine Script v6 trading assistant combining a kernel-regression MLMA trend model, dual-length signal envelopes, order block context, retest scoring, adaptive Fibonacci targets, stop loss projection, signal quality filtering, and optional webhook automation.
## Description
Machine Learning Trader is a full-featured market structure and signal confluence indicator built around a Machine Learning Moving Average (MLMA) trend model. It is designed to help traders analyze trend direction, signal quality, order block context, potential retest areas, and adaptive take-profit / stop-loss levels from one chart overlay.
The script is not a black-box strategy or a guaranteed signal generator. It is a discretionary analysis tool that combines several independent market-context modules into one workflow so traders can compare trend, volatility, structure, momentum, and risk levels before making a decision.
### What Makes This Script Different
The core of the indicator is a kernel-regression MLMA engine. Instead of using only a classic moving average, the script builds a regression-style trend estimate using configurable kernel functions and regression modes. This produces a smoothed adaptive trend line and cloud that can be used as a directional context filter.
The MLMA is combined with:
- dual-length nonlinear signal envelopes,
- market structure and order block detection,
- intelligent retest scoring,
- adaptive Fibonacci take-profit projection,
- stop-loss projection,
- multi-timeframe MLMA trend alignment,
- signal quality filtering,
- clustering prevention,
- market regime adaptation,
- optional webhook payload generation.
The result is a confluence-focused indicator: a buy or sell marker is not treated as useful by itself. It is evaluated against the MLMA trend, recent order blocks, volatility regime, momentum, volume, cloud position, and multi-timeframe alignment.
### MLMA Trend Engine
The MLMA module calculates a machine-learning-inspired moving average using kernel methods. The script supports several kernel types, including:
- RBF,
- Linear,
- Polynomial,
- Sigmoid,
- Laplacian,
- Matern,
- Periodic,
- Trigo.
The regression mode can be configured as:
- GPR,
- KRR,
- KPCR,
- SVR,
- Kernel Smoothing,
- Adaptive RQ.
The MLMA output forms the main trend reference. The script also builds upper and lower MLMA bands using an error envelope derived from average absolute deviation around the MLMA output. These bands are used for the cloud, trend state, signal validation, and context scoring.
When the MLMA state is bullish, the script treats price behavior above or near the bullish support side of the cloud as more constructive. When the MLMA state is bearish, the script treats price behavior below or near the resistance side of the cloud as more defensive.
### Instrument-Agnostic Envelope Logic
The signal envelope section is designed to work across instruments with very different price scales, including forex pairs, JPY pairs, metals, oil, gas, indices, and crypto. The nonlinear envelope transform keeps the original algorithmic shape, but price distance is normalized relative to the instrument's local price level before the transform and restored back into price units afterward.
This matters because a raw price move on EURUSD, GBPJPY, XAUUSD, or XNGUSD has a very different numerical size. Normalizing the envelope distance helps the signal engine behave more consistently across instruments instead of being tuned only for one price scale.
### Dual-Length Signal Engine
The script calculates two separate signal envelopes:
- Primary Length: the slower, broader signal model.
- Secondary Length: the faster signal model.
The dual-length system can run in three modes:
- Independent: either length can produce a signal.
- Consensus: both lengths must agree.
- Primary Priority: only the primary length drives the final signal.
This allows traders to choose between sensitivity and confirmation. Independent mode produces more signals, consensus mode is stricter, and primary priority keeps the chart focused on the slower model.
Signal labels can show regular and stronger buy/sell conditions. When both lengths align in Independent mode, the script can also mark BOTH signals.
### Order Block Detection
The order block module searches for volatility-based bullish and bearish blocks using candle direction, volatility expansion, momentum, optional volume confirmation, and trend alignment. Blocks can be displayed as chart boxes with volume and quality information.
Order block detection includes configurable controls for:
- volatility method,
- volatility length,
- smoothing length,
- minimum separation between blocks,
- maximum blocks per direction,
- consolidation filtering,
- trend filtering,
- volume filtering,
- momentum filtering,
- block display style.
The script assigns order block quality using factors such as block size, directional pressure, displacement, market structure, MLMA trend context, and volume. Higher-quality blocks can be emphasized while weaker blocks can be faded.
### Retest Detection
The retest engine evaluates whether price has returned to a recent order block in a meaningful way. Retests can be scored using:
- block strength,
- clean movement away from the block,
- volume confirmation,
- MLMA trend alignment,
- volatility regime,
- reaction quality near the block.
Retest labels can be displayed as simple `R` markers. Strong and weak retests can be controlled separately, and optional percentage display can show the retest confidence score.
### Adaptive Fibonacci Take Profit Levels
The script can project take-profit levels after valid buy or sell signals. The TP engine supports several methods:
- Dynamic ATR,
- Swing-Based,
- Adaptive Swing,
- Heuristic.
It can display multiple Fibonacci extension targets, optional confluence zones, and TP hit status. The TP table shows the current trade direction, entry reference, target levels, stop loss, and active status.
The TP logic is filtered through MLMA and order block context. For example, a buy signal is considered valid when MLMA context supports the buy, or when price is near a supportive bullish order block. This helps reduce target plotting during low-quality or conflicting conditions.
### Stop Loss Projection
The stop-loss module supports:
- ATR-based stops,
- swing-based stops,
- order-block-based stops,
- percentage-based stops.
Stop levels are plotted only after a valid trade setup is detected. The script also tracks whether price has reached the projected stop or take-profit levels.
### Signal Quality Engine
The signal quality engine scores buy and sell setups before final display. The quality score considers:
- MLMA trend context,
- price position relative to the MLMA,
- multi-timeframe alignment,
- order block support or opposition,
- volume quality,
- volatility regime,
- candle body behavior,
- momentum,
- choppy or no-trade conditions,
- cloud width and MLMA slope,
- recent loss-streak penalty logic.
Signals below the configured minimum score can be filtered out. If desired, rejected signals can also be displayed for research and tuning.
### Advanced Signal Filtering
The script includes adaptive clustering prevention and regime-aware filtering.
Clustering prevention reduces repeated signals in the same area by using a time window, ATR-based price window, decay factor, and maximum cluster count.
Regime-aware filtering adjusts confidence behavior using recent market context, including price movement, volatility trend, and volume trend. This helps the script respond differently in ranging, trending, quiet, and volatile periods.
### Multi-Timeframe Trend Table
The MLMA trend table summarizes the current trend state and several higher/lower timeframe states:
- current chart,
- 15m,
- 30m,
- 1H,
- 4H,
- 1D,
- 1W.
This table is useful for quickly checking whether the current signal is aligned with broader market direction.
### Market Exhaustion
The exhaustion module uses RSI, price extension, momentum change, and volume behavior to identify possible bullish or bearish exhaustion. Exhaustion markers are intended as context warnings, not standalone reversal signals.
### Webhook Automation
Optional webhook alerts can send structured payloads for external automation or journaling. The payload can include:
- symbol,
- ticker ID,
- timeframe,
- event type,
- action,
- account tag,
- risk percent,
- order type,
- entry,
- stop loss,
- TP levels,
- quality score,
- MLMA trend,
- bar time.
Webhook use is optional and should be tested privately before live use.
### Alerts Included
The script includes alert conditions for:
- ML Strong Buy Signal,
- ML Strong Sell Signal,
- ML Buy Signal,
- ML Sell Signal,
- rejected quality signals,
- wedge pattern,
- BOTH length signal,
- bullish order block,
- bearish order block,
- bullish exhaustion,
- bearish exhaustion,
- valid enhanced Fibonacci buy/sell signals,
- invalid buy/sell signals,
- Fibonacci TP hit,
- TP/SL levels set,
- order block retest,
- signal clustering,
- market regime change,
- advanced filtering active.
### How To Use
1. Add the indicator to a clean chart.
2. Start with the default settings.
3. Use the MLMA cloud and trend table to understand directional context.
4. Watch for buy/sell labels only when they align with trend, order block, and quality context.
5. Use order block boxes and retest markers to identify possible reaction zones.
6. Use TP/SL projections as planning references, not as automatic trade instructions.
7. Tune Primary Length, Secondary Length, Signal Mode, and Signal Quality settings for the instrument and timeframe you trade.
8. If using alerts or webhooks, test them on paper or in a private environment first.
### Practical Notes
- Lower lengths are more responsive but can produce more noise.
- Higher lengths are smoother but react later.
- Consensus mode is stricter than Independent mode.
- The Signal Quality Engine can remove many low-context signals.
- The Order Block module is most useful when combined with MLMA trend context.
- TP and SL levels are projections based on the selected method; they are not guarantees that price will reach those levels.
- Exhaustion markers are context warnings and should be confirmed with structure, trend, and volatility.
### Limitations
This indicator does not predict the future. It organizes market context using mathematical filters, kernel regression, volatility logic, order block heuristics, and signal-quality rules. It can still produce false signals, especially during news events, illiquid periods, low-volume sessions, strong trend exhaustion, sudden reversals, or choppy markets.
No indicator should be used alone. Traders should combine this tool with their own risk management, market understanding, and independent confirmation. Past chart behavior does not guarantee future results.
مؤشر