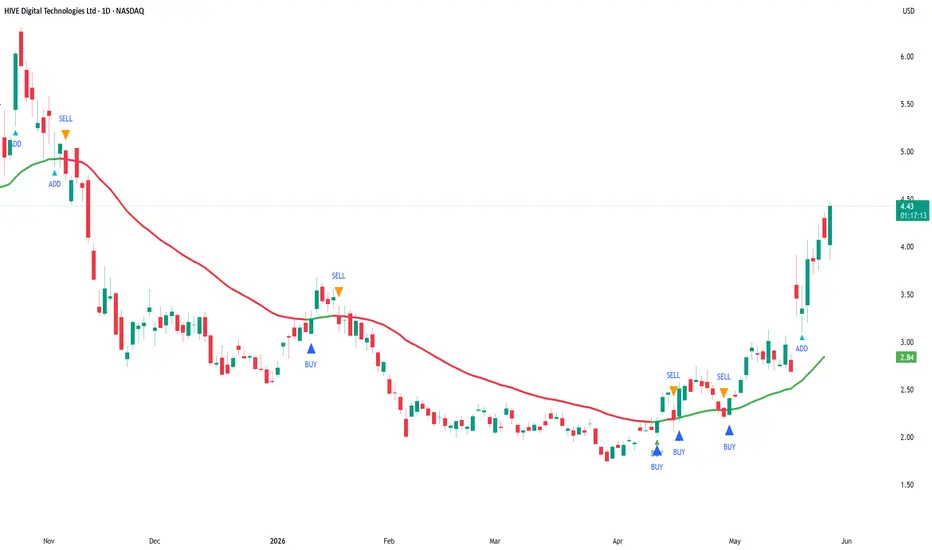
Guppy MMA Mean Reversion SignalsThe Guppy MMA Mean Reversion System is a trend-following mean reversion tool designed to identify high-probability pullbacks within established trends. By combining the classic Guppy Multiple Moving Average (GMMA) with volatility, volume, and momentum filters, this script aims to reduce the "noise" often found in standard moving average cross strategies.
The Concept: Why this Works
Standard GMMA indicators are excellent for visualizing trend strength but often lack precise entry triggers or filters to avoid entering during periods of low volume or extreme exhaustion. This script addresses these limitations by integrating four distinct analytical components:
- GMMA Ribbons (Trend & Reversion Zones) : We use two groups of EMAs (Short-term and Long-term). The Long-term group defines the "institutional" trend. Our entry logic looks for price to revert from the short-term trend back into the long-term trend zone—a classic sign of a healthy pullback.
- CVD Confluence (Volume Confirmation) : Using Cumulative Volume Delta (CVD) based on candle-body delta approximations, the script ensures that volume flow supports the entry direction. This prevents entering pullbacks that lack the necessary buying/selling pressure to resume the trend.
- ATR Volatility Filter (Statistical Spacing) : To avoid "choppy" entries, this filter requires the price to be at a statistically significant distance from the EMA based on market volatility (ATR). This ensures you are entering at a true "discount" rather than in a sideways market.
- RSI Exhaustion Filter (Momentum Safety) : We utilize RSI to ensure that a reversion hasn't reached an overextended state. For example, it prevents buying a pullback if the RSI indicates the asset is already in an overbought exhaustion phase.
How to Use
- Long Entries (Green Circles) : Triggers when the Long-term ribbon is bullish, and price pulls back to touch the Long-term EMA group, provided the CVD, ATR, and RSI conditions are met.
- Short Entries (Red Circles) : Triggers when the Long-term ribbon is bearish, and price rallies to touch the Long-term EMA group, filtered by volume and momentum.
- Exits (Labels) : Exit signals appear when price successfully reverts back to the "fast" Short-term group, marking the completion of the mean reversion move.
Key Features & Customization
- Independent Toggles : You can independently turn on/off buy signals, sell signals, and their respective exits to suit your specific trading style (e.g., only trading the long side).
- Signal Cooldown : Includes a customizable "bar count" cooldown to prevent multiple overlapping signals during high-volatility periods.
- Comprehensive Settings : Fully adjustable EMA lengths, ATR multipliers, and RSI thresholds to adapt the system to different timeframes and asset classes (Crypto, Forex, Stocks).
Settings Guide
- Use ATR Filter : Increase the multiplier for more conservative, wider entries.
- Use CVD Filter : Enable to ensure volume delta is trending with your entry.
- Use RSI Filter : Helps avoid "catching falling knives" by filtering out trades during extreme momentum spikes. مؤشر

مؤشر

مؤشر

EMA Ribbon with ATR ExtensionsThis indicator is an EMA ribbon framework combined with multi-timeframe trend structure and volatility-normalized distance measurements using ATR.
The core component is a configurable exponential moving average ribbon, allowing multiple EMA lengths to be plotted simultaneously across different timeframes. This includes both intraday EMAs and optional higher-timeframe EMAs such as daily and weekly periods. The purpose of this structure is to provide a layered view of trend behavior across multiple time horizons, helping visualize alignment, compression, and expansion within broader market structure.
In addition to standard EMA visualization, the indicator integrates a volatility context layer using the Average True Range (ATR). This allows price distance from each EMA to be expressed not only in percentage terms, but also in ATR-normalized form. The ATR extension metric is derived from the relationship between percentage deviation from the moving average and current ATR percentage, enabling comparison of movement intensity across different instruments regardless of price scale.
The included table presents a structured breakdown for each selected EMA:
EMA value based on configurable length and timeframe
Percentage distance between price and each EMA
ATR-normalized extension value representing volatility-adjusted deviation
This structure allows users to observe how price interacts with multiple trend references simultaneously, while also understanding whether movement is occurring within normal volatility conditions or represents an expanded deviation relative to recent market behavior.
A visual marker is included to highlight conditions where price is significantly extended above a selected higher timeframe EMA relative to ATR-based expansion. This is intended to assist with quickly identifying periods of elevated trend extension within the broader EMA framework.
The header display optionally shows symbol, description, and active chart timeframe to maintain contextual awareness when analyzing multiple assets or timeframes.
Overall, the tool is designed as a multi-layer trend and volatility visualization system combining moving averages, relative distance metrics, and ATR-based normalization to better contextualize price positioning within ongoing market structure. مؤشر

مؤشر

مؤشر

مؤشر

مؤشر

مؤشر

مؤشر

مؤشر

EMA 40 Pullback Pyramid StrategyEMA 40 Pullback Pyramid Strategy
EMA 40 Pullback Pyramid Strategy is an educational trend-following strategy designed to study long-side entries around a rising 40-period Exponential Moving Average, with optional pullback re-entry logic, ADX trend-strength filtering, and EMA cross-based entry/exit conditions.
This is a strategy script, not a prediction tool and not financial advice. It is intended for research, backtesting, and forward-testing only. Historical results are hypothetical and can differ significantly from live trading due to slippage, commissions, liquidity, order execution, symbol behavior, timeframe selection, and market regime changes.
What the strategy does
The strategy uses the 40-period EMA as its main directional reference.
The EMA color changes according to its slope:
- Green EMA: the EMA is rising.
- Red EMA: the EMA is falling.
- Gray EMA: the EMA is flat or unchanged.
The strategy can enter long positions when selected bullish conditions occur and can close positions when selected bearish or exit conditions occur.
Core logic
1. EMA 40 trend direction
The strategy calculates a fast EMA using the selected EMA length. The default value is 40.
A bullish trend condition exists when the EMA is rising. A bearish condition exists when the EMA is falling.
The original base entry occurs when the EMA changes from not rising to rising, and ADX is above the selected minimum threshold.
2. ADX trend-strength filter
The strategy uses DMI / ADX to filter weak trend conditions.
A trade can qualify only when ADX is above the selected ADX threshold. The default threshold is 20.
This filter is intended to reduce entries during weak or sideways market conditions, but it does not eliminate false signals.
3. Pullback re-entry logic
When enabled, the pullback module looks for price to retrace toward the EMA by a selected ATR-based distance and then recover above the EMA.
The pullback condition uses:
- ATR length.
- Pullback distance multiplied by ATR.
- Recovery candle logic, where the candle closes above the EMA and closes above its open.
This feature is designed to study additional entries during an existing upward EMA trend. Because pyramiding is enabled, these pullback signals can add to an existing long position depending on the strategy settings.
4. EMA 40 cross signals
The strategy includes optional EMA cross buy/sell logic.
The cross detection mode can be:
- Close mode: uses close crossing above or below the EMA.
- Wick mode: uses wick interaction with the EMA followed by a close on the opposite side.
When “Use EMA cross signals in strategy orders” is enabled, these signals can participate in actual strategy entries and exits. When disabled, they can be used only as visual reference signals.
5. Minimum bars between entries
The strategy includes a minimum-bars-between-entries setting. This helps reduce immediate repeated entries and gives users control over signal spacing.
6. Pyramiding
The strategy uses pyramiding to allow multiple long entries when qualifying conditions appear. This is mainly intended to study whether adding into a trend after pullbacks improves or worsens the tested behavior.
Users should review this setting carefully. Pyramiding increases exposure and can materially increase both potential returns and potential drawdowns.
Default strategy properties
The script uses the following default strategy properties:
- Initial capital: 1,000
- Position sizing: percent of equity
- Default order size: 33% of equity
- Pyramiding: 3
- Commission: 0.1%
- Slippage: defined in the strategy settings
- Bar magnifier: disabled
- Calculate on every tick: disabled
- Process orders on close: disabled
These settings are included for testing purposes only. They may not be suitable for every market, timeframe, or trader. Users should adjust position sizing, commission, slippage, pyramiding, and test date range to reflect realistic conditions for the instrument being tested.
Important backtesting note
TradingView strategy results are simulations based on historical bar data. They are not live trading results.
Backtest results can change significantly depending on:
- Symbol
- Timeframe
- Date range
- Commission
- Slippage
- Liquidity
- Spread
- EMA length
- ADX threshold
- ATR length
- Pullback multiplier
- Minimum bars between entries
- EMA cross mode
- Whether EMA cross signals are used for orders
- Pyramiding setting
- Market regime
Users should test the strategy on a sufficiently large sample of trades and across different market conditions before drawing conclusions. A small number of trades is not enough to evaluate a strategy reliably.
How to use it
A practical workflow is:
1. Select the symbol and timeframe to test.
2. Use a realistic date range that includes different market conditions.
3. Review whether the strategy produces a sufficient number of trades.
4. Adjust commission and slippage to match the market being tested.
5. Review the impact of position size and pyramiding on drawdown.
6. Compare results with and without pullback re-entry.
7. Compare results with and without EMA cross signals being used for strategy orders.
8. Forward-test before considering any real-world use.
Inputs
Date Range
- Start Date: first date included in the test.
- End Date: last date included in the test.
Moving Average
- Fast EMA Length: controls the EMA used for trend direction, pullbacks, and cross signals.
DMI / ADX
- DI Length: DMI calculation period.
- ADX Smoothing: smoothing period for ADX.
- ADX minimum to trade: minimum ADX value required for qualifying trend entries.
Pullback Re-entry
- Enable pullback re-entry: enables or disables ATR-based pullback entries.
- Pullback distance × ATR: controls how close price must pull back toward the EMA.
- ATR Length: ATR period used for pullback distance.
Signal Control
- Minimum bars between entries: controls spacing between entries.
EMA 40 Cross Signals
- Use EMA 40 cross buy/sell signals: enables visual EMA cross signals.
- EMA cross detection mode: chooses Close mode or Wick mode.
- Use EMA cross signals in strategy orders: determines whether EMA cross signals affect actual strategy orders.
Visual elements
The script plots:
- The EMA line, colored by slope.
- Base entry markers.
- Pullback add-entry markers.
- Optional EMA cross buy/sell markers.
- Hidden ADX and ADX threshold plots available for reference.
Limitations
This strategy is long-side focused and does not create independent short positions.
The strategy can underperform during sideways or choppy market conditions, even with the ADX filter.
EMA-based systems are inherently lagging because moving averages react to prior price data.
ADX can confirm trend strength but does not determine trade direction by itself.
Pullback and pyramiding logic can increase exposure and may increase drawdown.
No strategy setting can guarantee profitability or future performance.
Recommended use
This strategy is best used as an educational framework for testing EMA trend continuation, ATR-based pullback re-entry, ADX trend-strength filtering, and pyramiding behavior.
It should be used with realistic backtesting assumptions, conservative risk controls, and additional independent analysis before any trading decision. استراتيجية

Compass | AnonycryptousCompass | Anonycryptous
Description & user manual
Credits
The weekly psychological level calculation in this indicator is based on open-source code originally published on TradingView. The original script was created by plasmapug. Continued development was done by infernixx, Peshocore, and xtech5192 in collaboration with TradersReality. Significant modifications have been made to integrate this component into the Compass framework.
Why this indicator is different
Most indicators answer one question. A moving average tells you the trend direction. An oscillator tells you momentum. A session box tells you the time. A volume indicator tells you participation. Each one is useful. None of them tells you where you are.
Before placing a trade, a trader needs to answer several questions simultaneously. What session is active and what does that mean for the type of price action to expect? Where does the macro trend stand? Is volume confirming the move or contradicting it? Are there open imbalances nearby that price may return to? How much of the day's expected range has already been consumed? Where are the key structural levels — pivots, the daily open, prior week references?
Answering each of these questions separately requires stacking tool after tool until the chart becomes unreadable. Compass answers all of them at once.
It is not a signal indicator. It does not fire arrows or tell you when to buy or sell. What it does is something more fundamental: it gives you a complete read of the market environment before any decision is made. Sessions, trend, volume, imbalances, range levels, pivots, psychological references — all in one overlay, all configurable, all on one chart.
The design philosophy is orientation first. Decision second. Compass tells you where you are. What you do with that is your responsibility.
Important notice
Compass does not generate trading signals.
It does not tell you when to buy or sell.
It does not predict market direction.
It does not replace your trading strategy or your own analysis.
All illustrative examples in this manual are for educational purposes only and are not trading recommendations.
All trading decisions remain entirely with the user.
Always apply your own judgment and manage your own risk.
1. Overview
Compass is a comprehensive market context indicator that combines eleven independent analysis frameworks into one unified overlay. Every component is individually toggleable. Six presets are included for different trading styles, from fast scalping to full multi-component analysis.
What it includes:
- Five-EMA suite with adaptive cloud around the EMA 50
- EMA crossover system with configurable signals and candle coloring
- Stochastic RSI background alerts with four alert types and RSI divergence detection
- PVSRA volume vector candle analysis with zone tracking and configurable thresholds
- Eight global market sessions with automatic DST awareness
- Average daily, weekly, and monthly range levels with 50% midpoints
- Classic pivot points with mid-point levels
- Daily open reference line with historical opens
- Fair value gap detection with partial absorption tracking
- Weekly psychological level tracking
- Live dashboard with eighteen data points across all active components
2. EMA suite
Five exponential moving averages are plotted simultaneously: EMA 5, EMA 13, EMA 50, EMA 200, and EMA 800. Together they cover short-term momentum, medium-term trend direction, macro trend, and long-term structural bias.
The EMA 50 is wrapped in a dynamic cloud calculated from two standard deviations of price. The cloud expands during volatility and contracts during consolidation. A widening cloud indicates active price discovery. A thinning cloud indicates equilibrium or compression before a directional move.
The EMA 200 is the primary macro bias filter. Price above it defines a broadly bullish environment. Price below it defines a broadly bearish environment. This is shown in the dashboard at all times.
The EMA 800 provides long-term structural context, particularly useful on mid to higher timeframes where it marks the gravitational center of multi-month price structure.
All five EMA lengths are configurable. Each has individual color and transparency controls. An EMA label option displays the current value at the right edge of each line.
3. EMA cross system
The EMA cross tracks a configurable fast EMA crossing a configurable slow EMA and marks the crossover bar. All candles after a cross continue in the direction of that cross until the opposite cross fires.
Three display modes are available: show both the fast and slow EMA lines, show a single consolidated EMA line, or hide the EMA lines entirely while keeping the crossover signals visible.
This component is a trend state indicator, not a trade trigger. A bull cross does not mean buy. It means the short-term trend has shifted upward relative to the medium-term average.
Signals and candle coloring can be toggled independently.
4. Stochastic RSI
The stochastic RSI component runs a standard stochastic RSI calculation and generates background color alerts based on crossover conditions at configurable band levels.
Four alert types are available, each independently toggleable:
Middle band crossover — K line crosses D line near the 50 level. Indicates a possible trend shift in momentum.
Overbought/oversold crossover — K line crosses D line from overbought or oversold territory. Indicates a potential reversal from an extreme.
Entering overbought — K line crosses above the upper band. Indicates that momentum has moved into overbought territory.
Entering oversold — K line crosses below the lower band. Indicates that momentum has moved into oversold territory.
The dashboard displays the current stochastic RSI state and the RSI value. RSI appears in green when above the midline and in red when below. Regular bullish and bearish divergence is detected automatically and shown in the dashboard as a directional label. When divergence is active, a thin reference line appears on the price chart marking the divergence candles.
5. PVSRA volume vector analysis
PVSRA analysis colors candles based on volume relative to the 10-bar average and the relationship between volume and candle spread.
Four vector types:
Green vector — bullish bar where volume is at or above the green/red threshold (default 200% of the 10-bar average), or where volume multiplied by spread is the highest of the last 10 bars. Indicates strong bullish institutional participation.
Red vector — same conditions on a bearish bar. Indicates strong bearish institutional participation.
Blue vector — bullish bar where volume is at or above the blue/violet threshold (default 150% of average). Indicates elevated bullish volume below the institutional threshold.
Violet vector — same conditions on a bearish bar. Indicates elevated bearish volume.
Grey — no vector conditions met. Normal volume.
Both thresholds are configurable directly from the settings panel. Blue and violet signals are strictly exclusive from green and red — a bar cannot qualify for both simultaneously.
Vector candle zones draw boxes at each vector candle location and remain active until price moves through the zone, marking areas where elevated institutional activity was detected at the time the candle formed.
The PVSRA override input allows a different symbol to be used for the volume calculation. This is useful when the charted instrument has unreliable volume data, such as CFDs, perpetual swaps, or instruments where the primary volume is on a related market.
6. Market sessions
Eight global trading sessions are tracked simultaneously, each with automatic DST awareness. Sessions are displayed as expanding boxes with high and low lines and a real-time label showing the session open.
Sessions included:
- London: 08:00–16:30 UTC
- New York: 14:30–21:00 UTC
- Tokyo: 00:00–06:00 UTC
- Hong Kong: 01:30–08:00 UTC
- Sydney: 22:00–06:00 UTC
- EU brinks: 08:00–09:00 UTC
- US brinks: 14:00–15:00 UTC
- Frankfurt: 07:00–16:30 UTC
DST is handled automatically for London, New York, and Sydney. No manual adjustment is needed. Each session can be toggled individually, and box color, transparency, and label color are fully configurable per session.
Session context matters because market behavior differs significantly depending on which participants are active. London and New York overlap produces the highest volume and fastest price movement. Tokyo and Sydney sessions tend to consolidate. The brinks windows mark the transition periods where session highs and lows often form.
7. Range levels
Three statistical range frameworks measure the expected price range for the current period based on historical averages.
Average daily range (ADR) — the expected high and low for the current trading day. When price reaches the ADR level, the day's expected range has been consumed. Moves beyond the ADR are extension moves that occur with lower statistical probability and often mean-revert. The dashboard shows ADR % used — how much of today's expected range has already been consumed. Above 80% indicates the day is approaching its expected limit.
Average weekly range (AWR) — the same concept applied to the current week. Useful for assessing how much room the week has left to move.
Average monthly range (AMR) — the same concept applied to the current month. Provides macro context for position sizing and target expectations.
Each framework includes a 50% midpoint level marking the center of the expected range. The ADR measure from daily open option calculates the range starting from that day's open price rather than the statistical high, making the levels static for the entire day.
All three frameworks have individual lookback period inputs, color controls, line styles, and label toggles.
8. Pivot points
Classic pivot points are calculated from the prior day's high, low, and close. Levels include PP, R1/S1, R2/S2, R3/S3, and M mid-point levels between each major level.
Pivot points provide structural reference for the current session. Price above PP defines a broadly bullish day structure. R levels act as potential resistance targets. S levels act as potential support targets. M levels provide intermediate precision references between major pivots.
All levels can be toggled individually. Lines extend rightward from the prior session and can optionally extend in both directions. Each level has individual color and line style controls.
9. Daily open
A horizontal line marks the current day's opening price. This is one of the most referenced structural levels among short-term traders because it defines the starting point for the day's price discovery.
Price above the daily open reflects a bullish session bias. Price below reflects a bearish session bias. When price oscillates around the daily open without committing direction, the session is in balance — a lower probability environment for trend trades.
Historical daily opens can optionally be shown as reference for prior day context.
10. Fair value gaps
A fair value gap is a three-bar imbalance where price moved through a range without leaving two-sided trade — the low of the upper candle is above the high of the lower candle (bullish gap) or vice versa (bearish gap). These areas represent unfinished business where the market may return to achieve balance.
Gaps are filtered by a minimum width threshold expressed as a multiple of ATR. Gaps narrower than the threshold are excluded. Partial absorption is tracked — as price returns into the gap, the fill color changes to show how much of the imbalance has been recovered.
Fully mitigated gaps can be kept on the chart as historical reference or deleted automatically to maintain a clean view.
11. Psychological levels
Weekly psychological levels mark the prior week's high and low as calculated by a specific session-anchored method. These levels represent deliberate structural references where participants have previously committed size — breakouts and rejections around these levels tend to be more intentional than random price noise.
Three GMT offset options accommodate the session anchor calculation for different global market structures. Two mode options are available: crypto (weekly reset on Saturday Sydney open) and forex (weekly reset on Monday Tokyo open).
12. Settings reference
Preset
- Custom: full manual control over all settings.
- Clean scalper: sessions, EMA suite, FVG, subtle candle coloring. Low noise.
- Full context: everything on, medium transparency. Best for analysis.
- Signal focus: EMA cross, stoch RSI background, PVSRA bar color prominent. Rest subtle.
- Minimal: sessions, daily open, ADR only. No signals.
- PVSRA pro: PVSRA and vector candle zones central. EMA 200 and 800 only.
Global settings
- Master opacity offset (custom preset only): shifts all transparency values simultaneously.
- Show bull/bear label text: shows or hides text on EMA cross signal triangles.
EMA suite
- Show EMA suite and labels
- Individual EMA color and transparency controls
- EMA cloud fill and border transparency
- EMA line width
EMA cross
- Show EMA cross signals
- Fast EMA, slow EMA, and consolidated EMA lengths
- Show both EMAs or consolidated only
- Bull, bear, and neutral colors and transparency
- Cross EMA line width
Stochastic RSI
- Show stochastic RSI background alerts
- RSI length and stochastic length
- Overbought and oversold band levels
- Individual alert type toggles (four types)
- Alert colors and transparency
- RSI divergence lookback period
- Divergence line color and width
PVSRA
- Vector colors (red, green, violet, blue, regular up/down)
- Green/red threshold (× average volume, default 2.0)
- Blue/violet threshold (× average volume, default 1.5)
- Include spread filter for green/red classification
- Override symbol toggle and input
- Show vector candle zones with transparency and width settings
Candle coloring
- Enable candle coloring
- Coloring mode: EMA cross / PVSRA / EMA 200 / off
- Bull and bear candle color and transparency
Market sessions
- Show market sessions
- Session timezone
- Show sessions on weekends
- Session high/low line style and width
- Per session: toggle, box color, transparency, label color
Range levels
- Show ADR, AWR, AMR (individual toggles)
- Lookback periods for each
- Show 50% midpoint levels
- Measure from daily open (ADR only)
- Color, transparency, line width, line style, labels
Pivot points
- Show PP, R1/S1, R2/S2, R3/S3, M levels individually
- Show labels
- Extend lines both directions
- Individual level colors and line styles
- Pivot line width
Daily open
- Show daily open
- Show label
- Show historical daily opens
- Color, transparency, line width
Fair value gaps
- Show fair value gaps
- Width filter (ATR multiplier)
- Extend to current bar
- Bullish and bearish FVG colors
- Mitigation fill colors
- Keep historical FVGs after mitigation
Psychological levels
- Show psy levels and labels
- Show historical psy levels
- GMT offset (GMT+1, GMT+2, GMT+3)
- Psy type: crypto or forex
- High and low colors and transparency
Dashboard
- Show dashboard
- Position: top left, top right, bottom left, bottom right
- Size: tiny, small, normal
13. Dashboard reference
The dashboard provides eighteen live data points across all active components:
Session — the currently active market session.
EMA cross — current EMA cross direction: bull or bear.
EMA 200 — whether price is above or below the EMA 200.
Stoch RSI — current stochastic RSI condition.
RSI — current RSI value, colored green above midline and red below.
RSI divergence — active bullish or bearish divergence, or none.
PVSRA — current candle vector type.
ADR % used — how much of today's expected daily range has been consumed.
FVG active — count of open unmitigated fair value gaps and mitigation percentage.
Psy level — whether price is above or below the prior week's psychological level.
Timezone — active session timezone setting.
VCZ active — count of active vector candle zones above and below current price.
Pivot PP — current pivot point value.
Daily open — current daily open price and direction.
14. How to use
14.1 Initial setup
Select a preset that matches your primary trading style. Adjust the session timezone to match your location or your primary exchange. If you trade an instrument with unreliable volume data, enable the PVSRA override and set it to a correlated liquid instrument. Set the ADR lookback period to your preference — 14 days is a standard starting point. For FVGs, set the width filter to 0.5 or higher to exclude minor gaps.
14.2 Reading the dashboard
The dashboard is the fastest way to orient yourself on a new chart or a new session. Check session, EMA cross direction, EMA 200 position, stoch RSI state, and ADR consumed before anything else. Five seconds to a full picture of where the market stands.
14.3 Reading the chart
Check EMA alignment. When EMA 13, EMA 50, and EMA 200 are stacked in the same direction, the trend is more significant than a single crossover. Divergence between them reflects a transition or competing timeframe pressures.
Check ADR percentage. Below 50% means the day has statistical room to move. Above 80% means the day is near its expected limit and extension moves are less probable.
Look for open FVGs near current price. An unmitigated FVG in the direction of the prevailing trend is a precision reference area where price has historically returned.
Check the psy level. If price is approaching the prior week's high or low, be aware that participant behavior around those references tends to be deliberate.
14.4 Timeframe guide
1 minute to 3 minutes — clean scalper preset, candle coloring set to EMA cross.
5 minutes to 15 minutes — clean scalper or signal focus preset.
30 minutes to 1 hour — full context preset, use ADR and pivot points.
4 hours to daily — full context or minimal preset.
14.5 Tips
PVSRA override — use when your broker's volume data is unreliable, when you trade a CFD or derivative with synthetic volume, or when you want spot market volume for a futures chart.
Master opacity offset — adding 10 to 20 increases overall transparency and dims the chart if it feels cluttered. Subtracting 10 to 20 makes all elements more prominent. This shifts all transparency values simultaneously without changing individual settings. Only active in custom preset.
Not every component needs to be active at once. Most traders will find three to four components provide the context they need for their specific setup.
15. Disclaimer
This indicator is provided for educational and informational purposes only.
Nothing in this document constitutes financial advice or any form of trading recommendation.
Trading financial instruments involves substantial risk of loss.
Past performance is not indicative of future results.
You may lose all of your invested capital.
All trading decisions are made entirely by the user.
Use at your own discretion.
مؤشر

مؤشر

27.05.2026***
Before presenting this project, I would like to express my sincere gratitude to all the developers, traders, coders, researchers, and members of the TradingView community whose ideas, indicators, concepts, and open-source contributions helped inspire this work.
Modern technical analysis is built upon decades of shared knowledge.
Every moving average, volatility model, market structure concept, liquidity theory, trend engine, and smart-money framework exists because countless traders decided to share their discoveries with others.
This indicator is not the product of a single isolated idea.
It is the result of studying, combining, refining, and evolving many approaches developed by talented authors across the trading community.
Special appreciation goes to the creators and researchers behind:
* Supertrend algorithms
* ATR-based volatility systems
* Supply & Demand methodologies
* Fair Value Gap concepts
* Smart Money Concepts (SMC)
* Volume analytics
* Multi-timeframe trend models
* Session-based trading frameworks
* Institutional liquidity mapping techniques
Open-source collaboration is one of the greatest strengths of the TradingView ecosystem.
The willingness of traders to publish ideas, share code, test concepts, and improve each other’s work continues to push technical analysis forward.
This project was created with respect for that spirit of collaboration.
Thank you to everyone whose work, directly or indirectly, contributed to the development of this indicator.
***
# 3ST NR — Advanced Non-Repainting Market Structure & Trend Engine
The **3ST NR** indicator is a complete institutional-style trading framework built around a triple Supertrend architecture, market condition analysis, ranked supply & demand zones, liquidity imbalance detection, multi-timeframe EMA mapping, and session-aware filtering.
Designed for traders who want more than simple buy/sell signals, this system transforms raw price action into a fully contextual trading environment.
---
## Core Concept
At the heart of the indicator are **three independent Supertrend engines** with different ATR sensitivities:
* Fast Supertrend → short-term momentum
* Mid Supertrend → directional confirmation
* Slow Supertrend → macro trend structure
A bullish state appears when the fast and mid Supertrends align upward.
A bearish state appears when both align downward.
Unlike many retail indicators, the script uses:
* confirmed candles only
* `barstate.isconfirmed`
* no future-looking calculations
* non-repainting logic
This creates stable and reliable market structure signals.
---
# Market Intelligence Engine
The script does not blindly trade every signal.
Instead, it evaluates the quality of the environment using a dynamic market engine:
## Trend Detection
Trend strength is calculated using:
* ATR volatility
* distance from EMA 21
* normalized momentum
The market is automatically classified into:
* **TREND**
* **MIX**
* **CHOP**
This allows traders to avoid low-quality ranging conditions.
---
# Volume Classification Engine
Volume is analyzed relative to a 20-period moving average.
The system categorizes activity into:
* LOW
* NORMAL
* HIGH
* SPIKE
This creates optional institutional participation filters, helping traders focus only on moments where real liquidity enters the market.
---
# Smart Session Engine
The indicator is fully session-aware.
It recognizes:
* New York Session
* London Session
* Asia Session
* US Pre-Market
Optional filters allow trading only during the highest-liquidity market windows.
This is especially powerful for:
* index futures
* NASDAQ
* forex
* scalping environments
---
# Multi-Layer EMA Structure
The script overlays multiple EMA systems simultaneously:
## Intraday EMAs
* EMA 9
* EMA 20
* EMA 62
* EMA 200
## Higher Timeframe Daily EMAs
* Daily EMA 3
* Daily EMA 9
* Daily EMA 20
* Daily EMA 50
* Daily EMA 100
* Daily EMA 200
This creates a complete multi-timeframe trend map directly on lower timeframes.
The higher timeframe EMAs act as:
* institutional support/resistance
* trend magnets
* reversal zones
* momentum confirmation layers
---
# Dynamic Daily Levels
The indicator automatically plots:
* Daily Open
* High of Day (HOD)
* Low of Day (LOD)
These levels dynamically update throughout the session and extend across the chart.
They serve as:
* liquidity references
* intraday breakout zones
* mean reversion levels
* trend continuation triggers
---
# Ranked Supply & Demand System
One of the most advanced parts of the script is the adaptive supply & demand engine.
The indicator:
* detects swing pivots
* builds dynamic zones
* ranks them using a proprietary scoring system
* continuously updates strength based on:
* mitigation
* volume
* trend alignment
* touch count
* age
* volatility
Zones are automatically classified as:
* strong support
* weak support
* strong resistance
* weak resistance
* mitigated zones
* broken zones
Each zone includes:
* visual strength bars
* bullish/bearish dominance percentages
* mitigation tracking
* automatic cleanup logic
The system behaves similarly to institutional order-flow mapping.
---
# Fair Value Gap Detection (FVG)
The script also detects non-repainting Fair Value Gaps.
Bullish and bearish imbalances are automatically drawn when inefficient price delivery occurs between candles.
These zones help traders identify:
* liquidity voids
* inefficiencies
* continuation structures
* smart-money displacement
---
# Intelligent Dashboard
A built-in real-time dashboard displays:
* current market condition
* volume state
* active session
* trend strength
* bullish/bearish status
This creates a compact decision-making center directly on the chart.
---
# Non-Repainting Philosophy
The entire system is designed around signal stability.
Key anti-repaint mechanisms include:
* confirmed candle validation
* no future bar references
* `lookahead_off`
* closed-bar signal confirmation
* structural pivot validation
This makes the indicator suitable for:
* live trading
* alerts
* automation
* strategy development
* discretionary execution
---
# Best Use Cases
The indicator performs exceptionally well in:
* NASDAQ scalping
* index futures
* forex intraday trading
* momentum trading
* session breakout strategies
* smart money concepts
* trend continuation systems
Especially effective on:
* 1-minute
* 3-minute
* 5-minute
* 15-minute charts
---
# Key Features Summary
* Triple non-repainting Supertrend engine
* Adaptive market state detection
* Volume intelligence filters
* Session-based filtering
* Multi-timeframe EMA structure
* Dynamic Daily Open / HOD / LOD
* Ranked Supply & Demand zones
* Zone strength scoring system
* Mitigation tracking
* Broken structure detection
* Fair Value Gap engine
* Real-time dashboard
* Institutional-style market mapping
---
# Final Philosophy
3ST NR is not just another indicator.
It is a complete market structure framework combining:
* trend analysis
* liquidity mapping
* volatility analysis
* volume confirmation
* institutional zones
* session timing
* smart-money concepts
The goal is simple:
Filter noise.
Visualize structure.
Trade with context.
مؤشر

مؤشر

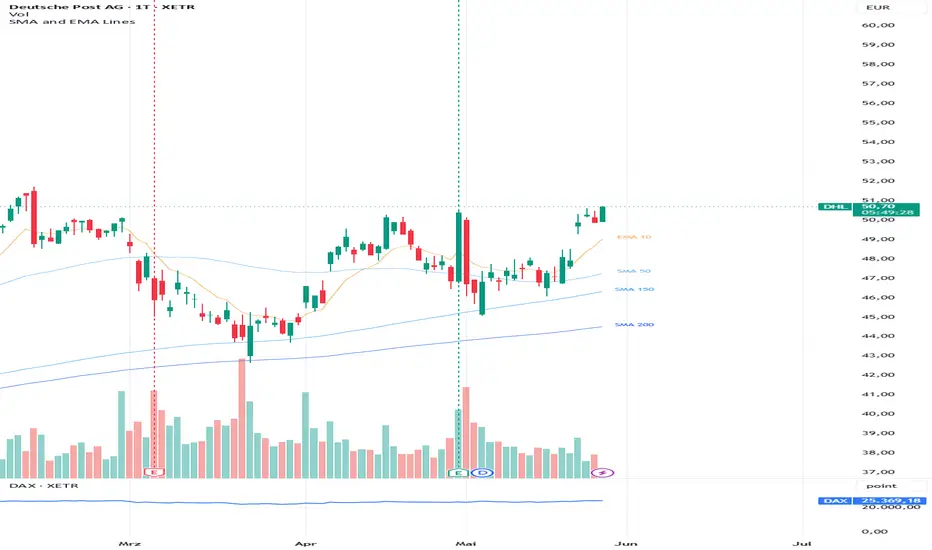
Jose Daily EMA 9/21/50/100/200Jose Daily EMA 9/21/50/100/200 plots fixed daily exponential moving averages on any chart timeframe. The indicator displays the 9, 21, 50, 100, and 200-day EMAs using daily data, so the levels remain based on the daily timeframe even when viewing intraday charts such as 1-minute, 5-minute, or 15-minute.
This tool is useful for identifying higher-timeframe trend direction, dynamic support and resistance, pullback zones, and key reaction areas during intraday trading. The shorter EMAs help track momentum, while the 50, 100, and 200-day EMAs provide broader market context.
Key features:
Fixed daily EMA levels
Works on any chart timeframe
Includes 9, 21, 50, 100, and 200-day EMAs
Helpful for scalping, day trading, breakout trading, and trend analysis
Designed to avoid EMA changes when switching chart timeframes مؤشر

مؤشر

مؤشر

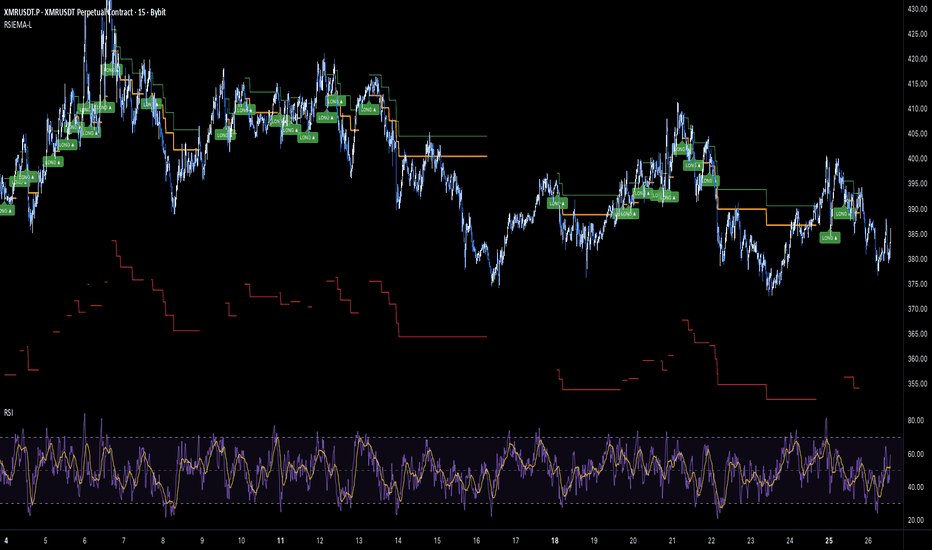
RSI Dip + EMA Trend Long DCA - IndicatorRSI Dip + EMA Trend Long DCA — Leveraged Indicator
🔷 What it does:
This is a signal-only indicator that mirrors a leveraged dip-buying DCA workflow on crypto perpetuals. It tracks one virtual long position at a time, opened only when an oversold dip and an uptrend confirmation align across two lower timeframes. The indicator manages up to four safety orders as price ladders lower, and exits via three independent paths: take profit with trailing, hard stop loss, or a forced close after a maximum holding period. Every event emits a webhook-ready JSON payload tailored for a DCA Bot configured for leveraged futures.
- Dual confirmation entry: RSI(12) crossing down 35 on 5m AND EMA(50) > EMA(100) on 15m.
- Soft-compounding safety ladder: 4 SOs at 1.05× margin progression, deviations 1.00%, 2.20%, 3.64%, 5.37%.
- Three-exit architecture: 1.0% Take Profit with 0.1% trailing, 9% hard Stop Loss, 3-day Max Hold timeout.
- Default leverage 25×, configurable from 1× upward.
- Honest virtual bookkeeping: total notional and qty updated per fill, avg entry / open PnL displayed live.
🔷 Who is it for:
- Active traders running a DCA Bot on leveraged crypto perpetuals who want a systematic dip-buying engine.
- Bot operators who want a chart-driven signal source with per-event JSON ready for a DCA Bot.
- Traders who want to monitor an evolving leveraged position — base entry, owned SO levels, deployed notional, open PnL, time-to-max-hold — directly on the chart.
- Operators comfortable with portfolio-level drawdowns in the 15–20% range in exchange for accelerated returns.
🔷 How does it work:
Entry RSI Filter (Oversold Dip): A 5-minute RSI(12) is sampled via request.security with lookahead disabled. The dip gate fires when RSI crosses down through 35 — momentum has rolled over into oversold.
EMA Trend Filter: A 15-minute EMA(50) and EMA(100) are sampled in parallel. The trend gate is satisfied only while Fast EMA > Slow EMA — broader trend is up. When the EMA cross flips, the dip signal alone cannot open a virtual position.
Entry: When both gates align at host-bar close, the indicator marks a virtual long entry, captures the base entry price, seeds the cost-basis ledger with base margin × leverage notional, and fires the entry webhook payload.
Safety Order Ladder: After base fill, the indicator monitors close price downward against the position. When close reaches base entry × (1 − cumulative deviation), the k-th SO is marked filled, cost-basis is updated, and the SO webhook payload is fired. No additional gating on the SO ladder — pure price.
Honest Virtual Bookkeeping: Total notional and qty are updated incrementally on every event, so the avg entry, deployed notional, and open PnL displayed in the status table reflect the actual broker-equivalent position state — no shortcut from base entry, no synthetic averaging.
Exit Priority: Three exits evaluated in order on each bar: (1) Stop Loss at 9% below average entry, (2) Maximum Hold timeout from base entry, (3) Take Profit at 1.0% above average entry with 0.1% trailing — once price reaches the TP target, the position closes only after a 0.1% retrace from the in-favor peak.
🔷 Why it's unique:
- Two-Layer Confirmation: RSI dip on 5m for timing, EMA stack on 15m for trend bias. The two filters operate on different scales — momentum exhaustion alone cannot fire a signal against a confirmed downtrend, and trend alignment alone cannot fire outside a tactical entry window.
- Three-Exit Architecture: Most DCA tools use one or two exit conditions. This indicator handles all three failure modes explicitly — hard tail-risk stop, stuck-trade timeout release, and momentum-trailing winner exit.
- Leverage-Aware Sizing: Margin and leverage are independent inputs. The virtual ledger tracks notional position, so the avg-entry line and open PnL reflect the leveraged broker state, not unleveraged cash-only math.
- Per-Event Webhook Ledger: Up to seven distinct events per cycle (entry + 4 SO fills + close + max-hold/SL), each with its own JSON alert payload. The indicator drives a DCA Bot end-to-end through a single TradingView alert.
🔷 Considerations Before Using the Indicator:
Market & Timeframe: Designed for liquid crypto perpetuals on 15m. Default thresholds are calibrated for XMRUSDT.P 15m. Different pairs may need EMA period and RSI threshold tuning.
Leverage Warning: The default 25× leverage is aggressive. The companion strategy's backtest at default settings produced 18.01% maximum drawdown — substantially above the 5–10% per-trade band, although that figure reflects portfolio-level accumulation across 779 trades, not single-trade risk. Lower the leverage input to dial down portfolio-level drawdown proportionally.
Cross Detection Granularity: Entries and SO fills are evaluated on bar close. A bar that spikes through a level and returns within the same bar may be missed by design — this matches realistic polling behavior and avoids over-signaling on intra-bar wicks.
Live vs Historical State: The virtual position state is rebuilt from chart history each time the indicator is recompiled. If the indicator is added mid-deployment or the live bot diverges from the signal stream (manual interventions, partial fills), the indicator state may not match the live bot. Toggle the indicator off and on to reset.
No SO Condition: Safety orders fire on pure price ladder with no momentum gate — averaging continues unconditionally as price drops, until SL, MaxHold, or price reversal. Higher average-entry quality in shallow dips; greater unrealized exposure on sharp drops.
Maximum Hold Timeout: The 3-day forced close exists to release capital from stuck trades. The indicator dispatches a close webhook the moment the timeout fires — verify the receiving DCA Bot accepts unconditional close commands.
Funding Rates (Perpetuals): The indicator does not account for perpetual funding rates. Sustained negative funding improves live performance for this long strategy; sustained positive funding degrades it. Review the historical funding pattern before live deployment.
Backtesting Note: This is an indicator, not a strategy. There is no built-in P&L tester. For performance metrics over a 14-month sample (~779 closed trades, 74.07% win rate, 18.01% max drawdown, profit factor 1.313, +30.79% net return), use the companion strategy version on identical parameters.
🔷 How to Use It:
🔸 Add the indicator to a 15m chart on the leveraged perpetual pair you want to trade.
🔸 Review the entry filters (RSI on 5m, EMA stack on 15m), the 4-SO ladder, and the three exit conditions. Defaults are calibrated for XMRUSDT.P 15m at 25× leverage — recalibrate per asset and per risk tolerance before deploying.
🔸 Set leverage and base margin to match your exchange and account configuration. Lower leverage scales portfolio-level drawdown proportionally.
🔸 In the DCA Bot Webhook group, paste the Bot ID, Email Token, and Pair (QUOTE_BASE format, e.g., USDT_XMR).
🔸 Create an alert on the indicator with "Any alert() function call". Paste the DCA Bot's webhook URL into the alert's Webhook field. The indicator will emit JSON payloads for entry, each safety order, and all three close types — formatted for direct DCA Bot consumption.
🔷 INDICATOR SETTINGS
Base Order Margin (USDT): Margin per base trade. Notional = Margin × Leverage. Used for the virtual avg-entry / open-PnL computation.
Leverage (×): Exchange leverage. Default 25×.
Max Safety Orders: Maximum number of safety orders per cycle (default 4).
First SO Margin (USDT): USDT margin of the first safety order; subsequent SOs scale by the Size Multiplier.
Step to First SO (%): Distance from base entry at which SO1 becomes eligible.
Step Multiplier: Ladder factor that widens each subsequent deviation step.
Size Multiplier: Factor that grows each subsequent safety order's USDT margin.
Entry RSI Timeframe / Length / Level: Lower-timeframe RSI oversold-dip filter.
EMA Timeframe / Fast / Slow: Higher-timeframe trend confirmation filter.
Take Profit (%) / Trailing Deviation (%): TP target above avg entry and trailing buffer.
Stop Loss (%): Hard stop below avg entry.
Force Close After Max Hold / Max Hold (seconds): Timeout for forced market close.
DCA Bot Webhook: Bot ID, Email Token, and Pair fields injected into every alert payload.
Visualization: Toggle SO Ladder, Avg / TP / SL plot lines, fill labels, signal triangles, status table.
Brand Watermark: Configurable text, position, size, and transparency.
👨🏻💻💭 We hope this tool helps enhance your trading. Your feedback is invaluable, so feel free to share any suggestions for improvements or new features you'd like to see implemented.
__
The information and publications within the 3Commas TradingView account are not meant to be and do not constitute financial, investment, trading, or other types of advice or recommendations supplied or endorsed by 3Commas and any of the parties acting on behalf of 3Commas, including its employees, contractors, ambassadors, etc. مؤشر

RSI Dip + EMA Trend Long DCA - StrategyRSI Dip + EMA Trend Long DCA — Leveraged Strategy
🔷 What it does:
This is a long-only DCA strategy on leveraged crypto perpetuals that buys oversold dips inside confirmed uptrends. A long entry opens only when the lower-timeframe RSI crosses down into oversold territory AND a higher-timeframe EMA cross confirms the larger trend is up. Four safety orders form a pure-price deviation ladder. Exit is a tight Take Profit with trailing, OR a hard Stop Loss, OR a forced close after a maximum holding period.
- Single base order with up to four safety orders, soft 1.05× size compounding.
- Dual confirmation entry: RSI(12) crossing down 35 on 5m AND EMA(50) > EMA(100) on 15m.
- Three exit paths: 1.0% Take Profit with 0.1% trailing, 9% hard Stop Loss, or forced market close after 3 days max hold.
- Default leverage 25× — per-trade realized risk ~7.17% of equity (inside the 5–10% band).
- Every entry, safety order, and exit emits a webhook-ready JSON alert payload for direct DCA Bot consumption.
🔷 Who is it for:
- Active traders comfortable with leveraged crypto perpetuals who want a systematic dip-buying engine inside confirmed uptrends.
- Bot operators who want a chart-driven signal source with per-event JSON ready for a DCA Bot configured for leveraged futures.
- Traders looking to combine momentum exhaustion (RSI dip) with trend confirmation (EMA stack) for higher-confidence entries.
- Portfolio operators who can absorb a 15–20% maximum drawdown in exchange for ~30% trailing returns over comparable periods.
🔷 How does it work:
Entry RSI Filter (Oversold Dip): A 5-minute RSI(12) is sampled via request.security with lookahead disabled. The dip gate fires when RSI crosses down through 35 — momentum has rolled over into oversold, which on a confirmed uptrend often marks a tactical bounce point.
EMA Trend Filter: A 15-minute EMA(50) and EMA(100) are sampled in parallel. The trend gate is satisfied only while Fast EMA > Slow EMA — the broader trend is up. When the EMA cross flips, the dip signal alone cannot open a trade.
Entry: When both gates align at host-bar close, a long position opens. Base order is configurable as Market (default) or Limit. With default 25× leverage, base margin × leverage = notional position size.
Safety Order Ladder: After base fill, the strategy monitors price deviation downward against the position. No additional gating — pure price ladder. The k-th safety order fires when close ≤ base entry × (1 − cumulative deviation), where cumulative deviation grows by the step multiplier (default 1.2): 1.00%, 2.20%, 3.64%, 5.37%. Each safety order's USDT margin grows by 1.05× — soft compounding.
Exit Priority: Three exit paths evaluated in order on each bar: (1) Stop Loss at 9% below average entry, (2) Maximum Hold timeout at 3 days from base entry, (3) Take Profit at 1% above average entry with 0.1% trailing — once price reaches the TP target, the position closes only after a 0.1% retrace from the in-favor peak.
🔷 Why it's unique:
- Two-Layer Confirmation: RSI(12) dip on 5m for entry timing, EMA(50/100) on 15m for trend bias. The two filters operate on different scales — momentum exhaustion alone cannot open a trade against a confirmed downtrend, and trend alignment alone cannot open a trade outside a tactical entry window.
- Three-Exit Architecture: Hard Stop Loss for tail-risk protection, Maximum Hold timeout for stuck trades that don't reach either bound, and Take Profit with trailing for letting winners run. Most DCA strategies use one or two exits; this one explicitly handles all three failure modes.
- Leverage-Aware Sizing: Base margin and leverage are independent inputs. Margin sets the per-trade capital commitment; leverage sets the notional exposure. Per-trade risk at SL = base + SO margins × SL% — bounded and predictable.
- DCA Bot Integration: Every event (base, SO 1–4, TP/SL/MaxHold close) emits a fully-formed JSON alert payload. Connect one alert to a DCA Bot's webhook URL and the strategy drives the bot end-to-end.
🔷 Considerations Before Using the Strategy:
Market & Timeframe: Defaults are calibrated for BYBIT:XMRUSDT perpetual on 15m. The dip-buying-in-uptrend logic is portable to other liquid crypto perpetuals with clear directional regimes, but the EMA periods and RSI thresholds should be reviewed before redeployment.
Leverage Warning: The default 25× leverage is aggressive. A 9% adverse price move at 25× leverage equals 225% of base margin — the Stop Loss closes the position at full margin loss before liquidation. The per-trade realized risk at SL is approximately 7.17% of equity at default base margin (60 USDT). Lower the leverage input or reduce base margin to dial down per-trade exposure.
Drawdown Profile: The backtest produced a 18.01% maximum equity drawdown over a 14-month sample with 779 closed trades. This is above TradingView's typical 5–10% per-trade band — but the figure reflects portfolio-level accumulation of losing trades across an adverse period, not single-trade risk. Per-trade risk remains inside the 5–10% band; the portfolio-level DD reflects the leveraged compounding and should be sized accordingly within a diversified strategy mix.
No SO Condition: Safety orders fire on pure price ladder with no momentum gate. This means averaging continues unconditionally as price drops, until either SL fires or the price reverses. The trade-off: higher average-entry quality if the dip continues, but greater unrealized loss exposure during sharp drops.
Maximum Hold Period: The 3-day forced close exists to release capital from stuck trades that haven't reached TP or SL. On a 15m chart, this is approximately 288 bars. Adjust the timeout to match your strategy rotation cadence.
Funding Rates (Perpetuals): Backtests do not account for perpetual funding rates. Sustained negative funding (shorts pay longs) improves live performance for this long strategy; sustained positive funding degrades it. Review the historical funding pattern before live deployment.
Demo Testing: Always demo-test before going live. Past results do not guarantee future performance, especially on leveraged strategies where small parameter changes materially affect risk.
🔷 STRATEGY PROPERTIES
Symbol: BYBIT:XMRUSDT.P (Perpetual)
Timeframe: 15M
Test Period: April 1, 2025 — May 26, 2026 (~14 months).
Initial Capital: 10,000 USDT.
Order Size per Trade: 60 USDT margin × 25× leverage = 1,500 USDT notional base + 4 safety orders at 1.05× progression.
Max Capital Deployed (Margin): ~318.6 USDT per trade across base + 4 SOs.
Max Realized Loss per Trade: ~717 USDT at full ladder + SL (~7.17% of equity).
Commission: 0.05% per trade.
Slippage: 3 ticks.
Leverage: 25× (configurable).
Margin for Long Positions: 100%.
Indicator Settings: Default Configuration.
Base Order: 60 USDT margin, Market by default (Limit toggle available).
Take Profit: 1.0% above average entry with 0.1% trailing.
Stop Loss: 9% below average entry (hard close).
Max Hold: 3 days (259,200 seconds) — forced market close.
Entry Filter: 5m RSI(12) Crossing Down 35 AND 15m EMA(50) > EMA(100).
Safety Orders: 4, Deviation 1.0%, Deviation Step 1.2×, Size Multiplier 1.05×.
Strategy: Long Only.
🔷 STRATEGY RESULTS
⚠️ Remember, past results do not guarantee future performance.
Net Profit: +3,078.80 USDT (+30.79%)
Max Equity Drawdown: 2,013.77 USDT (18.01%)
Total Closed Trades: 779
Percent Profitable: 74.07% (577 / 779)
Profit Factor: 1.313
🔷 How to Use It:
🔸 Adjust Settings: Open the strategy inputs and review the Base Margin, Leverage, entry filter (RSI level on 5m, EMA periods on 15m), the 4-SO ladder, and the three exit conditions. Defaults are calibrated for XMRUSDT.P 15m at 25× leverage — recalibrate per asset and per risk profile before deploying.
🔸 Results Review: Run a full-period backtest and confirm Max Drawdown stays inside your personal risk band. The 18% DD at default settings reflects 25× leverage — lower the leverage input to scale risk down proportionally. Validate the closed-trade count (≥ 100 minimum is a comfortable statistical floor).
🔸 Create alerts to trigger the DCA Bot: Add one alert on the strategy using "Any alert() function call". Paste the DCA Bot's webhook URL into the alert's Webhook field, and fill the Bot ID, Email Token, and Pair inputs on the script. The strategy will emit JSON payloads for entry, each safety order, and all three exit types — formatted for direct DCA Bot consumption.
🔷 INDICATOR SETTINGS
Base Order Margin (USDT): Margin per base trade. Notional = Margin × Leverage.
Leverage (×): Exchange leverage. Default 25× — adjust to match your account configuration.
Use LIMIT for Base: Toggle between Market (default) and Limit at bar close.
Max Safety Orders: Maximum number of safety orders per deal (default 4).
First SO Margin (USDT): USDT margin of the first safety order; subsequent SOs scale by the Size Multiplier.
Step to First SO (%): Distance from base entry at which SO1 becomes eligible.
Step Multiplier: Ladder factor that widens each subsequent deviation step.
Size Multiplier: Factor that grows each subsequent safety order's USDT margin.
Entry RSI Timeframe / Length / Level: Lower-timeframe RSI oversold-dip filter.
EMA Timeframe / Fast / Slow: Higher-timeframe trend confirmation filter.
Take Profit (%) / Trailing Deviation (%): TP target above avg entry and trailing buffer.
Stop Loss (%): Hard stop below avg entry.
Force Close After Max Hold / Max Hold (seconds): Timeout for forced market close.
DCA Bot Webhook: Bot ID, Email Token, and Pair fields injected into every alert payload.
Visualization: Toggle SO Ladder, Avg / TP / SL plot lines, fill labels, status table.
Brand Watermark: Configurable text, position, size, and transparency.
👨🏻💻💭 We hope this tool helps enhance your trading. Your feedback is invaluable, so feel free to share any suggestions for improvements or new features you'd like to see implemented.
__
The information and publications within the 3Commas TradingView account are not meant to be and do not constitute financial, investment, trading, or other types of advice or recommendations supplied or endorsed by 3Commas and any of the parties acting on behalf of 3Commas, including its employees, contractors, ambassadors, etc. استراتيجية
مؤشر

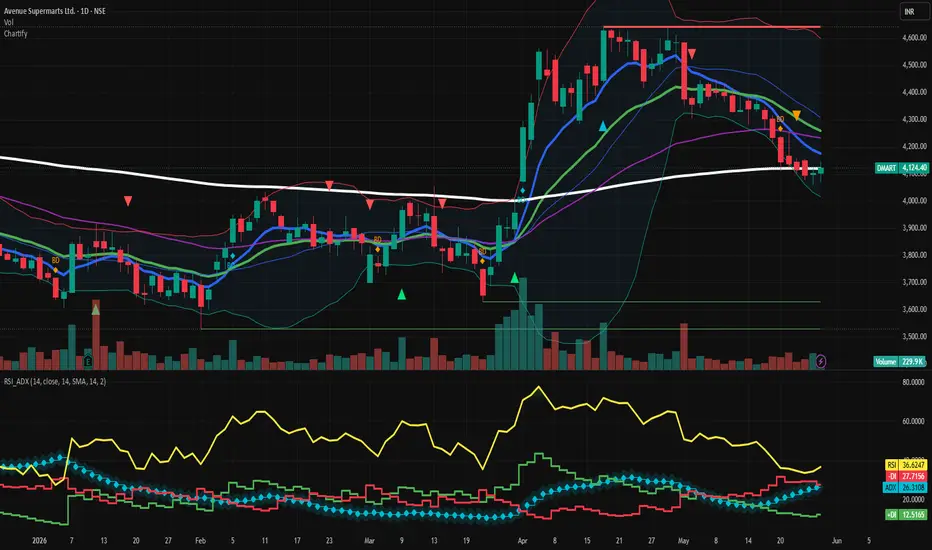
Daily MA Bounce & Rejection 8 MAs UnifiedStrict bounce/rejection setups on 8 daily MAs (EMA 8/21/50/100/200 + SMA 50/100/200). One indicator, longs + shorts,position-relative.
A unified moving-average strategy indicator that fires only the highest-conviction setups: strict bounces off MA support (price above MA,
holds, closes back up) and strict rejections from MA resistance (price below MA, fails to break through, closes back down).
Covers the full institutional MA stack:
- 5 EMAs: 8 (short-term trend), 21 (intraday trend), 50 (intermediate), 100 (long-term), 200 (secular)
- 3 SMAs: 50, 100, 200 (the classical institutional levels watched alongside the EMAs)
The position-relative model treats any MA as support when price is above it, resistance when price is below it. Same logic across all 8 MAs
— no separate scripts for support vs resistance, no separate longs vs shorts.
Targets are the nearest MAs on the far side of entry (overhead MAs for longs, underfoot for shorts) — natural structural exits, not
arbitrary R-multiples. مؤشر