Alpha Forge Singularity Engine v1.6The Singularity Engine is a market energy and force-based oscillator designed to identify moments of abnormal market pressure, directional expansion, compression, aftershock behavior, and potential liquidity trap conditions.
Instead of acting like a traditional momentum oscillator, Singularity attempts to read the market field around price action:
Is energy building?
Is directional force increasing?
Did price enter a high-pressure expansion phase?
Is the market drifting after a major impulse?
Are traders potentially trapped after a sweep?
Has the latest signal reached a user-defined TP or SL?
The goal is not to predict price, but to provide a structured view of market behavior and context.
Core Concept
Singularity uses a custom market energy model built from:
Candle body movement
Total candle range
ATR-based expansion
Volume mass
Close location within the candle
Directional force
This creates a normalized energy score and directional force reading that are used to classify the current market state.
The engine can identify states such as:
Bull Singularity
Bear Singularity
Bull / Bear Force Burst
Charging
Aftershock
Bull / Bear Drift
Recovery
Possible or Confirmed Trap
Coiling
Stable Field
Void / No Edge
Optional Overlay BUY / SELL Signals
Users can choose to display BUY / SELL labels directly on the price chart.
Overlay signals are optional and can be controlled from the settings panel.
Signal modes include:
Conservative
Only uses full Singularity events.
Standard
Uses Singularity events, Force Bursts, and Recovery conditions.
Aggressive
Also allows Charging conditions for earlier but more active signals.
Users can also choose whether grades appear on the overlay labels, such as:
BUY A
SELL A+
BUY B+
Signal Grading
Singularity includes an internal grading model that scores BUY and SELL conditions using energy, directional force, volume mass, range expansion, trend context, recovery behavior, and charging behavior.
Available grades:
A+
A
B+
B
C
Users can filter overlay signals by minimum grade:
A+ only
A and above
B+ and above
B and above
C and above
All
This allows users to control how selective or active the overlay signals are.
TP / SL Tracker
v1.6 includes an optional latest signal trade tracker.
When an overlay BUY or SELL signal appears, the tracker can monitor that latest signal using user-defined take profit and stop loss settings.
Users can choose:
Percent-based TP / SL
ATR-based TP / SL
Track BUY signals
Track SELL signals
Show active entry line
Show active TP / SL lines
Show TP / SL result markers
Keep only the latest TP / SL marker
Example result markers:
TP ✓
SL ✕
The tracker is visual only. It is designed to help users quickly see whether the most recent signal reached the selected TP or SL level.
HUD Dashboard
The Alpha Forge HUD provides a quick readout of the current market field.
The dashboard includes:
Current Field
Energy Score
Live Force
Active Grade
Last Signal
Bars Ago
Trade Status
Result
Last Entry
Last TP
Last SL
Impulse Memory
Mode
This allows users to see whether the market is actively expanding, cooling, drifting, recovering, or entering a higher-risk trap/aftershock phase.
Filters
The indicator includes optional filters for additional control:
EMA trend filter
Higher-timeframe bias filter
Session filter
Grade filter
Signal cooldown
Trap cooldown
Singularity cooldown
Burst cooldown
These settings allow the tool to be adjusted for different markets and timeframes.
Trap Logic
Singularity includes liquidity sweep and rejection logic.
Trap mode can be set to:
Possible
Labels possible long or short trap conditions immediately after a sweep/rejection.
Confirmed
Waits for follow-through confirmation before labeling a trap condition.
This helps users distinguish between early warning signals and more confirmed trap behavior.
Best Used For
The Singularity Engine can be used on:
Stocks
Crypto
Forex
Indices
Intraday charts
Swing-trading timeframes
It is especially useful for traders who want to see abnormal energy events, directional pressure, continuation risk, exhaustion risk, and post-signal TP/SL tracking in one clean interface.
Important Notes
This indicator is not a standalone trading system and does not guarantee future results. The BUY / SELL labels and TP / SL tracker are visual tools based on the selected settings. Users should combine this tool with their own analysis, risk management, and market context.
Signals can behave differently across tickers, timeframes, volatility conditions, and session types. Always test and tune settings before relying on any indicator in live conditions.
Suggested Starting Settings
For general testing:
Overlay Signal Mode: Standard
Minimum Overlay Grade: B+
TP / SL Mode: Percent
Take Profit %: 2.0
Stop Loss %: 1.0
Trap Mode: Possible
Use EMA Trend Filter: Off
Use Higher Timeframe Bias Filter: Off
Use Session Filter: Off
Oscillator Label Mode: Standard
For cleaner signals:
Overlay Signal Mode: Conservative
Minimum Overlay Grade: A
Oscillator Label Mode: Minimal
For more active signals:
Overlay Signal Mode: Aggressive
Minimum Overlay Grade: B
Read the field. Track the force. Follow the expansion. مؤشر

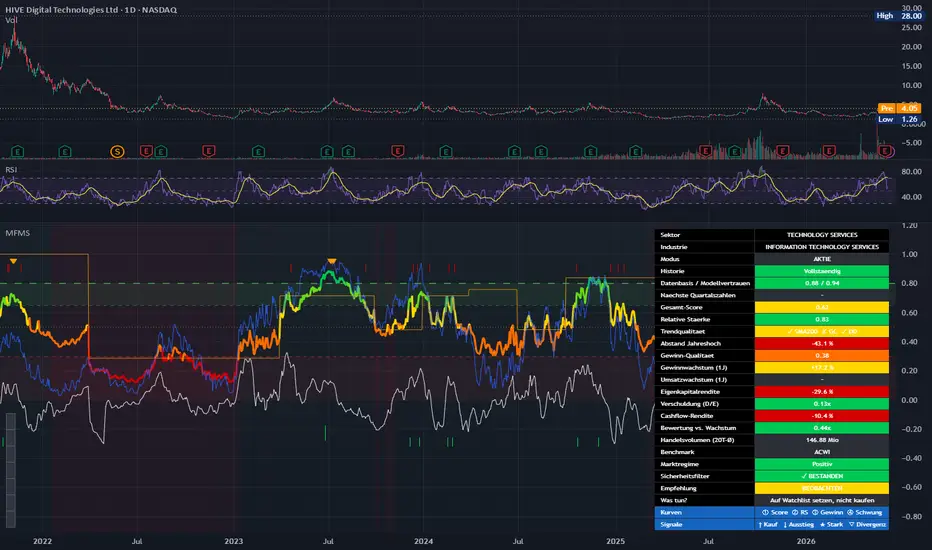
Multi-Factor Market Score v2.0 [DE]Multi-Factor Market Score v2.0 is a multi-factor ranking and analysis tool for stocks, ETFs/indices, and other liquid markets based on daily data.
It combines relative strength, trend quality, and—when stock fundamentals are available—earnings quality into a unified score from 0.00 to 1.00.
The script includes automatic instrument classification, benchmark logic, history checks, data coverage/model confidence, safety filters, and clear zones for watchlist, buy, and strong buy conditions.
Its panel shows the main score drivers, including relative strength, trend quality, distance from the 52-week high, benchmark context, fundamental metrics, and the current model assessment.
Important: the current public version of the script is available in German only.
All labels, tooltips, table entries, and alert texts inside the script are currently written in German, even though this publication description is in English.
This script is a structured analysis tool, not an autonomous trading system.
Depending on the TradingView data feed, small caps, or special cases, some fundamental inputs may be incomplete, delayed, or unusual despite mathematically correct processing, so score, coverage, and individual data points should always be interpreted together. مؤشر

Alpha Forge Analyst EngineAnalyst conviction. Target-price reality. Valuation context. Directly on your chart.
The Analyst Engine is a market intelligence overlay designed to answer one important question:
Do analysts still support this stock at the current chart price?
Most traders see analyst ratings like Buy, Hold, or Strong Buy and stop there. But ratings alone are not enough. A stock can have bullish analyst coverage and still be trading near, or even above, the average analyst target.
Analyst Engine combines analyst recommendations, price targets, current chart price, target upside, median target confirmation, target range risk, and valuation context into one clean dashboard.
This is not a buy/sell signal system. It is a decision-support layer built to help traders understand whether analyst support still makes sense at today’s price.
What It Does
Analyst Engine evaluates:
Analyst recommendation strength
Buy consensus percentage
Total analyst coverage
Current price vs average target
Current price vs median target
High / low target range
Target upside and median upside
Target range quality
Low-target downside risk
Analyst target confidence
Basic valuation context such as P/E, P/S, and EPS when available
The result is a clear readout showing whether the stock is supported, volatile, cautious, over target, or lacking available Pine-accessible analyst data.
Core Question
Do analysts still support this stock at the current chart price?
The indicator does not simply show that analysts are bullish.
It checks whether that bullishness still matters relative to the live chart price.
Example:
A stock may have 90% buy consensus, but if price is already above the average analyst target, the engine can flag it as:
Over Target
Another stock may have strong upside, but if analyst targets are extremely spread out, the engine may classify it as:
Support / Volatile
That is the edge of this tool.
Key Features
Analyst Recommendation Engine
Displays available TradingView Pine-accessible analyst recommendation data, including:
Strong Buy
Buy
Hold
Sell / Strong Sell
Total coverage
Buy consensus %
This helps separate truly strong analyst support from mixed or weak coverage.
Target Price Reality Check
The engine compares the live chart price against:
Average analyst target
Median analyst target
High analyst target
Low analyst target
It then calculates:
Average target upside
Median target upside
Current price zone
Over-target condition
Low-target downside risk
This helps avoid blindly trusting ratings when price has already moved too far.
Median Target Confirmation
v2.0 uses the median target to help determine whether the average target is supported by the broader analyst group or potentially distorted by outliers.
For example:
Median confirms upside
The average and median targets are reasonably aligned.
Split target structure
Average and median targets disagree, or the high/low target range is extremely wide.
This adds an extra layer of quality control to analyst target data.
Target Confidence Layer
Not all analyst targets are equally useful.
The indicator evaluates target structure and classifies confidence as:
High
Medium
Volatile
Split
A stock with huge upside but a massive high/low target spread may not deserve high conviction. Alpha Forge adjusts the interpretation accordingly.
Bias + Decision System
The dashboard separates Bias from Decision.
Bias shows the broad analyst condition.
Decision gives a more practical interpretation after considering target upside, target quality, coverage, and valuation context.
Possible readings include:
Strong Support
Support
Support / Volatile
Strong Ratings
Ratings Only
Watch
Watch / Split
Caution
Over Target
No Pine Data
AF Grade System
The indicator includes two grade layers:
Overall Grade
A broader score that considers analyst conviction, target edge, target quality, momentum, and valuation context.
Analyst Grade
A more focused read on analyst support and target structure.
This helps users understand when analyst sentiment is strong but overall conditions are less clean due to valuation, target risk, or missing target data.
Valuation Context
When available, the engine also displays basic valuation/fundamental data:
EPS TTM
P/E ratio
P/S ratio
Revenue TTM
Basic valuation score
This is not intended to replace full fundamental analysis, but it gives helpful context beside analyst support.
Target Lines
By default, the indicator plots the average analyst target only.
High and low target lines can be enabled, but they are disabled by default because extreme targets can flatten the chart scale.
Available target line modes:
Average only
All targets
None
Available target label modes:
Average only
All labels
None
Dashboard Modes
The dashboard is customizable for desktop, tablet, and mobile use.
Available modes include:
Full
Classic Compact
Compact
Micro
Users can adjust:
Dashboard position
Text size
Label width
Dashboard transparency
Score row visibility
Fundamentals visibility
Target quality row visibility
Floating bias label position
Floating bias label size
Suggested Mobile Settings
For mobile, suggested settings are:
Dashboard Mode: Classic Compact
Dashboard Label Width: Narrow
Text Size: Small or Tiny
Target Line Mode: Avg Only
Target Label Mode: Avg Only
Floating Bias Label Position: Right of Price
Fundamentals: Off
How To Read It
Strong Support
Analysts are strongly bullish, price remains below the average target, and target upside is meaningful.
Support
Analysts still support the stock, but upside or conviction may be more moderate.
Support / Volatile
Analyst support exists and median target may confirm upside, but the target range is wide or uncertain.
Strong Ratings
Ratings are strongly positive, but price target data may not be available through Pine for that symbol.
Ratings Only
Recommendation data is available, but target-price data is unavailable.
Watch
Some support exists, but the edge is not clean enough.
Caution
Upside is weak, ratings are mixed, target structure is poor, or valuation context is stretched.
Over Target
Current price is above the average analyst target.
No Pine Data
TradingView may not expose analyst data to Pine Script for that symbol, even if analyst information appears elsewhere on the platform.
Important Data Note
Analyst data availability depends on what TradingView exposes to Pine Script for each symbol.
Some stocks may provide full analyst recommendation and target-price data. Others may provide ratings only. Some may show analyst data in TradingView’s interface but return no analyst data inside Pine.
The indicator is automatic-only by design. Manual analyst inputs are not included because manually entered data can become stale and may miss upgrades, downgrades, target raises, or target cuts.
Best Used For
Analyst Engine is best used as a confirmation and decision-support tool.
It pairs well with:
Trend-following systems
Momentum indicators
Breakout setups
Reversal tools
Swing trading strategies
Options watchlists
Long-term stock reviews
Use it to help answer:
Is this stock still supported by analysts at today’s price, or has the setup become stretched, uncertain, or over-target?
Disclaimer
This indicator is for educational and informational purposes only. Analyst ratings and target prices are estimates and can change at any time. They are not guarantees of future price movement.
Analyst Engine does not provide financial advice and should not be used as a standalone buy or sell signal. Always combine analyst data with price action, risk management, market conditions, and your own research.
مؤشر

[3Commas] BTC Grid - Long Indicator BTC Grid — Long Indicator
🔷 What it does:
This is a signal-only indicator that mirrors a price-grid long workflow on BTCUSDT.P between two fixed bounds. It tracks up to 50 independent virtual slots between a configurable High and Low — each slot fires a webhook-ready buy signal when price crosses down through it, and a paired sell signal when price subsequently crosses up through the slot immediately above. The indicator computes a running average entry, total deployed capital, open PnL, and realized PnL from the live slot ledger and renders all of it on the chart.
* Pre-computes 7–200 grid levels in Geometric or Arithmetic spacing.
* Each slot is an independent ownership flag with its own buy/sell webhook payload.
* Avg entry is derived from fill-by-fill bookkeeping — total cost and total qty are updated on every event.
* Every event emits a webhook-ready JSON alert payload tagged with the specific grid slot.
🔷 Who is it for:
* Swing traders harvesting volatility on BTC in range-bound regimes.
* Bot operators looking for a chart-driven signal source that emits per-slot JSON ready for a DCA Bot configured for grid execution.
* Traders who want to monitor a virtual grid state — avg entry, owned slots, deployed capital, open PnL — directly on the chart without a backtest engine.
* Portfolio operators using a high-trade-count contributor alongside directional strategies.
🔷 How does it work:
Grid Construction: On script load, the indicator computes N price levels between the configured High and Low bounds. In Geometric mode, level k is at High × (Low/High)^(k/(N-1)), giving constant percent spacing — approximately 1.0% per step at default settings. In Arithmetic mode, levels are linearly spaced by absolute price.
Per-Slot State Machine: Each grid level is an independent slot tracked by a boolean ownership flag. When close price crosses down through an empty slot’s level, the slot is marked owned, virtual cost-basis is added, and the BUY webhook payload is dispatched. When close price crosses up through the level immediately above an owned slot, the slot is marked free, virtual cost-basis is subtracted, and the SELL webhook payload is dispatched.
Honest Virtual Bookkeeping: Total cost and total qty are updated incrementally on each event, so the avg entry, deployed capital, and open PnL displayed in the status table reflect the virtual broker-equivalent position state. The table also accumulates realized PnL from every closed slot.
No Trailing, No Stop Loss: By design, each slot has a fixed exit — the level above. The indicator never trails the exit and never signals a slot-out for a loss.
🔷 Why it’s unique:
* Per-Level Webhook Ledger: Every BUY and SELL emits a fully-formed JSON alert payload tagged with the specific grid slot.
* Fill-by-Fill Avg Entry: The orange avg-entry line is derived from running totals updated on every event.
* Active Slot Highlighting: Owned grid levels are rendered with a thicker green stroke; empty slots stay dashed gray.
* Range Box & Bounds Labels: A semi-transparent box spans the configured High/Low range, with HIGH/LOW labels marking the bounds.
* Calibrated for BTCUSDT.P 15m: Default bounds, level count, and step size are set for BTC’s broad range, with a geometric ladder designed around ~1% spacing.
🔷 Considerations Before Using the Indicator:
Market Selection & Range Validity: Grid strategies are most profitable in range-bound, mean-reverting markets. On strong directional trends below the configured Low, slots will keep marking as owned as price falls and will not free until price reverses.
Capital Deployment: The default Total Investment of 10,000 USDT is a virtual reference used for avg-entry and open-PnL computation. Real sizing happens on the bot side.
Cross Detection Granularity: Crossings are detected on bar close, comparing the current close to the previous close. A bar that spikes through a level and returns within the same bar may be missed by design.
Live vs Historical State: The virtual slot ledger is rebuilt from chart history each time the indicator is recompiled. If the indicator is added mid-deployment or the live bot diverges from the signal stream, the indicator state may not match the live bot.
No Stop Loss: There is no exit signal on adverse moves below the lowest grid level. Risk should be managed on the bot side through capital allocation, range selection, or additional stop logic.
Backtesting Note: This is an indicator, not a strategy. There is no built-in P&L tester. For performance metrics, use the companion strategy version on identical parameters.
🔷 How to Use It:
🔸 Add the indicator to a BTCUSDT.P 15m chart.
🔸 Set the High and Low bounds to a BTC range you expect the market to respect.
🔸 Pick Geometric spacing for percent-based levels or Arithmetic spacing for absolute-price levels.
🔸 Set Grid Levels and the virtual Total Investment used for avg-entry computation.
🔸 In the DCA Bot Webhook group, paste your Bot ID, Email Token, and Pair in QUOTE_BASE format, for example USDT_BTC.
🔸 Create an alert on the indicator with “Any alert() function call”. Paste the DCA Bot’s webhook URL into the alert’s Webhook field.
🔷 INDICATOR SETTINGS
High Price: Top of the grid.
Low Price: Bottom of the grid.
Grid Levels: Number of price levels between High and Low.
Spacing Mode: Geometric or Arithmetic.
Total Investment: Virtual capital allocated across all slots.
Bot ID / Email Token / Pair: Webhook fields injected into every alert payload.
Visualization: Toggle grid lines, range box, HIGH/LOW labels, avg entry plot, fill labels, signal triangles, status table, and watermark.
Brand Watermark: Configurable text, position, size, and transparency.
👨🏻💻💭 We hope this tool helps enhance your trading. Your feedback is invaluable, so feel free to share any suggestions for improvements or new features you'd like to see implemented.
__
The information and publications within the 3Commas TradingView account are not meant to be and do not constitute financial, investment, trading, or other types of advice or recommendations supplied or endorsed by 3Commas and any of the parties acting on behalf of 3Commas, including its employees, contractors, ambassadors, etc.
مؤشر

ORB + Fib Breakout Signals (Strategy)ORB + Fib Breakout Signals (Strategy)
An opening-range breakout (ORB) strategy combined with Fibonacci levels and a
defined risk model. It marks the session's opening range, goes long on a break
above the range high and short below the range low, then manages the trade with
an ATR-based stop, an R-multiple target, and an optional breakeven move.
How it works
- Opening range — builds the high/low of the first 15/30/60 minutes of your
chosen session (timezone configurable).
- Entry — long on a close (or wick) above the ORB high, short below the ORB low;
one signal per direction per day by default.
- Fib levels — plots the standard retracements (.236–.786) inside the range plus
the 1.272 / 1.618 extensions as reference targets.
- Risk model — stop by ATR (default), Fib 0.5, opposite side of the range, or
fixed ticks; target as a multiple of risk (default 2R); optional move to
breakeven after 1R.
- Optional filters — a higher-timeframe EMA trend filter and a scale-out that
books half at 1R and lets the remainder run.
- Daily guards — max entries per day, daily loss limit, optional daily profit
lock, and flat-at-session-close, for prop-style risk rules.
Inputs are grouped (Opening Range, Signals, Fibonacci, Trend Filter, Risk Model,
Daily Guards) so you can adapt it to any index future or timeframe.
Notes
- Commission and slippage are included in the defaults — set them in Properties
to match your broker before drawing conclusions.
- Performance varies with symbol, timeframe, and settings. Test on your own data
and forward-test on a simulator before trading it live.
- This is an educational tool, not financial advice. Past backtest results do
not guarantee future performance. استراتيجية

Fair Value Studio engine paths scenario rails - ClaudeVibe***attempting to fill the gap between "autonomous-AI-research >INPUT*GAP*> chart-autofill"
open to collaboration if you are like-minded.***
your AI model > outputs the below FV rail paths for the stock of interest.
or you know, make a better AI script yourself to share for the retail community who want to get involved. advocacy for community driven investing>institutions.
refine it, make it quarterly when trying to find potential short term inflections.
Pine Script v6 — Fair Value Studio v4.1 rail cards
Paste each comma-separated string into the matching rail-card path input (2-decimal, 2026→2035). Leave blank to fall back to the CAGR shown.
// BEAR (start 137.00 · CAGR 10.50%)
137.00,151.38,167.28,184.84,204.25,225.70,249.40,275.59,304.52,336.50
// BASE (start 330.00 · CAGR 9.50%)
330.00,361.35,395.68,433.27,474.43,519.50,568.85,622.89,682.07,746.86
// BULL (start 545.00 · CAGR 9.00%)
545.00,594.05,647.51,705.79,769.31,838.55,914.02,996.28,1085.95,1183.68
// BLUESKY (start 864.00 · CAGR 8.50%)
864.00,937.44,1017.12,1103.58,1197.38,1299.16,1409.59,1529.40,1659.40,1800.45
Anchor inputs:
start_year = 2026
end_year = 2035
spot_ref = 362.00
bear_cagr = 0.105
base_cagr = 0.095
bull_cagr = 0.090
bluesky_cagr = 0.085
Two notes on construction so the rails behave the way you expect: the paths are intrinsic value compounding at each scenario's cost of equity, not a price forecast — they answer "what do I earn if this thesis is correct and the multiple holds," which is why bear still slopes up (a $137 fair value still accretes at 10.5%; the bear loss is the −62% gap to spot today, not a declining rail). And because GOOG's shareholder yield is now ~0.2% and net-dilutive post-raise, I let the rails accrete at the full CoE with no yield drag — if you want the rails to reflect the dilution explicitly, knock ~30–50bps off each CAGR for the ATM/convert overhang and the bear/base rails flatten meaningfully.
The chart's history line is illustrative (hits both 52-week extremes and the current 4-week pullback) — drop real OHLC into CONFIG.history and the log-regression channel refits automatically.
What it is
It's a TradingView indicator that overlays valuation on top of price. Most charting tools show you what a stock has done; this one draws what it's arguably worth — today and projected forward — so you can see at a glance whether price is running ahead of or behind fundamentals. It's built for someone who does their own valuation work (DCF, multiples) and wants those outputs living on the chart instead of in a spreadsheet.
The core idea: two ways to value a stock
The indicator can either figure out a fair value itself, or take yours.
Automatic mode reads the company's financials from TradingView's data feed — earnings, free cash flow, EBITDA, debt, margins — and classifies the business by sector. A bank gets valued on earnings at ~12x; a heavy/capital-intensive name (energy, utilities, REITs) gets valued on EBITDA on an enterprise basis; a profitable tech company gets valued on free cash flow at a richer multiple, and so on. It picks the metric, the multiple, and the method that fit the business type, then draws the resulting fair value as a line across the price history. A built-in "outlier guard" stops a single weird quarter from throwing the whole thing off.
Manual / studio mode is for when you've done the work elsewhere. You type in a "fair value now" number, and optionally paste forward paths — your own year-by-year fair-value estimates for several scenarios. This matters because the automatic trailing-multiple approach is genuinely poor for certain companies: anything mid-ramp, heavily leveraged, or reinvesting so hard that current earnings understate the business. For those, the indicator will actually flag itself with a warning and tell you to paste a real model.
The headline feature: scenario rails
This is what makes it useful for decision-making. You define four scenarios — bear, base, bull, and a "blue-sky" upside — and the indicator projects each one forward as a "rail" stretching years into the future. You can drive each rail two ways:
Paste a path: a comma-separated list of dollar values, one per year (e.g. 330, 361, 396, 433...). The rail traces exactly those points. This is for when you've modeled each year explicitly.
CAGR fallback: just give a growth rate per scenario, and the rail compounds forward at that rate. Simpler, less precise.
On top of the four scenarios it draws a probability-weighted rail — you assign odds to each scenario (say 25% bear, 40% base, 25% bull, 10% blue-sky) and it blends them into one expected path. It also draws a grey market-implied rail, which just grows today's price at your cost of equity. That grey line is your benchmark: if your weighted rail sits above it, the stock offers more than the return you'd demand; below it, you're not being paid enough for the risk.
Reading the output
Beyond the lines, there's a summary table in the corner that does the arithmetic for you. The single most useful row is the IRR for each scenario — the annualized return you'd earn buying at today's price and reaching that scenario's target over your chosen horizon. It also shows the premium or discount of price versus fair value, what data it used, and whether any guards or warnings fired. There are crossover alerts too, so you can be notified when price crosses through fair value rather than watching the chart.
How someone would actually use it
The honest workflow is: add it to a chart, and if the company is a clean, profitable, stable business, let automatic mode give you a quick read. If it's a complex name — a turnaround, a heavy reinvestor, something with a real growth story — do your valuation elsewhere, then come back and paste your scenario paths and a fair-value anchor. Set your scenario probabilities to match your actual conviction (the defaults are just placeholders — change them). Then look at the weighted IRR and where price sits relative to the rails.
What to be careful about
A few honest limitations worth stating up front. The automatic valuation is a trailing-multiple model — it values the company on what it earned recently, which says nothing about where it's going; treat it as a rough sanity check, not a thesis. The forward rails are only as good as the assumptions you feed them — a beautifully drawn rail built on a wishful growth rate is just a wishful guess with better production values. And one structural quirk: all the scenario rails fan out from a single anchor point, so if your scenarios genuinely start from different intrinsic values, the early years are slightly stylized (the long-run targets and IRRs are unaffected). It's a framework for organizing and visualizing your own judgment — it doesn't replace the judgment.
مؤشر

مؤشر

استراتيجية

BTCUSDT.P Grid Bot - Long StrategyBTC Grid Bot — Long Strategy
🔷 What it does:
This is a long-only price-grid strategy that harvests volatility on BTCUSDT.P through repeated round-trips on a pre-defined ladder of price levels between two fixed bounds. Each level is an independent slot: when price crosses down through a level, the strategy opens one slot; when price subsequently crosses up through the level immediately above, that slot is closed for a fixed round-trip profit. The grid is generated geometrically by default, so spacing adapts to BTC’s price scale.
* Up to 50 simultaneous long slots at default settings, each sized as a fixed fraction of the configured Total Investment.
* No trailing exit, no stop loss — each slot’s exit is the level above its entry.
* Per-slot exposure is approximately 2.00% of equity at default settings.
* Every fill and close emits a webhook-ready JSON alert payload tagged with the specific grid slot.
🔷 Who is it for:
* Swing traders harvesting volatility on BTC in range-bound regimes.
* Bot operators looking for a chart-driven signal source with per-slot webhook JSON ready to drive a DCA Bot configured for grid execution.
* Traders running a portfolio of low-correlation strategies who want a high-trade-count contributor with bounded per-slot exposure.
* Range traders who prefer mechanical execution over discretionary entries.
🔷 How does it work:
Grid Construction: On script load, the strategy computes N price levels between the configured High and Low bounds. In Geometric mode, level k is at High × (Low/High)^(k/(N-1)), giving constant percent spacing — approximately 1.0% per step at default settings.
Per-Slot Logic: Each grid level is an independent slot tracked by a boolean ownership flag. When bar close moves price down through an empty slot’s level, a long is opened at that level for one slot’s worth of capital. When bar close moves price up through the level immediately above an owned slot, that slot is closed.
No Trailing, No Stop Loss: By design, each slot has a fixed exit: the level above. The strategy never trails the exit and never stops a slot out for a loss.
Capital Bounds: Total deployed capital cannot exceed the configured Investment. When all 50 slots are filled, no new orders are opened until price rises and starts closing slots.
🔷 Why it’s unique:
* Per-Level Webhook Ledger: Every fill and close emits a fully-formed JSON alert payload tagged with the specific grid slot.
* Pre-Allocated State: Up to 200 slot ledgers live in fixed-size arrays, allowing fast state tracking and clean chart rendering.
* Honest Backtest Surface: Avg entry, open PnL, realized PnL, owned slots, and per-slot allocation are visible directly on the chart.
* Calibrated for BTCUSDT.P 15m: Default bounds and level count are set for a broad BTC range, with a geometric ladder designed around ~1% steps.
🔷 Considerations Before Using the Strategy:
Market Selection & Range Validity: Grid strategies are most profitable in range-bound, mean-reverting markets. On strong directional moves below the configured Low, slots may remain open until price reverses.
Capital Deployment & Drawdown: The default Investment of 10,000 USDT equals 100% of starting capital. Each slot uses approximately 200 USDT, or 2.00% of equity. Scale the Investment input down if you want lower aggregate exposure.
No Stop Loss Justification: There is no exit on adverse moves below the lowest grid level. The strategy’s risk control is structural: fixed per-slot allocation and capped total investment.
Trade Volume & Fees: BTC 15m grid execution can generate frequent round-trips. The ~1% step is designed to leave room for exchange fees and slippage.
Demo Testing: Always demo-test before going live. Past results do not guarantee future performance.
🔷 STRATEGY PROPERTIES
Symbol: BTCUSDT.P — Bybit BTC perpetual contract.
Timeframe: 15M
Test Period: April 1, 2025 — June 7, 2026.
Initial Capital: 10,000 USDT.
Total Investment: 10,000 USDT.
Order Size per Slot: Investment / 50 ≈ 200 USDT.
Commission: 0.055% per trade.
Slippage: 3 ticks.
Margin for Long Positions: 100%.
Grid Bounds: High 83,689.23 / Low 51,629.65.
Grid Levels: 50.
Spacing Mode: Geometric.
Approx Step: ~1.0%.
Stop Loss: None.
Trailing: None.
Strategy: Long Only.
🔷 STRATEGY RESULTS
⚠️ Remember, whole profit will be get at 82700 price tag
Net Profit: +90.32 USDT (+0.90%)
Max Equity Drawdown: 924.71 USDT (8.63%)
Total Closed Trades: 428
Percent Profitable: 60.51% (259 / 428)
Profit Factor: 1.016
🔷 How to Use It:
🔸 Adjust Settings: Open the strategy inputs and set the High and Low bounds to a BTC range you expect the market to respect. Use Geometric spacing for percent-based grid levels.
🔸 Results Review: Run a full-period backtest and confirm that Max Drawdown, trade count, and Profit Factor are acceptable for your risk profile.
🔸 Create alerts to trigger the DCA Bot: Add one alert on the strategy using “Any alert() function call”. Paste your DCA Bot’s webhook URL into the alert’s Webhook field, and fill the Bot ID, Email Token, and Pair inputs on the script.
🔷 INDICATOR SETTINGS
High Price: Top of the grid.
Low Price: Bottom of the grid.
Grid Levels: Number of price levels between High and Low.
Spacing Mode: Geometric or Arithmetic.
Total Investment: Total capital allocated across all slots.
Bot ID / Email Token / Pair: Webhook fields injected into every alert payload.
Visualization: Toggle grid lines, range box, HIGH/LOW labels, avg entry plot, fill labels, status table, and watermark.
👨🏻💻💭 We hope this tool helps enhance your trading. Your feedback is invaluable, so feel free to share any suggestions for improvements or new features you'd like to see implemented.
__
The information and publications within the 3Commas TradingView account are not meant to be and do not constitute financial, investment, trading, or other types of advice or recommendations supplied or endorsed by 3Commas and any of the parties acting on behalf of 3Commas, including its employees, contractors, ambassadors, etc.
استراتيجية

مؤشر

مؤشر

مؤشر

مؤشر

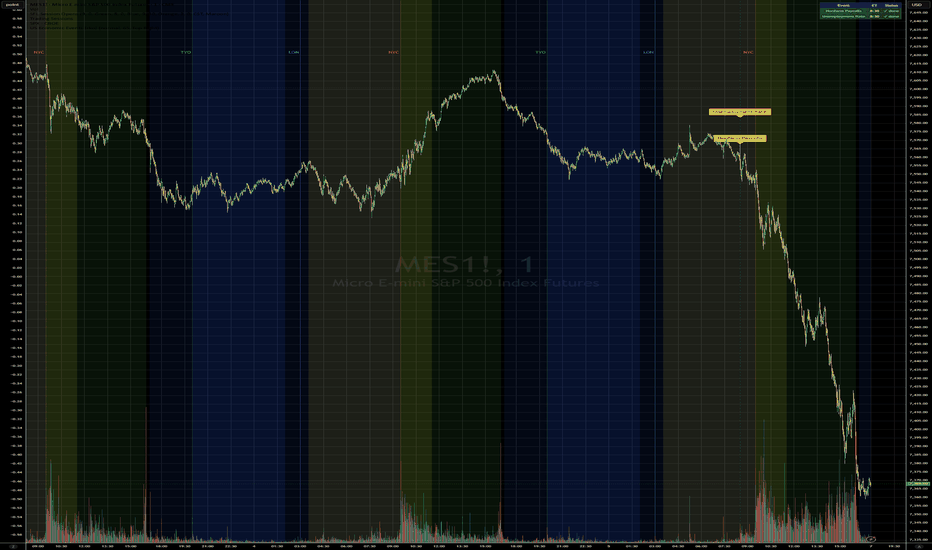
US Economic Events [rko]US Economic Events
Marks major US economic releases directly on the chart with vertical dashed lines and labeled callouts — no dashboard clutter, no manual calendar imports.
How it works
Events are detected two ways:
Calendar rules — NFP/Unemployment Rate (first Friday of month, 8:30 ET), Initial Jobless Claims (every Thursday, 8:30 ET), and ISM Manufacturing PMI (first business day of month, 10:00 ET) are computed from date math alone, requiring no external data
Hybrid detection — CPI, PPI, GDP, and Retail Sales use request.economic() to identify the release day, then snap the marker to the known BLS release time (8:30 ET), giving correct intraday bar placement rather than midnight
Works on any timeframe
Daily and above: marks the correct day
Intraday (30m, 15m, 5m, 1m…): marks the exact bar containing the release time
Today's Dashboard
A compact table (position configurable) shows today's scheduled events with a live countdown for upcoming releases and a ✓ confirmation once they've fired. Disappears on non-event days.
Events included
Nonfarm Payrolls (NFP)
Unemployment Rate (UR)
ISM Manufacturing PMI
Consumer Price Index (CPI)
Producer Price Index (PPI)
Gross Domestic Product (GDP)
Retail Sales
Initial Jobless Claims (optional)
Settings
Each event can be toggled individually. Label size, line transparency, and dashboard position are all adjustable مؤشر
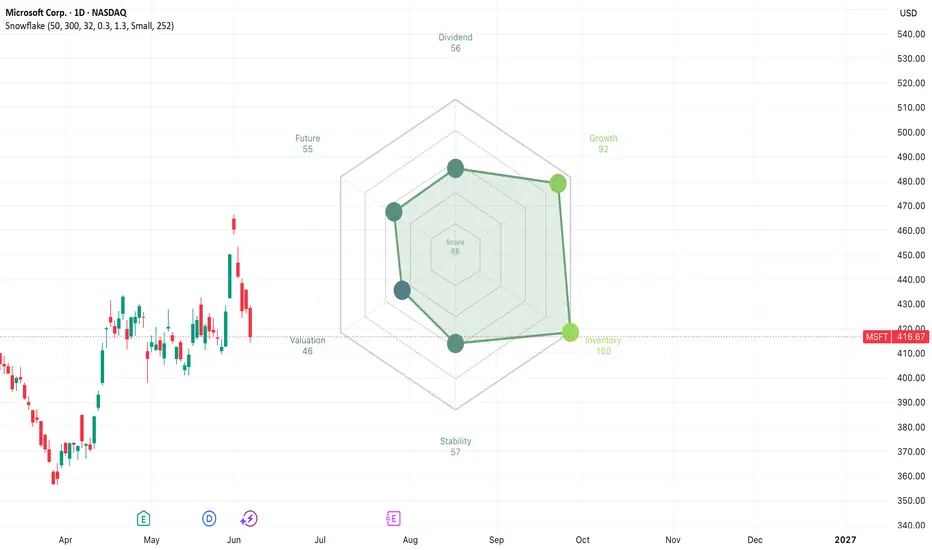
Stock: Snowflake Analysis [invincible3]Stock: Snowflake Analysis
Stock: Snowflake Analysis is a visual fundamental-analysis radar indicator designed for stock traders and investors who want a quick, structured view of a company’s financial quality. The indicator converts multiple TradingView financial metrics into normalized 0–100 scores and displays them as a six-axis snowflake/radar chart directly on the price chart.
The purpose of the indicator is to help users quickly evaluate a stock from several key perspectives: dividend quality, growth, inventory efficiency, financial stability, valuation, and future outlook. Each metric is transformed into a score, then plotted visually so the user can immediately see where a company is strong or weak. The current script uses six core categories: Dividend, Growth, Inventory, Stability, Valuation, and Future, and it draws the final score as a radar/snowflake polygon.
Main Concept
The indicator works by pulling available stock financial data from TradingView using request.financial(). These values are then normalized into scores from 0 to 100.
A score near 100 means the company is strong in that category.
A score near 50 means the company is neutral or average.
A score near 0 means the company is weak in that category.
The final snowflake shape gives a quick visual overview:
A large, balanced snowflake suggests broad financial strength.
A small or uneven snowflake suggests weakness or imbalance.
A stretched shape shows that the company is strong in some areas but weak in others.
Six Core Financial Categories
1. Dividend Score
The Dividend axis evaluates whether the stock provides attractive and sustainable shareholder distributions.
It uses:
Dividend yield
Dividend payout ratio
The dividend yield is scored positively when it is higher, while the payout ratio is scored negatively if it becomes too high. A very high payout ratio may suggest that the dividend is less sustainable.
A strong Dividend score usually means the company has a decent yield without excessive payout pressure.
2. Growth Score
The Growth axis measures how well the company is expanding.
It uses:
Revenue growth
EPS growth
Gross margin
The score rewards companies with improving sales, stronger earnings, and healthier gross margins. A company with strong revenue growth but weak margins may receive a mixed score, while a company with both growth and profitability receives a stronger score.
This category is especially useful for identifying companies with improving business momentum.
3. Inventory Score
The Inventory axis evaluates operating efficiency, especially for businesses where inventory management matters.
It uses:
Inventory turnover
Inventory-to-revenue ratio
Higher inventory turnover is considered positive because it suggests that the company sells its inventory efficiently. A lower inventory-to-revenue ratio is also considered positive because it indicates that inventory is not becoming too heavy relative to sales.
This score is more useful for retail, manufacturing, consumer goods, and industrial companies. It is less meaningful for banks, software companies, or service businesses.
4. Stability Score
The Stability axis measures balance-sheet strength.
It uses:
Current ratio
Debt-to-equity ratio
A higher current ratio generally suggests better short-term liquidity, while a lower debt-to-equity ratio suggests lower financial leverage.
A strong Stability score means the company appears financially safer and less dependent on debt. A weak score may suggest liquidity pressure or excessive leverage.
5. Valuation Score
The Valuation axis evaluates whether the stock appears reasonably priced relative to earnings.
It uses:
Earnings yield
Price-to-earnings ratio
Earnings yield is calculated as:
Earnings Yield = EPS / Price × 100
A higher earnings yield is better. A lower P/E ratio is also better, up to a reasonable threshold. This category rewards companies that generate meaningful earnings relative to their current share price.
A high Valuation score may suggest the stock is cheaper relative to earnings, while a low score may suggest the stock is expensive or earnings are weak.
6. Future Score
The Future axis attempts to measure forward-looking quality.
It uses:
Sustainable growth rate
Forward P/E ratio
A higher sustainable growth rate improves the score, while a very high forward P/E lowers the score. This category tries to balance future growth potential with future valuation risk.
A strong Future score suggests the stock may have a reasonable combination of expected growth and forward valuation.
Final Score
The center score is calculated as the average of the six category scores:
Final Score = Average of Dividend, Growth, Inventory, Stability, Valuation, and Future
This final score is displayed in the center of the radar chart.
The score color changes dynamically using the indicator’s heatmap color theme:
Low scores appear in purple tones.
Mid scores appear in teal tones.
High scores appear in green/yellow tones.
This makes it easier to visually identify weak, neutral, and strong readings.
Visual Design
The indicator displays a clean snowflake/radar chart directly on the price chart. Each axis represents one financial category.
Visual components include:
Hexagonal grid rings
Axis lines
Category labels
Score markers
Filled snowflake polygon
Dynamic color based on total score
Optional historical comparison snowflake
The snowflake is placed to the right side of the latest bar using the Right Offset setting, so it does not cover the current candles.
Historical Comparison
The indicator includes an optional Historical Snowflake feature.
When enabled, it compares the current snowflake with a previous score profile based on the selected historical lookback.
For example:
Historical Lookback = 252 bars
This can be used as an approximate one-year comparison on daily charts.
The historical snowflake helps users see whether the company’s fundamental profile has improved, weakened, or remained stable over time.
Stock-Only Protection
This indicator is designed for stock symbols only because financial metrics such as dividend yield, payout ratio, EPS, revenue growth, and debt-to-equity are stock/company-specific data.
For non-stock symbols such as:
Gold
Forex pairs
Crypto
Indices
Commodities
the script does not draw the snowflake. Instead, it displays a warning message explaining that financial metrics are not available for those instruments.
This prevents misleading neutral scores from appearing on symbols where company financial data does not exist.
Input Settings
Radar Layout
Right Offset Bars
Moves the snowflake to the right side of the latest candle.
Scale Lookback
Controls the price range used to vertically scale the snowflake on the chart. This does not affect the financial scores.
Width
Controls the horizontal size of the radar.
Height %
Controls the vertical size of the radar relative to the recent price range.
Label Distance
Controls how far the category labels are placed from the radar center.
Visual Styling
Show Grid Rings
Turns the hexagonal background rings on or off.
Show Axis Lines
Turns the center-to-axis guide lines on or off.
Show Axis Labels
Shows or hides the category names and scores.
Show Score Markers
Shows or hides circular markers at each snowflake point.
Dynamic Colors
When enabled, the snowflake color changes based on the total average score.
Marker Size
Controls the size of the score markers.
Historical Comparison
Show Historical Snowflake
Displays a previous score profile for comparison.
Historical Lookback Bars
Defines how far back the comparison should be calculated.
How to Interpret the Snowflake
A strong stock usually shows:
A broad and balanced snowflake
High Growth and Stability scores
Reasonable Valuation score
Improving Future score
A risky or weak stock may show:
A compressed snowflake
Very low Stability
Weak Growth
Expensive Valuation
Poor Future score
An unbalanced company may show a stretched snowflake. For example, a high Growth score but low Stability and Valuation scores may indicate a fast-growing but financially risky or expensive company.
Best Use Cases
This indicator is useful for:
Quick stock screening
Comparing companies visually
Identifying financial strengths and weaknesses
Monitoring changes in a company’s financial profile
Combining fundamentals with technical analysis
Long-term investing and swing-trading research
It is especially helpful when comparing stocks within the same sector.
Important Notes
The indicator uses a generic scoring model. Different sectors naturally have different financial structures.
For example:
Banks do not use inventory metrics in the same way as retail companies.
Utilities often carry higher debt.
Technology companies may have low dividend scores but strong growth.
Retail and manufacturing companies rely more heavily on inventory efficiency.
Because of this, the scores should be interpreted with sector context.
Limitations
This indicator should not be used as a standalone buy or sell signal.
Financial data can be delayed, unavailable, or inconsistent depending on the symbol and exchange. When a financial metric is missing, the script uses a neutral internal fallback value to keep the radar visually stable.
The indicator is best used as a summary and comparison tool, not as a complete valuation model.
Disclaimer
Snowflake Analysis is an educational and research tool. It is not financial advice. Users should always combine this indicator with their own analysis, sector research, risk management, and broader market context before making trading or investment decisions. مؤشر

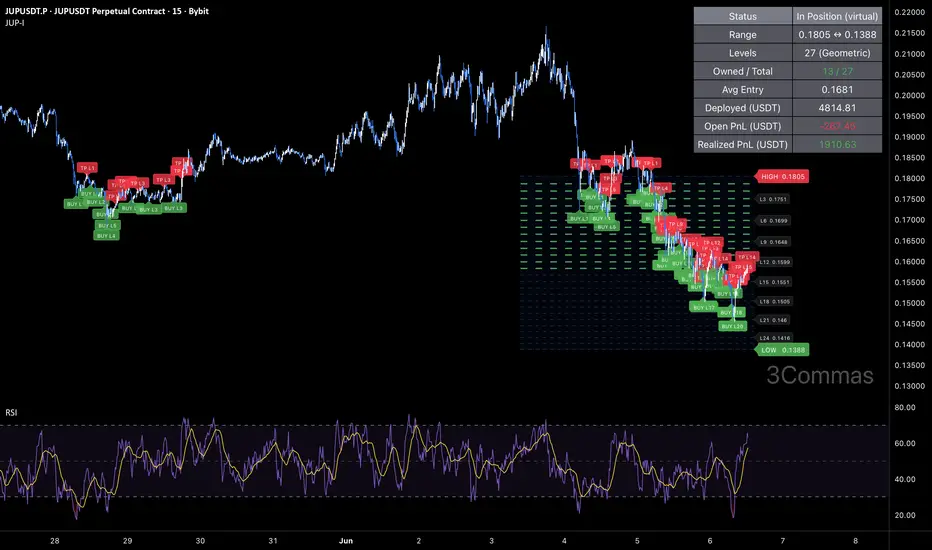
[3Commas] JUP Grid - Long IndicatorJUP Grid — Long Indicator
🔷 What it does:
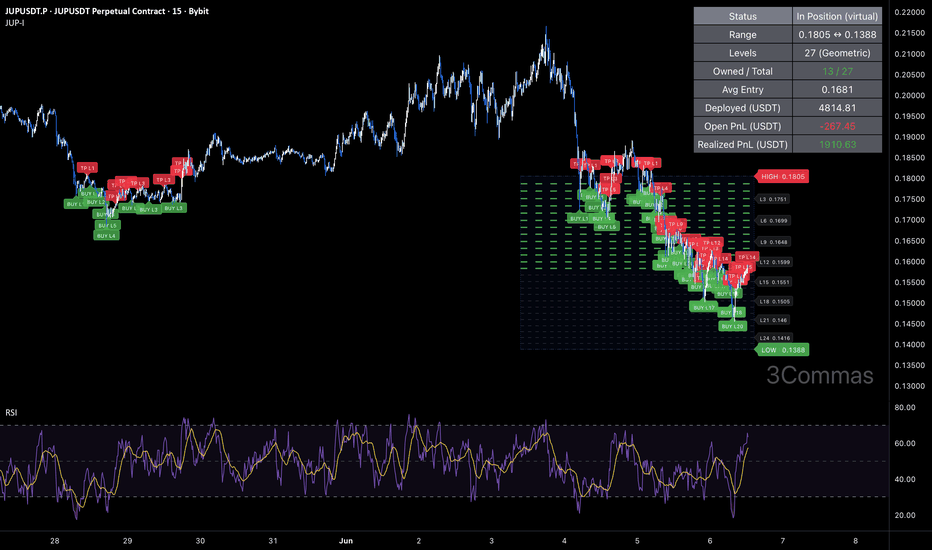
This is a signal-only indicator that mirrors a price-grid long workflow on JUP / USDT between two fixed bounds. It tracks up to 27 independent virtual slots between a configurable High and Low — each slot fires a webhook-ready buy signal when price crosses down through it, and a paired sell signal when price subsequently crosses up through the slot immediately above. The indicator computes a running average entry, total deployed capital, and open PnL from the live slot ledger and renders all of it on the chart.
- Pre-computes 7–200 grid levels in Geometric (default) or Arithmetic spacing.
- Each slot is an independent ownership flag with its own buy/sell webhook payload.
- Avg entry is derived from fill-by-fill bookkeeping — total cost and total qty are updated on every event.
- Every event emits a webhook-ready JSON alert payload tagged with the specific grid slot.
🔷 Who is it for:
- Swing traders harvesting volatility on JUP in range-bound regimes.
- Bot operators looking for a chart-driven signal source that emits per-slot JSON ready for a DCA Bot configured for grid execution.
- Traders who want to monitor a virtual grid state — avg entry, owned slots, deployed capital, open PnL — directly on the chart without a backtest engine.
- Portfolio operators using a high-trade-count contributor alongside directional strategies.
🔷 How does it work:
Grid Construction: On script load, the indicator computes N price levels between the configured High and Low bounds. In Geometric mode (default), level k is at High × (Low/High)^(k/(N-1)), giving constant percent spacing — approximately 1.0% per step at default settings. In Arithmetic mode, levels are linearly spaced by absolute price.
Per-Slot State Machine: Each grid level is an independent slot tracked by a boolean ownership flag. When close price crosses down through an empty slot's level, the slot is marked owned, virtual cost-basis is added, and the BUY webhook payload is dispatched. When close price crosses up through the level immediately above an owned slot, the slot is marked free, virtual cost-basis is subtracted, and the SELL webhook payload is dispatched.
Honest Virtual Bookkeeping: Total cost and total qty are updated incrementally on each event, so the avg entry, deployed capital, and open PnL displayed in the status table reflect the actual broker-equivalent position state — no shortcuts from base entry, no synthetic averaging. The table also accumulates the realized PnL from every closed slot (the exact round-trip profit between adjacent levels), so it shows how much the grid has actually earned over the chart history.
No Trailing, No Stop Loss: By design, each slot has a fixed exit (the level above). The indicator never trails the exit and never signals a slot-out for a loss — slots that fall below their entry stay owned until price comes back. This is the canonical grid-bot behavior.
🔷 Why it's unique:
- Per-Level Webhook Ledger: Every BUY and SELL emits a fully-formed JSON alert payload tagged with the specific grid slot ("Grid_BUY_L5" / "Grid_TP_L5"). The indicator can drive a DCA Bot configured for grid emulation without any glue layer.
- Fill-by-Fill Avg Entry: The orange avg-entry line is derived from running totals updated on every event — what you see is what the broker-equivalent position would actually have.
- Active Slot Highlighting: Owned grid levels are rendered with a thicker green stroke; empty slots stay dashed gray. Slot density and current loading are visible at a glance.
- Range Box & Bounds Labels: A semi-transparent box spans the configured High/Low range, and crisp HIGH/LOW labels mark the bounds — the grid topology is obvious without zooming.
- Calibrated for JUP 15m: Default bounds, level count, and step size are set against JUP's recent observed range. The 27-level geometric ladder gives roughly 1.0% per step — wide enough to clear taker fees on each round-trip, granular enough to keep catching 15m swings inside the range.
🔷 Considerations Before Using the Indicator:
Market Selection & Range Validity: Grid strategies are most profitable in range-bound, mean-reverting markets. On strong directional trends below the configured Low, slots will keep marking as owned as price falls and won't free until price reverses. The default High/Low (0.1805 / 0.1388) was set against JUP's recent observed range; update both whenever the regime changes.
Capital Deployment: The default Total Investment of 10,000 USDT is a virtual reference used for the avg-entry and open-PnL computation. The real sizing happens on the bot side — match the indicator's per-slot allocation to your bot's grid configuration to keep the avg-entry display honest.
Cross Detection Granularity: Crossings are detected on bar close, comparing the current close to the previous close. A bar that spikes through a level and returns within the same bar may be missed by design — this prevents over-signaling on intra-bar wicks.
Live vs Historical State: The virtual slot ledger is rebuilt from chart history each time the indicator is recompiled. If the indicator is added mid-deployment or the live bot diverges from the signal stream (manual interventions, partial fills), the indicator state may not match the live bot. Toggle the indicator off and on to reset.
No Stop Loss: There is no exit signal on adverse moves below the lowest grid level. Risk is structurally capped on the bot side by the bounded Total Investment configured at the bot. If a hard stop is required, layer it on the bot side.
Backtesting Note: This is an indicator, not a strategy. There is no built-in P&L tester. For performance metrics over a ~4-month sample (865 closed trades, 57.34% win rate, 11.60% max drawdown, profit factor 1.555, +18.66% net return), use the companion strategy version on identical parameters. The 865-trade sample is well above the ~100-trade floor for statistical relevance.
🔷 How to Use It:
🔸 Add the indicator to a JUP / USDT 15m chart.
🔸 Set the High and Low bounds to a range you expect JUP to respect.
🔸 Pick Geometric (default, recommended) or Arithmetic spacing.
🔸 Set Grid Levels (7–200) and the virtual Total Investment used for avg-entry computation.
🔸 In the DCA Bot Webhook group, paste your Bot ID, Email Token, and Pair (QUOTE_BASE format, e.g., USDT_JUP).
🔸 Create an alert on the indicator with "Any alert() function call". Paste the DCA Bot's webhook URL into the alert's Webhook field. Every grid-level buy and grid-level close will emit a dedicated JSON payload tagged with the slot index, so each level can be tracked independently downstream.
🔷 INDICATOR SETTINGS
High Price: Top of the grid. The highest level a slot can be created from.
Low Price: Bottom of the grid. The lowest level a slot can be created from.
Grid Levels: Number of price levels between High and Low (default 27, range 7–200).
Spacing Mode: Geometric (constant percent step) or Arithmetic (constant absolute step).
Total Investment (USDT): Virtual capital allocated across all slots. Used for the avg-entry and open-PnL computation only.
Bot ID / Email Token / Pair: Webhook fields injected into every alert payload.
Visualization: Toggle grid lines, range box, HIGH/LOW labels, avg entry plot, fill labels, signal triangles, status table (shows status, range, levels, owned slots, avg entry, deployed capital, open PnL, and cumulative realized PnL).
Brand Watermark: Configurable text, position, size, and transparency.
👨🏻💻💭 We hope this tool helps enhance your trading. Your feedback is invaluable, so feel free to share any suggestions for improvements or new features you'd like to see implemented.
__
The information and publications within the 3Commas TradingView account are not meant to be and do not constitute financial, investment, trading, or other types of advice or recommendations supplied or endorsed by 3Commas and any of the parties acting on behalf of 3Commas, including its employees, contractors, ambassadors, etc. مؤشر
[3Commas] JUP Grid Bot - Long StrategyJUP Grid Bot — Long Strategy
🔷 What it does:
This is a long-only price-grid strategy that harvests volatility on JUP / USDT through repeated round-trips on a pre-defined ladder of price levels between two fixed bounds. Each level is an independent slot: when price crosses down through a level, the strategy opens one slot; when price subsequently crosses up through the level immediately above, that slot is closed for a fixed round-trip profit. The grid is generated geometrically by default, so spacing adapts to the price scale.
- Up to 27 simultaneous long slots at default settings, each sized as a fixed fraction of the configured Total Investment.
- No trailing exit, no stop loss — each slot's exit is the level above its entry.
- Per-slot exposure is approximately 3.70% of equity at default settings, comfortably inside the conventional 5–10% per-trade risk band.
- Every fill and close emits a webhook-ready JSON alert payload tagged with the specific grid slot.
🔷 Who is it for:
- Swing traders harvesting volatility on JUP in range-bound regimes.
- Bot operators looking for a chart-driven signal source with per-slot webhook JSON ready to drive a DCA Bot configured for grid execution.
- Traders running a portfolio of low-correlation strategies who want a high-trade-count contributor with bounded per-trade risk.
- Range traders who prefer mechanical execution over discretionary entries.
🔷 How does it work:
Grid Construction: On script load, the strategy computes N price levels between the configured High and Low bounds. In Geometric mode (default), level k is at High × (Low/High)^(k/(N-1)), giving constant percent spacing — approximately 1.0% per step at default settings. In Arithmetic mode, levels are linearly spaced by absolute price.
Per-Slot Logic: Each grid level is an independent slot tracked by a boolean ownership flag. When bar close moves price down through an empty slot's level, a long is opened at that level for one slot's worth of capital (Investment / N). When bar close moves price up through the level immediately above an owned slot, that slot is closed, locking the round-trip profit between the two adjacent levels.
No Trailing, No Stop Loss: By design, each slot has a fixed exit (the level above). The strategy never trails the exit and never stops a slot out for a loss — slots whose entry price is below current market simply wait until price comes back. This is the canonical grid-bot behavior.
Capital Bounds: Total deployed capital cannot exceed the configured Investment. When all 27 slots are filled, no new orders are opened until price rises and starts closing slots. This structural cap is the strategy's primary risk control.
🔷 Why it's unique:
- Per-Level Webhook Ledger: Every fill and close emits a fully-formed JSON alert payload tagged with the specific grid slot ("Grid_BUY_L5" / "Grid_TP_L5"). The strategy can drive a DCA Bot configured for grid emulation without any glue layer.
- Pre-Allocated State: All up to 200 slot ledgers live in fixed-size arrays, so state lookups are constant-time and the chart can render every active slot with no performance overhead.
- Honest Backtest Surface: The avg entry line plotted on the chart and the open PnL displayed in the status table both reflect the actual broker-equivalent position state — derived from fill-by-fill bookkeeping, not synthetic averaging. The status table also reports the cumulative realized net profit (how much the grid has actually earned, in USDT and % of starting capital), so live performance is visible directly on the chart.
- Calibrated for JUP 15m: Default bounds, level count, and step size are set against JUP's recent observed range. The 27-level geometric ladder gives roughly 1.0% per step — wide enough to clear taker fees on each round-trip, granular enough to keep catching 15m swings inside the range.
🔷 Considerations Before Using the Strategy:
Market Selection & Range Validity: Grid strategies are most profitable in range-bound, mean-reverting markets. On strong directional trends below the configured Low, slots will keep loading as price falls and won't close until price reverses. The default High/Low (0.1805 / 0.1388) was set against JUP's recent observed range; update both whenever the regime changes.
Capital Deployment & Drawdown: The default Investment of 10,000 USDT equals 100% of starting capital — high-conviction setting that assumes the configured range holds. Per-slot risk is moderate (~3.70% of equity), but if price collapses below the Low bound, aggregate unrealized loss can grow further. Scale the Investment input down to match the worst-case drawdown you are willing to absorb in a range-break scenario.
No Stop Loss Justification: There is no exit on adverse moves below the lowest grid level. The strategy's per-trade risk is structurally capped by the per-slot allocation (Investment / N levels) — at defaults that is ~370 USDT per slot, inside the conventional 5–10% per-trade band. The aggregate unrealized exposure is controlled separately via the Investment input.
Trade Volume & Fees: Grid bots on 15m generate a high number of round-trips. The ~1.0% step is deliberately wider than a tight scalp grid so each round-trip comfortably clears the taker fee. The default commission (0.06% per trade) should be matched to your exchange's actual fees; any mismatch will materially shift the results.
Demo Testing: Always demo-test before going live. Past results do not guarantee future performance, especially on a strategy whose profitability is bounded by the chosen High/Low range remaining valid.
🔷 STRATEGY PROPERTIES
Symbol: JUPUSDT — strategy is portable to any JUP / USDT pair.
Timeframe: 15M
Test Period: February 6, 2026 — June 6, 2026 (~4 months).
Initial Capital: 10,000 USDT.
Total Investment: 10,000 USDT (100% of capital, high-conviction setting).
Order Size per Slot: Investment / 27 ≈ 370 USDT (~3.70% of equity).
Commission: 0.06% per trade.
Slippage: 3 ticks.
Margin for Long Positions: 100%.
Indicator Settings: Default Configuration.
Grid Bounds: High 0.1805 / Low 0.1388 (range −23.10%).
Grid Levels: 27 (Geometric spacing, ~1.0% per step).
Stop Loss: None — per-slot allocation is the structural risk cap.
Trailing: None.
Strategy: Long Only.
🔷 STRATEGY RESULTS
⚠️ Remember, past results do not guarantee future performance.
Net Profit: +1,866.03 USDT (+18.66%)
Max Equity Drawdown: 1,244.70 USDT (11.60%)
Total Closed Trades: 865
Percent Profitable: 57.34% (496 / 865)
Profit Factor: 1.555
🔷 How to Use It:
🔸 Adjust Settings: Open the strategy inputs and set the High and Low bounds to a range you expect JUP to respect. Pick Geometric for percent-spaced levels (default, recommended) or Arithmetic. Set Grid Levels (7–200) and Total Investment to match your risk profile.
🔸 Results Review: Run a full-period backtest and confirm Max Drawdown stays within your personal risk band. Validate that the trade count is high enough to be statistically meaningful — this configuration produced 865 closed trades over the test window, well above the ~100-trade floor for statistical relevance.
🔸 Create alerts to trigger the DCA Bot: Add one alert on the strategy using "Any alert() function call". Paste your DCA Bot's webhook URL into the alert's Webhook field, and fill the Bot ID, Email Token, and Pair inputs on the script. Every grid-level buy and grid-level close will emit a dedicated JSON payload tagged with the slot index, so each level can be tracked independently downstream.
🔷 INDICATOR SETTINGS
High Price: Top of the grid. The highest level a slot can be created from.
Low Price: Bottom of the grid. The lowest level a slot can be created from.
Grid Levels: Number of price levels between High and Low (default 27, range 7–200).
Spacing Mode: Geometric (constant percent step) or Arithmetic (constant absolute step).
Total Investment (USDT): Total capital allocated across all slots. Per-slot size = Investment / Grid Levels.
Bot ID / Email Token / Pair: Webhook fields injected into every alert payload.
Visualization: Toggle grid lines, range box, HIGH/LOW labels, avg entry plot, fill labels, status table (shows range, levels, owned slots, investment, per-slot size, open PnL, and cumulative realized net profit).
Brand Watermark: Configurable text, position, size, and transparency.
👨🏻💻💭 We hope this tool helps enhance your trading. Your feedback is invaluable, so feel free to share any suggestions for improvements or new features you'd like to see implemented.
__
The information and publications within the 3Commas TradingView account are not meant to be and do not constitute financial, investment, trading, or other types of advice or recommendations supplied or endorsed by 3Commas and any of the parties acting on behalf of 3Commas, including its employees, contractors, ambassadors, etc. استراتيجية

مؤشر

24H Vol & MTF Volatility24H Vol & MTF Volatility Dashboard
The 24H Vol & MTF Volatility indicator is a clean, compact dashboard that acts as a real-time health check for any asset. Instead of cluttering your screen with multiple indicators and moving averages, it displays vital volume, volatility, and trend performance statistics inside one simple table.
Key Features
24-Hour Volume: Shows exactly how much money (in USD) has traded hands over the last 24 hours. It updates continuously, giving you an accurate picture of the asset's current liquidity.
Multi-Timeframe Volatility: Instantly see how much the price is stretching on a Daily, Weekly, and Monthly basis. This helps you quickly gauge if the market is unusually quiet or experiencing high-risk, volatile spikes.
Live Price Tracking: Tracks both Daily and Monthly price changes. The numbers automatically flash Green when the price is up and Red when the price is down.
How to Customize Your Dashboard
This indicator is built to be modular, meaning you can adjust it to fit your exact trading layout.
1. Choose Your Theme
Matches your TradingView charts perfectly with a quick dropdown menu:
Dark Mode: Deep, dark backgrounds with bright text—perfect for night trading.
Light Mode: Clean, crisp backgrounds with dark text—ideal for high-visibility day trading.
2. Clean, Auto-Resizing Layout
Don't care about monthly stats? Only want to see 24H volume? No problem. In the settings menu, you can turn individual rows on or off.
When you hide a row, the table automatically shrinks and cleans itself up, ensuring there are no ugly blank spaces left on your chart.
3. Place It Anywhere
You can scale the text size (Tiny, Small, Normal, Large) and snap the table to any of the 9 positions on your chart (such as the bottom-left, top-right, or dead center) so it never blocks your price action. مؤشر

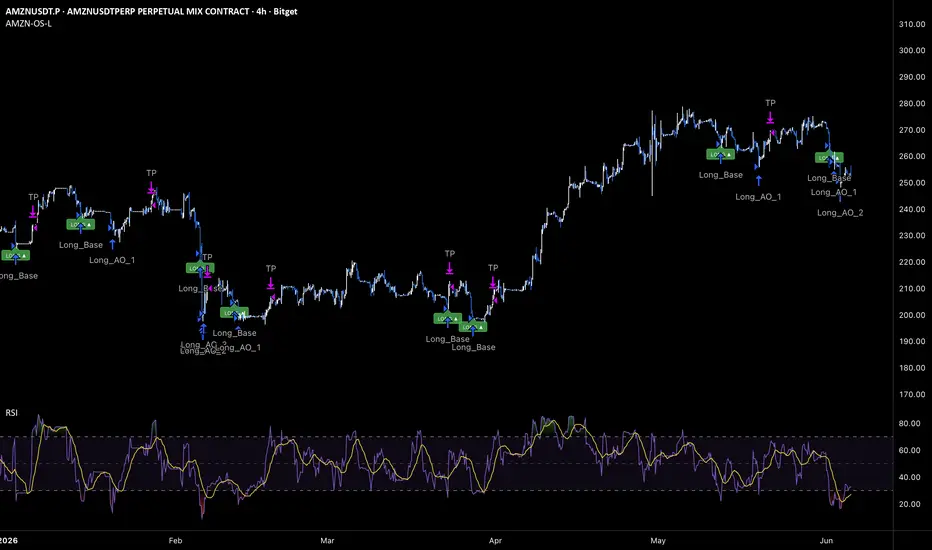
[3Commas] AMZN RSI Oversold Doubling DCA - Long IndicatorAMZN RSI Oversold Doubling DCA — Long Indicator
🔷 What it does:
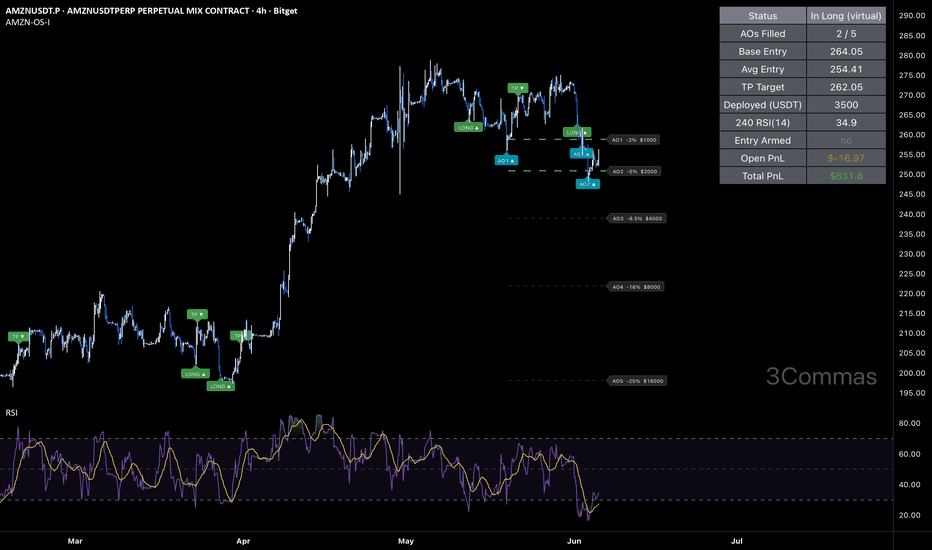
This is a signal-only indicator that mirrors an AMZN dip-buying workflow with an aggressive doubling-martingale safety ladder. It tracks one virtual long position at a time, opened only when AMZN prints a deep oversold reading on 4-hour RSI. Five safety orders fire at fixed deviations from base entry (−2%, −5%, −9.5%, −16%, −25%) with sizes doubling on every rung. Exit is a fixed 3% Take Profit from average entry. The indicator computes running average entry, deployed capital, open PnL, and lifetime realized PnL — all derived from honest fill-by-fill bookkeeping. Every event emits a webhook-ready JSON alert payload for direct DCA Bot consumption.
- Selective oversold entry: 4h RSI < 28.
- Non-uniform fixed-deviation safety ladder: −2%, −5%, −9.5%, −16%, −25% from base entry.
- Doubling safety-order sizes: 1k / 2k / 4k / 8k / 16k USDT from a $500 base.
- Tight 3% Take Profit from the averaged-down entry — quick deal close once price stabilizes.
- Honest virtual bookkeeping: Open PnL and lifetime Total PnL displayed live on the chart.
🔷 Who is it for:
- Swing traders running a DCA Bot on AMZN who want to buy deep oversold dips.
- Bot operators who want a chart-driven signal source that emits per-event JSON ready for a DCA Bot.
- Traders who can absorb a doubling martingale up to ~31.5% of equity deployed per trade in exchange for a high deal-close rate.
- Operators tracking staged position management — entry, up to five staged safety fills, and a single exit — directly on the chart without the strategy-tester overhead.
🔷 How does it work:
Entry Filter: A 4-hour RSI(14) is sampled via request.security with lookahead disabled (no repaint). The entry gate fires when RSI is below 28 (deep oversold) at host-bar close, filtering out shallow dips.
Base Entry: When the gate is satisfied, the indicator marks a virtual long entry, captures the base entry price, and seeds the cost-basis ledger with the configured base order size (default 500 USDT).
Safety Order Ladder (Fixed Deviations, Doubling Sizes): After base fill, the indicator monitors price deviation against the position. Each safety order has its own fixed deviation from base entry — not a cumulative ladder. AO1 fills at close ≤ base × 0.98 (−2%); AO2 at −5%; AO3 at −9.5%; AO4 at −16%; AO5 at −25%. USDT sizes double from a 1,000 first AO: 1,000 / 2,000 / 4,000 / 8,000 / 16,000. Each fill updates the running cost-basis and dispatches its own webhook payload.
Honest Virtual Bookkeeping: Total cost and qty are updated incrementally on every event, so the avg entry, deployed capital, Open PnL, and Total PnL displayed in the status table reflect the actual broker-equivalent position state — no shortcut from base entry, no synthetic averaging.
Lifetime Total PnL: When the position closes for profit, the realized PnL from that cycle accumulates into a lifetime counter. The status table displays both Open PnL (current cycle, resets on exit) and Total PnL (lifetime, persists across the chart history) — giving traders a real-time read on cumulative performance without a backtest engine.
Exit: A fixed 3% Take Profit above the running average entry. When close hits the TP target, the close webhook fires, realized PnL accumulates, and the virtual position resets.
🔷 Why it's unique:
- Selective Oversold Entry: The deal opens only on a deep 4h RSI < 28 print, so capital is committed at genuinely stretched conditions rather than on every dip.
- Non-Uniform Fixed-Deviation Ladder: Most published DCA tools use formula-based ladders (step × multiplier). This one exposes each AO deviation as a direct input, allowing an asymmetric ladder (2% / 5% / 9.5% / 16% / 25%) where deeper safety orders trigger only on serious adverse moves and the lowest rung sits a full 25% below base.
- Doubling Martingale: 1 / 2 / 4 / 8 / 16 / 32 size progression scales position capital exponentially if the position runs adverse, but is hard-bounded by the 5-rung ladder.
- Lifetime PnL Tracking: Open PnL and Total PnL are displayed live on the chart — Open resets per cycle, Total persists across the entire chart history. The indicator gives strategy-tester-equivalent insight without running a backtest.
- Per-Event Webhook Ledger: Up to seven discrete events per cycle (entry + 5 AO fills + TP), each with its own JSON alert payload. One TradingView alert with "Any alert() function call" drives a DCA Bot end-to-end.
🔷 Considerations Before Using the Indicator:
Sample Size: The companion strategy's backtest produced 22 closed trades — below the ≥100 floor typically used for statistical confidence. The 90.91% win rate and high profit factor reflect favorable conditions over the test window and the averaging mechanic, not a deterministic edge. Treat them as indicative of how the ladder behaves, not a forward-performance guarantee.
Aggressive Capital Deployment: If all five safety orders fill, total deployed capital reaches 31,500 USDT = ~31.5% of the default reference equity. The doubling martingale amplifies both upside on recovery and risk if the lower bound breaks. Match the indicator's per-AO allocation to your bot's configuration to keep the avg-entry display honest.
No Stop Loss: There is no exit signal on adverse moves below AO5 (−25% from base). If price keeps falling, the virtual position holds unhedged until either price recovers to the 3% TP target or the user intervenes. Risk is structurally capped on the bot side by the bounded position ladder; if a hard exchange-side stop is required, configure it on the bot directly.
Martingale Tail Risk: A doubling ladder that bottoms out at −25% is built for mean-reverting moves. A sustained directional collapse below −25% leaves the full virtual position open with no further averaging available — the single largest risk in any martingale DCA. Choose assets and regimes where deep-but-recoverable dips are the norm.
Cross Detection Granularity: Entries and AO fills are evaluated on bar close. A bar that spikes through a level and returns within the same bar may be missed by design — this matches realistic polling behavior and avoids over-signaling on intra-bar wicks.
Live vs Historical State: The virtual position state is rebuilt from chart history each time the indicator is recompiled. If the indicator is added mid-deployment or the live bot diverges from the signal stream (manual interventions, partial fills), the indicator state may not match the live bot. Toggle the indicator off and on to reset.
Backtesting Note: This is an indicator, not a strategy. There is no built-in P&L tester — but the live Total PnL counter in the status table gives a running approximation. For full metrics over a ~9.4-month sample (22 closed trades, 90.91% win rate, 0.20% max drawdown, profit factor 21.997, +0.81% net return), use the companion strategy version on identical parameters.
🔷 How to Use It:
🔸 Add the indicator to an AMZN / USDT chart on 4h.
🔸 Review the RSI entry level, the five AO deviations and sizes, and the Take Profit percentage. Defaults are calibrated for AMZN 4h — recalibrate when the asset's volatility regime shifts.
🔸 Set Base Order Size and AO sizes to match your bot's configuration (the indicator's avg-entry display becomes meaningful when virtual sizing matches real sizing).
🔸 In the DCA Bot Webhook group, paste the Bot ID, Email Token, and Pair (QUOTE_BASE format, e.g., USDT_AMZN).
🔸 Create an alert on the indicator with "Any alert() function call". Paste the DCA Bot's webhook URL into the alert's Webhook field. The indicator will emit JSON payloads for entry, each safety order, and TP exit — formatted for direct DCA Bot consumption.
🔷 INDICATOR SETTINGS
Base Order Size (USDT): Virtual order size for the avg-entry / open-PnL computation.
AO1–AO5 Deviation (%): Fixed distance from base entry where each safety order becomes eligible. Non-uniform by design, reaching −25% at AO5.
AO1–AO5 Size (USDT): Virtual USDT amount of each safety order. Doubles at each rung by default.
RSI Timeframe / Length / Less Than: 4h RSI filter for the base entry.
Take Profit (%): Fixed distance above the running average entry where the virtual long closes.
Active Window: Optional date filter — when ON, the indicator only fires signals between From and To dates.
DCA Bot Webhook: Bot ID, Email Token, and Pair fields injected into every alert payload.
Visualization: Toggle AO Ladder, Avg / TP plot lines, fill labels, signal triangles, status table.
Brand Watermark: Configurable text, position, size, and transparency.
👨🏻💻💭 We hope this tool helps enhance your trading. Your feedback is invaluable, so feel free to share any suggestions for improvements or new features you'd like to see implemented.
__
The information and publications within the 3Commas TradingView account are not meant to be and do not constitute financial, investment, trading, or other types of advice or recommendations supplied or endorsed by 3Commas and any of the parties acting on behalf of 3Commas, including its employees, contractors, ambassadors, etc. مؤشر
[3Commas] AMZN RSI Oversold Doubling DCA - Long StrategyAMZN RSI Oversold Doubling DCA — Long Strategy
🔷 What it does:
This is a long-only DCA strategy with a selective oversold entry and an aggressive martingale safety-order ladder. A long entry opens only when the 4-hour RSI falls below 28 (deep oversold). Five safety orders then fire at fixed deviations from base entry (−2%, −5%, −9.5%, −16%, −25%) with sizes doubling on every rung ($1,000 → $2,000 → $4,000 → $8,000 → $16,000). Exit is a fixed 3% Take Profit from average entry. No trailing, no Stop Loss.
- Single base order with up to five safety orders on a non-uniform fixed-deviation ladder reaching −25% below base.
- Aggressive size doubling: 1 / 2 / 4 / 8 / 16 / 32 unit progression from a $500 base.
- Tight 3% Take Profit from average entry — the averaging ladder pulls the average down so a small recovery closes the deal in profit.
- Single entry filter: deeply oversold 4h RSI — a clean, selective trigger.
- Every entry, safety order, and exit emits a webhook-ready JSON alert payload for direct DCA Bot consumption.
🔷 Who is it for:
- Swing traders looking for long exposure on AMZN when it prints deep oversold readings on the 4h.
- DCA-style traders who want a disciplined averaging ladder that only deepens on serious adverse moves.
- Bot operators who want to drive a DCA Bot via webhook with per-event JSON payloads tagged for each base / safety order / exit action.
- Traders comfortable with a doubling martingale ladder deploying up to ~31.5% of equity per trade in exchange for a high deal-close rate.
🔷 How does it work:
Entry Filter: A 4-hour RSI(14) is sampled via request.security with lookahead disabled (no repaint). The entry gate fires when RSI is below 28 (deep oversold) at host-bar close, filtering out shallow dips.
Base Order: Sized at 500 USDT default (0.5% of 100k capital). Configurable as Market (default) or Limit at the bar's close.
Safety Order Ladder (Fixed Deviations, Doubling Sizes): After the base fill, the strategy monitors price deviation against the base entry. Each safety order has its own fixed deviation from base — not a cumulative ladder. AO1 fires when close ≤ base × 0.98 (−2%); AO2 at −5%; AO3 at −9.5%; AO4 at −16%; AO5 at −25%. Sizes double from a 1,000 USDT first AO: 1,000 / 2,000 / 4,000 / 8,000 / 16,000.
Exit: A fixed 3% Take Profit above the running average entry. When close hits the TP target, the position closes at market. No trailing, no Stop Loss.
Why the Ladder Works: Each doubling safety order weights the average entry heavily toward the lowest fills. After several rungs fill, the average sits well below base, so a modest 3% bounce off the lows is enough to close the whole deal in profit — the core mechanic of a doubling DCA bot.
🔷 Why it's unique:
- Selective Oversold Entry: The deal opens only on a deep 4h RSI < 28 print, so capital is committed at genuinely stretched conditions rather than on every dip.
- Non-Uniform Fixed-Deviation Ladder: Most published DCAs use formula-based ladders (step × multiplier). This one exposes each AO deviation as a direct input, allowing an asymmetric ladder (2% / 5% / 9.5% / 16% / 25%) where deeper safety orders trigger only on serious adverse moves and the lowest rung sits a full 25% below base.
- Doubling Martingale: 1 / 2 / 4 / 8 / 16 / 32 size progression is more aggressive than typical 1.05–1.5× compounding. Capital deployed scales exponentially if the position runs adverse, but is hard-bounded by the 5-rung ladder.
- Tight Recovery Target: The 3% Take Profit on the averaged-down entry closes deals quickly once price stabilizes, keeping the win rate high and holding times short relative to the depth of the ladder.
- DCA Bot Integration: Every event (base, AO 1–5, exit) emits a fully-formed JSON alert payload. Connect one alert to a DCA Bot's webhook URL and the strategy drives the bot end-to-end without any glue layer.
🔷 Considerations Before Using the Strategy:
Sample Size: The backtest produced 22 closed trades — below the ≥100 floor typically used for statistical confidence. The 90.91% win rate and high profit factor reflect favorable conditions over the test window and the averaging mechanic, not a deterministic edge. Treat these numbers as indicative of how the ladder behaves, not as a forward-performance guarantee. Extend the test window or run the strategy across multiple assets to build a larger sample before committing capital.
Aggressive Capital Deployment: If all five safety orders fill, total deployed capital reaches $31,500 = ~31.5% of default 100k equity — above TradingView's typical 5–10% per-trade band. Size the base and AO inputs down to dial per-trade risk into a safer range. The doubling martingale amplifies both upside (when price recovers) and risk (if the lower bound breaks).
No Stop Loss: There is no exit on adverse moves below the −25% AO5. If price keeps falling below the lowest safety order, the position holds unhedged until either price recovers to the 3% TP target or the user intervenes. The structural risk cap is the bounded 5-rung position ladder; if a hard exchange-side stop is required, layer it on the bot directly.
Martingale Tail Risk: A doubling ladder that bottoms out at −25% is built for mean-reverting moves. A sustained directional collapse below −25% leaves the full position open with no further averaging available — the single largest risk in any martingale DCA. Choose assets and regimes where deep-but-recoverable dips are the norm.
Commission Calibration: The default 0.06% commission is calibrated for Bitget perpetual taker conditions. If running on a different venue, update the commission input accordingly.
🔷 STRATEGY PROPERTIES
Symbol: BITGET:AMZNUSDT.P (Perpetual) — portable to any AMZN / USDT pair.
Timeframe: 4H
Test Period: August 26, 2025 — June 5, 2026 (~9.4 months).
Initial Capital: 100,000 USDT.
Order Size per Trade: 0.5% of Capital base + 5 safety orders with size doubling.
Max Capital Deployed: $31,500 per trade (~31.5% of equity).
Commission: 0.06% per trade.
Slippage: 3 ticks.
Margin for Long Positions: 100%.
Indicator Settings: Default Configuration.
Base Order: 500 USDT, Market by default (Limit toggle available).
Take Profit: 3.0% above average entry (no trailing).
Stop Loss: None — bounded position size is the structural risk cap.
Entry Filter: 4h RSI(14) Less Than 28.
Safety Orders: 5 with fixed deviations −2% / −5% / −9.5% / −16% / −25% from base entry; sizes 1k / 2k / 4k / 8k / 16k USDT.
Strategy: Long Only.
🔷 STRATEGY RESULTS
⚠️ Remember, past results do not guarantee future performance.
Net Profit: +807.71 USDT (+0.81%)
Max Equity Drawdown: 199.15 USDT (0.20%)
Total Closed Trades: 22
Percent Profitable: 90.91% (20 / 22)
Profit Factor: 21.997
🔷 How to Use It:
🔸 Adjust Settings: Open the strategy inputs and review the Base Order Size, the five AO deviations and sizes, the RSI entry level, and the Take Profit percentage. Defaults are calibrated for AMZN 4h — recalibrate when the asset's volatility regime shifts.
🔸 Results Review: The backtest produced 22 closed trades — a modest sample. Treat the metrics as indicative of the ladder's behavior, not a forward-performance guarantee. Confirm that the trade frequency and the doubling ladder's max deployment fit your risk tolerance before deploying capital.
🔸 Create alerts to trigger the DCA Bot: Add one alert on the strategy using "Any alert() function call". Paste the DCA Bot's webhook URL into the alert's Webhook field, and fill the Bot ID, Email Token, and Pair inputs on the script. The strategy will emit JSON payloads for entry, each safety order, and exit — formatted for direct DCA Bot consumption.
🔷 INDICATOR SETTINGS
Base Order Size (USDT): USDT amount opened on the long entry.
Use LIMIT for Base: Toggle between Market (default) and Limit at bar close.
AO1–AO5 Deviation (%): Fixed distance from base entry where each safety order becomes eligible. Non-uniform by design, reaching −25% at AO5.
AO1–AO5 Size (USDT): USDT amount of each safety order. Doubles at each rung by default.
RSI Timeframe / Length / Less Than: 4h RSI filter for the base entry.
Take Profit (%): Fixed distance above average entry where the long closes for profit.
DCA Bot Webhook: Bot ID, Email Token, and Pair fields injected into every alert payload.
Visualization: Toggle AO Ladder, Avg / TP plot lines, fill labels, status table.
Brand Watermark: Configurable text, position, size, and transparency.
👨🏻💻💭 We hope this tool helps enhance your trading. Your feedback is invaluable, so feel free to share any suggestions for improvements or new features you'd like to see implemented.
__
The information and publications within the 3Commas TradingView account are not meant to be and do not constitute financial, investment, trading, or other types of advice or recommendations supplied or endorsed by 3Commas and any of the parties acting on behalf of 3Commas, including its employees, contractors, ambassadors, etc. استراتيجية

Session Lines & Kill ZonesOptimized for Inner Circle Trader (ICT) and Smart Money Concepts (SMC) traders, this indicator automatically highlights critical intraday market sessions and algorithmic "Kill Zones" directly on your chart.
Unlike standard session clocks that clutter your screens, this script features custom-engineered vertical transition lines and pixel-perfect background shading designed **never** to warp or break your chart's price scale.
---
🔑 Key Features
🌐 True GMT-Based Calculations: Zero reliance on your local broker time. Input your desired GMT offset to seamlessly align your sessions regardless of your data feed.
🕒 Comprehensive Kill Zone Coverage: Includes pre-configured, industry-standard tracking for:
Asian Session / Kill Zone
London Open Kill Zone
New York Open Kill Zone
London / New York Overlap (Silver Bullet/Macro windows)
⚙️ Fully Customizable Extra Session: An independent, fully editable custom session block tailored for tracking specific local market opens, equity hours, or personal macro periods.
📅 Daily Start Line Indicator: Clean, unobtrusive vertical separators marking the exact start of each new trading day.
📐 Clean Scaling Technology: Custom written using localized bar anchors. Your price scale remains 100% accurate, allowing you to compress, expand, and read price action smoothly without squeezed candles.
---
🎨 Visual & Control Settings
* **Timeframe Filtering:** Keep your higher timeframes clean! Set an automatic upper boundary rule (e.g., only show on 1-hour timeframes or lower) to auto-hide the sessions when zooming out to daily or weekly macro views.
* **Toggleable Labels & Borders:** Fully customize your aesthetic. Individually toggle background shading, outer boundary line styles (Solid, Dashed, Dotted), and session floating labels to match your chart's theme.
---
🚀 How to Use It
1. Judicious Multi-accounting: Use the background clouds to identify when liquidity is building up (Asian Range) and when algorithmic manipulation typically occurs (London/NY Sweeps).
2. Time-of-Day Execution: Ensure your setups align with high-volatility session boundaries marked clearly by the vertical transition lines.
Built entirely on the latest Pine Script v6 architecture for peak execution speed and cross-device display stability. مؤشر

مؤشر