Apex Dashboard Title: Apex Institutional Dashboard
The Problem with SMC Indicators
Most Smart Money Concepts (SMC) and institutional trading scripts suffer from the exact same fatal flaw: Chart Clutter. By the time your indicator finishes drawing Fair Value Gaps, Order Blocks, Liquidity Lines, session backgrounds, and text labels, your candlesticks are completely buried. You lose the ability to actually read pure price action.
The Solution: The Apex Dashboard
The Apex Institutional Dashboard is a "Stealth Engine." It calculates thousands of data points, tracks institutional liquidity sweeps, monitors volume delta, and analyzes multi-timeframe trends—all entirely in the background.
Instead of painting 100 different boxes on your screen, it distills all of that institutional math into two ultra-clean, compact HUD (Heads-Up Display) tables anchored to the corners of your chart. You get elite-level confluence data, and your candlesticks remain 100% naked and readable.
📊 Feature 1: The MTF Bias Dashboard
Anchored by default to the Top Right, this panel gives you an instant macro-to-micro view of the market.
MTF Alignment: Calculates the real-time EMA-based trend bias across the Daily, 4H, 1H, 15m, and 5m timeframes.
Regime Detection: Uses a customized Choppiness Index (CHOP) to definitively tell you if the market is trending (✦ TRENDING) or trapped in a sideways range (⚡ CHOPPY).
CVD Flow (Cumulative Volume Delta): Measures the delta between buying and selling volume to warn you of hidden institutional inflow or outflow before the price breaks.
A-M-D Session Tracking: Tracks the Asia, London, and New York sessions, automatically identifying the current phase of the ICT Accumulation, Manipulation, and Distribution (AMD) cycle.
🎯 Feature 2: The Action Status Panel
Anchored by default to the Bottom Left, this is the brain of the operation. The Apex Engine constantly scans for high-probability setups and feeds you live status updates based on deep confluence.
💎 STRONG BUY / SELL: Fires only when the market sweeps Tier-1 Liquidity (PDH/PDL or Major Swings), aligns with Linear Regression momentum, clears Chandelier Volatility Exits, and shows confirming CVD volume.
📈 SWING LONG / SHORT: A dedicated macro engine that hunts for major higher-timeframe reversals, keeping you in massive trends.
🟢 REGULAR / WEAK SIGNALS: Identifies minor structural breaks and continuation setups during runaway parabolic trends.
⏸️ CHOP WAIT: The ultimate account saver. If the engine detects a liquidity sweep but the Choppiness Index confirms the market is in a dead range, it explicitly warns you to wait, filtering out fake breakouts.
⚙️ Under The Hood (The Invisible Engine)
Even though you can't see the drawings, this script is running heavy institutional logic:
Adaptive Sweep Memory: The script remembers recent liquidity sweeps (PDH, PDL, Major/Minor BSL and SSL) and holds them in an elastic memory buffer to catch delayed "V-shaped" reversals.
Parabolic Runaway Support: In a raging trend, the script adapts. It lowers its sweep requirements, allowing you to catch aggressive 1-to-2 candle pullbacks into unmitigated zones without waiting for a deep structural flush.
Displacement Override: Detects massive ATR volume anomalies. If institutions violently inject capital, the script overrides lagging indicators to get you in instantly.
Ghost Anchor Technology: Custom built to bypass TradingView's UI rendering bugs. The tables will never detach from your candles, and the script prevents auto-generating annoying secondary price scales.
Best Used For: Built specifically for XAU/USD (Gold) on the 5-minute timeframe, but robust enough to trade Forex, Indices, and Crypto across any timeframe.
Trade the data, not the noise. مؤشر

مؤشر
استراتيجية

مؤشر
HexatapHexatap — 6-Point Reversal Pattern Detector
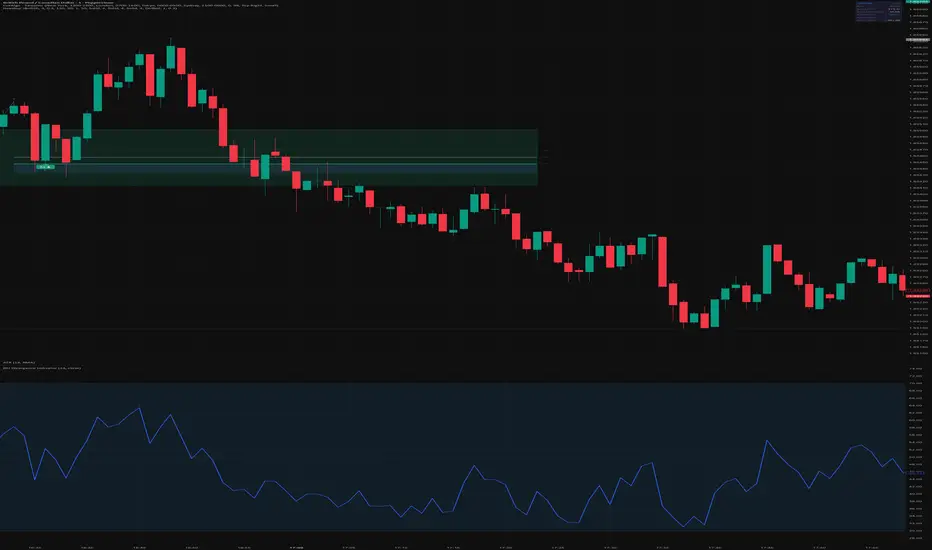
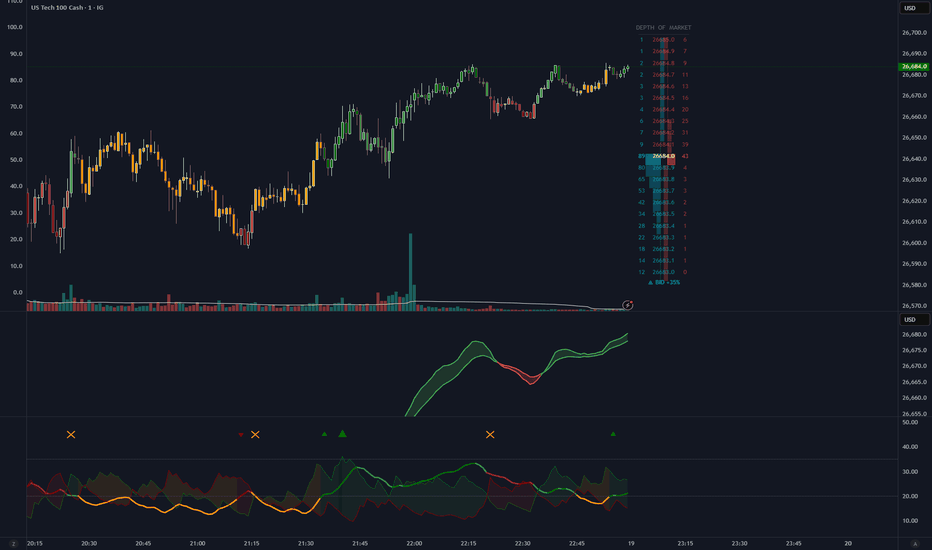
Hexatap automatically detects a specific 6-point price structure that forms during strong trending moves, identifying high-probability reversal entry zones where price is likely to retrace before continuing in the dominant direction.
How it works
The indicator scans for a sequence of swing points that confirm trending market structure — three ascending highs in a bullish market or three descending lows in a bearish market. Between these structural points, it identifies key intermediary extremes and validates whether a liquidity sweep has occurred into a critical supply/demand zone. When the full 6-point structure completes, the indicator draws the zone and highlights the golden ratio entry area where price is statistically likely to reverse and continue the trend.
The 6-point structure
Point 1–2 form the initial range and define the supply/demand zone. Point 3 confirms the trend direction by breaking structure. Point 4 sweeps back into the zone, tapping liquidity. Point 5 breaks structure again, confirming momentum. Point 6 is the entry signal — price retraces into the zone one final time, reaching the 0.382–0.618 fibonacci sweet spot before reversing.
Features
Auto-detection of bullish and bearish 6-point reversal structures
Manual directional bias selector (Bullish / Bearish / Both)
Configurable swing detection with ATR-based noise filtering
Supply/demand zone drawing with adjustable extension
Golden ratio levels (0.382, 0.500, 0.618, 0.786) — each individually toggleable with custom colors, styles, and line widths
Golden pocket fill (0.618–0.786) with adjustable color
A+ / A- setup quality grading based on zone sweep depth
Smart entry detection using wick penetration into the fibonacci sweet spot
Four configurable alerts: structure complete, price approaching zone, entry signal, and low quality sweep warning
Recommended timeframes
Works on any timeframe. Lower swing lookback values (2–3) work well for lower timeframes. Higher values (4–6) suit higher timeframes. The ATR filter helps eliminate noise without missing valid patterns.
How to use
Set your directional bias based on your higher timeframe analysis
Wait for the indicator to detect a valid 6-point structure (TAP 1–5)
Watch for price to retrace back to the zone after the structure completes
The A+ entry signal fires when price reaches the 0.382–0.618 area — your entry zone
Place your stop below the zone (bullish) or above the zone (bearish)
Target the previous structure high/low for a minimum 1:1 risk-reward
Settings guide
Swing Lookback: Controls how many bars are needed to confirm a swing point. Lower = more sensitive, higher = fewer but stronger swings
Min Swing Size (ATR): Filters out insignificant swings. Set to 0 to disable
Zone Sweep Threshold: How deep the sweep into the zone can be before the setup is downgraded from A+ to A-
Zone Extend: How many bars the zone box extends to the right after detection مؤشر
SMC Toolkit - CHoCH, BoS, FVG, P/D [AvantCoin]SMC Toolkit - CHoCH, BoS, FVG, P/D
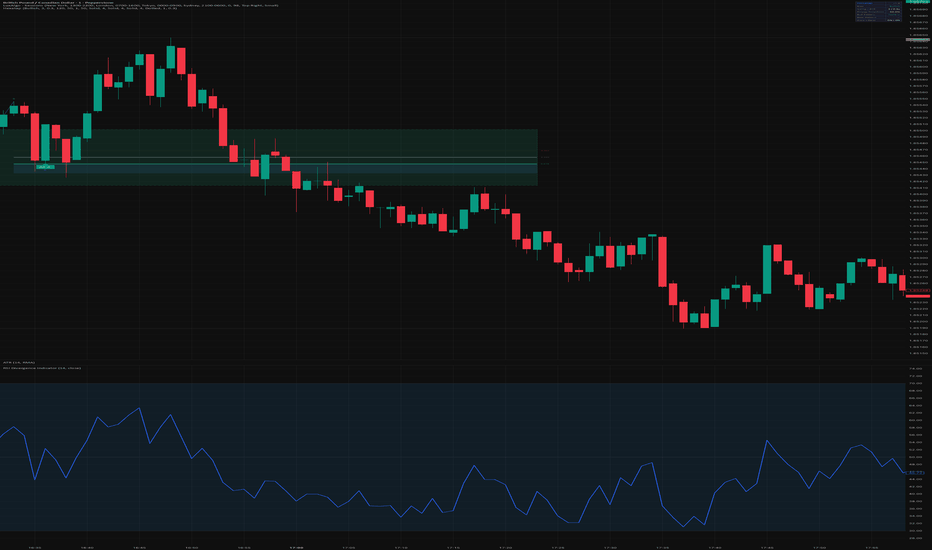
A focused market structure indicator covering the four foundational SMC concepts in a single, configurable tool.
What it shows
CHoCH (Change of Character): marks the first break that reverses the prevailing trend.
BoS (Break of Structure): marks continuation breaks in the direction of the current trend.
FVG (Fair Value Gaps): highlights 3-candle imbalance zones, with automatic tracking of mitigation, time expiry, and structural invalidation.
Premium / Discount: plots the equilibrium of the current swing range, with optional zone shading to identify where price sits relative to the range.
**Settings**
Independent visibility toggles for CHoCH, BoS, FVG, and Premium/Discount, show only what you need.
Swing lookback and break confirmation mode (close or wick) for structure detection.
FVG mitigation mode (first touch or full fill), max extension in bars, and option to hide inactive gaps.
Fully customizable colors, line styles, and opacity for every element.
Built-in alerts for bullish and bearish CHoCH and BoS events.
Design principles
Every rule the indicator uses is documented in the script header. Pivots do not repaint, swings are consumed once broken, and signals are drawn on the bar of confirmation, what you see live is what you see in backtest.
Designed for clarity on any timeframe and any market.
مؤشر
مؤشر

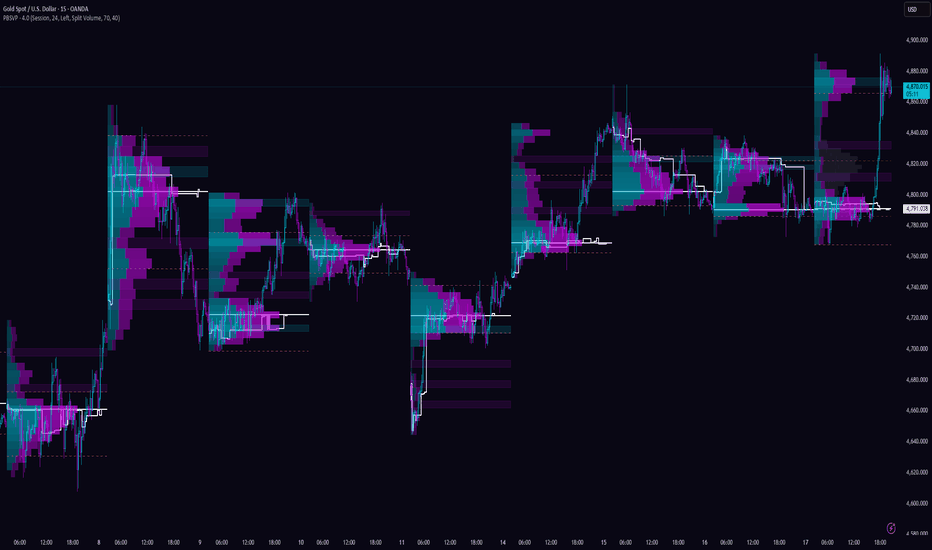
Path-Based Session Volume Profile [CLEVER]📌 Overview
Path-Based Session Volume Profile is a session-focused analytical tool designed to visualize how trading volume is distributed across price levels within a defined market session. Unlike simplified allocation models that assign an entire candle’s volume to a single closing price or midpoint, this script incorporates the intrabar price path (Open–High–Low–Close behavior) to distribute volume across multiple price segments inside each bar.
The objective of this approach is not to generate predictions or trading signals, but to present a structured representation of session-based market participation. By accounting for the price traversal that occurs within each bar, the indicator aims to provide a more granular view of how volume may be interacting with different price zones during the session.
From the beginning of the selected session, the script incrementally accumulates volume data and distributes it across predefined price rows. With each confirmed bar close, the internal distribution matrix updates to reflect developing session structure. This allows users to observe how volume concentration evolves over time, rather than only seeing a finalized static profile at session end.
Through this structure, users can visually assess:
Areas of relatively higher volume concentration
Areas of relatively lower participation
The Developing and Final Point of Control (POC)
Value Area High (VAH) and Value Area Low (VAL)
Shifts in participation as the session progresses
The calculation model does not rely on future data and does not make performance claims. All outputs are derived from available historical and real-time bar data and update in accordance with bar confirmations. The script is designed as a structural visualization tool rather than an automated decision-making system.
The path-based distribution logic is intended to reduce oversimplification in volume allocation by considering the internal price movement of each candle. This allows traders to integrate session-level volume context into their existing analytical frameworks, such as market structure analysis, liquidity studies, range evaluation, or breakout observation.
This tool may be relevant for intraday traders, futures and forex participants, and any user interested in session-specific volume dynamics. Its design emphasizes clarity, modularity, and customization flexibility so that users can adapt the visualization to their preferred workflow.
In summary, Path-Based Session Volume Profile provides a structured, session-oriented visualization of price–volume interaction using a path-aware distribution method, enabling objective analysis of market participation within defined trading sessions.
📐 Core Concept
The core concept of Path-Based Session Volume Profile is to represent session-level volume distribution using a path-aware allocation model instead of a simplified single-price assignment approach.
Traditional volume profile methods often allocate an entire candle’s volume to one reference price (such as the close, typical price, or midpoint). While computationally efficient, that method may not fully reflect the internal price traversal that occurred during the bar. This script introduces a structured distribution model that considers the Open–High–Low–Close (OHLC) path to distribute volume across multiple price levels inside each candle’s range.
1️⃣ Session-Based Data Accumulation
At the start of a defined trading session, the script initializes a price grid composed of fixed-height rows. These rows act as containers for accumulating volume data.
As each confirmed bar closes within the session:
The candle’s high–low range is mapped against the predefined price rows.
Only the rows intersecting the candle’s price range participate in volume allocation.
The session matrix is updated incrementally rather than recalculated from scratch.
This process continues until the session ends, at which point the final distribution represents the cumulative session profile.
2️⃣ Path-Aware Volume Distribution Logic
Instead of assigning total volume to a single price point, the script distributes volume proportionally across the price levels traversed by the candle.
The internal logic follows these structural ideas:
The candle’s total range (High − Low) is divided into segments aligned with profile rows.
Volume is proportionally distributed based on how much of the candle overlaps each price row.
This results in a multi-level allocation rather than a single-node assignment.
By doing so, the indicator attempts to reduce concentration bias that can occur when all volume is attributed to a single reference price.
This is not a tick-level reconstruction and does not simulate actual transaction flow. Instead, it is a structured approximation based strictly on available OHLC data.
3️⃣ Development of Structural Reference Points
As volume accumulates across price rows during the session, structural reference levels are derived:
Point of Control (POC): The row containing the highest accumulated volume.
Value Area: A percentage-based range around the POC representing a specified share of total session volume.
High and Low Volume Zones: Areas where participation is relatively concentrated or comparatively light.
These levels update dynamically during the session and stabilize once the session completes.
4️⃣ Incremental Update Model
The script operates using an incremental accumulation model:
At each confirmed bar close, new volume is added to the session matrix.
Historical rows remain intact and are not retroactively modified beyond logical recalculation.
The profile visually evolves throughout the session, allowing users to observe structural development.
This approach ensures consistency between historical and real-time behavior.
5️⃣ Design Philosophy
The design philosophy behind this indicator emphasizes:
Structural clarity over signal generation
Objective visualization over predictive modeling
Session-specific context rather than full-chart aggregation
It does not attempt to forecast market direction, guarantee outcomes, or replicate order book data. Instead, it provides a systematic framework for observing how volume is distributed across price within a defined session window.
Conceptual Summary
In essence, the core concept is built on three foundations:
Session isolation – Volume is segmented strictly within defined session boundaries.
Path-based allocation – Volume is distributed across price levels using OHLC range overlap.
Structural extraction – Key reference levels (POC, value range, participation clusters) are derived from accumulated session data.
This structure allows users to analyze price–volume interaction within a session using a method that extends beyond single-price volume assignment, while remaining grounded in available bar data.
⚙️ How to Use
The Path-Based Session Volume Profile is designed as a structural analysis tool. It is not intended to generate automated trade signals or directional forecasts. Instead, it provides session-based volume context that users may incorporate into their own analytical framework.
Below is a structured guide on how the tool can be applied effectively.
1️⃣ Select the Appropriate Session
Begin by defining the trading session you want to analyze (for example: regular market hours, London session, New York session, or a custom intraday window).
Each session is treated independently. The profile:
Resets at the beginning of the selected session
Accumulates volume only within that session
Stops updating once the session closes
Using clearly defined sessions allows you to evaluate participation dynamics specific to that market period.
2️⃣ Observe the Developing Profile During the Session
As the session progresses, the profile builds incrementally.
Users can monitor:
Where volume is gradually concentrating
Whether the Point of Control (POC) is shifting upward or downward
How the Value Area expands or contracts
The developing profile can provide structural context about how participation is evolving, rather than waiting for the session to complete.
It is important to interpret this as structural information, not as a standalone trading signal.
3️⃣ Analyze High and Low Volume Zones
The profile highlights relative volume concentration across price levels.
Users may study:
High Volume Nodes (HVNs) as areas where price previously experienced sustained interaction
Low Volume Zones (LVNs) as areas of comparatively lighter participation
These areas can be used to evaluate how price behaves when revisiting prior session structure. However, outcomes are not guaranteed, and interpretation should remain contextual.
4️⃣ Use the Point of Control (POC) as a Structural Reference
The POC represents the price row with the highest accumulated volume during the session.
Traders may observe:
Whether price remains near the POC (indicating balance-like behavior)
Whether price moves away from the POC and fails to return
Whether the POC shifts significantly during the session
The POC is best used as a reference level within broader market structure analysis rather than as an isolated decision trigger.
5️⃣ Evaluate the Value Area (VAH & VAL)
The Value Area defines a percentage-based region around the POC that contains the majority of session volume.
Users may examine:
Whether price trades inside or outside the Value Area
How price reacts when re-entering the Value Area
Whether the session appears rotational (within value) or directional (outside value)
Again, this should be interpreted as contextual structure rather than predictive confirmation.
6️⃣ Integrate With Your Existing Strategy
This indicator is designed to complement—not replace—other analytical methods.
It can be combined with:
Market structure analysis
Liquidity zone identification
Breakout or range-based strategies
Multi-timeframe bias evaluation
The volume profile provides structural context that may enhance decision-making, but it should not be treated as a complete trading system on its own.
7️⃣ Adjust Settings to Fit Your Workflow
Users may customize:
Number of price rows (profile resolution)
Value Area percentage
Visual styling preferences
Session timing inputs
Higher row counts may provide more granular distribution, while lower counts may improve clarity and performance on lower-powered devices.
Adjust these settings according to your chart timeframe and personal workflow preferences.
Practical Usage Considerations
The profile reflects approximated distribution based on OHLC data, not tick-level transaction data.
Real-time structure may evolve until the session completes.
Historical sessions remain fixed once completed.
The tool does not provide entry/exit instructions or financial advice.
Summary
To use the Path-Based Session Volume Profile effectively:
Define your session clearly.
Monitor developing structure during the session.
Observe POC, Value Area, and volume concentration shifts.
Integrate these observations into a broader analytical framework.
The indicator’s primary purpose is to provide structured visibility into session-level price–volume interaction, allowing users to analyze participation dynamics within defined market windows.
⚙️ How It Works
The Path-Based Session Volume Profile operates using a structured, session-isolated accumulation engine that distributes volume across price levels using OHLC-based range overlap logic. The internal workflow can be understood in five core stages:
1️⃣ Session Initialization
When a new user-defined session begins:
The script identifies the session start timestamp.
All previous session data is finalized.
A fresh internal volume matrix is initialized.
A fixed price grid (rows) is created to segment the session’s price range.
Each row represents a defined price interval. These rows act as containers that will accumulate volume as the session progresses.
The profile is therefore isolated strictly within session boundaries and does not mix volume across sessions.
2️⃣ Dynamic Price Range Tracking
During the session:
The script continuously tracks the evolving session high and session low.
If a new extreme is formed, the internal price boundaries adjust.
The row grid recalibrates logically to maintain structural consistency.
This ensures that the profile remains aligned with the true price range of the active session rather than a static predefined range.
3️⃣ Path-Based Volume Allocation Per Bar
When a bar closes inside the session:
The candle’s high–low range is identified.
The script determines which price rows intersect with that range.
Instead of assigning total volume to a single price point, the script distributes volume proportionally across all overlapping rows.
The proportional allocation is based on:
The size of overlap between the candle’s range and each price row.
The total range of the candle.
This produces a segmented volume distribution across price levels rather than a single concentration node.
Important clarification:
This method is an OHLC-based approximation.
It does not reconstruct tick-by-tick execution data or actual order flow.
It distributes volume logically based on available bar data only.
4️⃣ Incremental Accumulation Model
After distribution:
The allocated volume is added to each corresponding row’s cumulative total.
Previously accumulated rows remain unchanged except for new additions.
The matrix grows progressively throughout the session.
This incremental structure ensures:
Stability between historical and real-time behavior
No reliance on forward-looking data
Logical consistency across bars
The developing profile updates only as new confirmed bars close.
5️⃣ Structural Level Derivation
Once the volume matrix updates, structural reference levels are computed:
▪ Point of Control (POC)
The row containing the highest accumulated volume becomes the session’s POC.
This level may shift during the session as distribution evolves.
▪ Value Area (VAH & VAL)
The script calculates a user-defined percentage (commonly 70%) of total session volume.
It then:
Expands outward from the POC
Includes adjacent rows
Stops once the target percentage threshold is reached
The upper boundary becomes the Value Area High (VAH).
The lower boundary becomes the Value Area Low (VAL).
▪ High and Low Participation Zones
By comparing relative row totals, the script visually distinguishes:
Higher concentration clusters
Comparatively lighter participation zones
These are descriptive structural outputs, not predictive signals.
6️⃣ Session Completion
When the session ends:
Accumulation stops.
Structural levels stabilize.
The profile becomes fixed for that session.
A new session triggers a complete reset and the process repeats independently.
Technical Design Characteristics
The internal architecture emphasizes:
Session isolation
Path-aware proportional allocation
Incremental accumulation
Deterministic level calculation
The script does not:
Use future bars
Modify past completed sessions
Provide trade automation
Guarantee market behavior
It is a visualization framework built on available OHLC and volume data.
Conceptual Summary
In simplified terms, the workflow is:
Create session grid
Track evolving session range
Distribute each bar’s volume across overlapped price rows
Accumulate totals incrementally
Derive structural reference levels
Finalize profile at session end
The result is a session-based structural representation of how volume is distributed across price using a path-aware allocation method grounded in confirmed bar data.
🎯 Key Features
📊 Session-Based Volume Isolation
The Path-Based Session Volume Profile is built to provide a structured view of volume distribution within a defined trading session by combining session isolation with a path-aware allocation model. Instead of assigning volume to a single price reference such as the close or typical price, the script distributes each bar’s volume across multiple price levels based on how the candle’s high–low range interacts with a predefined price grid. This allows the indicator to present a more granular representation of where participation may have occurred during the session, strictly using available OHLC and volume data.
🔄 Independent Session Processing
A core feature of the script is its session-based isolation system. Each session is treated independently, meaning volume data is accumulated only within the selected time window and does not carry over into other sessions. At the start of a new session, all internal calculations reset, ensuring that each profile reflects only that specific market period. This structure allows users to analyze volume behavior in a clean, segmented format that is aligned with intraday or session-based trading workflows.
📈 Developing Profile Structure
The indicator also features a developing profile mechanism, where volume distribution is updated incrementally as each bar closes. This allows the profile to evolve in real time, showing how volume concentration shifts during the session rather than only presenting a finalized end-of-session structure. As new bars are confirmed, the internal matrix is updated and structural levels are recalculated accordingly, providing continuous feedback on session development.
🎯 Point of Control (POC) Behavior
Another important component is the Point of Control (POC), which is derived from the price level containing the highest accumulated volume within the session. This level is not static during the session and may shift as new volume is added, reflecting changes in participation distribution. Once the session concludes, the final POC stabilizes and represents the completed session’s highest activity zone.
📐 Value Area Calculation (VAH & VAL)
The script also calculates a configurable Value Area based on a user-defined percentage of total session volume. Starting from the POC, the Value Area expands outward until the specified volume threshold is reached, forming upper and lower boundaries known as the Value Area High (VAH) and Value Area Low (VAL). These levels represent the portion of the session where a majority of activity is concentrated, based purely on accumulated volume distribution.
🧭 Volume Concentration Zones
In addition to these core levels, the profile visually distinguishes areas of relatively higher and lower participation across price. These zones are derived from comparative volume density across rows and help represent structural variation within the session. Higher concentration areas and lower participation zones are displayed as part of the overall profile structure, without implying directional bias or predictive significance.
⚙️ Customization and Flexibility
The script is also designed with flexibility in mind, allowing users to adjust the number of price rows, visual style, and session parameters according to their trading environment. This makes it adaptable across different instruments and timeframes, from lower timeframe intraday charts to higher timeframe session analysis.
🧠 Design Philosophy
Overall, the key features focus on presenting a session-based, structurally consistent view of volume distribution using a deterministic, OHLC-based allocation model. The indicator emphasizes transparency, modularity, and analytical context rather than prediction or automated decision-making, making it suitable for users who study market structure and volume behavior within defined trading sessions.
⚙️ Settings & Customization
The Path-Based Session Volume Profile provides a highly configurable settings structure that allows users to adapt the indicator’s behavior, visual output, and session logic according to different trading styles, instruments, and timeframe requirements. The customization system is designed to modify how the profile is displayed and how data is interpreted visually, without changing the core calculation logic of the volume distribution engine.
📊 Profile Mode Configuration
The indicator offers two primary operational modes: Session Mode and Fixed Range Mode. In Session Mode, the profile automatically resets at the beginning of each defined trading session and builds continuously until the session ends. This mode is typically used for intraday analysis where each session represents a distinct market period. In Fixed Range Mode, users can manually define a start and end timestamp, allowing the profile to be constructed over a custom-selected range rather than an automatically detected session. This provides flexibility for analyzing specific price movements or historical events within a defined time window.
🕒 Session Timing Controls
In Fixed Range Mode, users can define both the start and end time of the analysis window. These inputs determine the exact portion of price data included in the profile calculation. If only a start time is defined, the profile continues until manually stopped or until the chart data ends. This allows partial or open-ended analysis depending on user preference. These controls are particularly useful for isolating specific market events, volatility expansions, or reaction periods around key levels.
📐 Number of Rows (Profile Resolution)
The Number of Rows setting defines the vertical resolution of the volume profile. Each row represents a fixed price interval within the session’s high–low range. Increasing the number of rows results in a more detailed and granular distribution of volume across price levels, while reducing the number of rows produces a smoother and more simplified structure. This setting directly affects how detailed the volume concentration visualization appears and should be adjusted based on chart timeframe and analysis depth.
📍 Profile Placement Control
The Placement setting allows users to choose whether the profile is drawn on the left or right side of the chart. This does not affect the underlying calculations but changes the visual alignment of the profile relative to price action. Right-side placement is commonly used for real-time analysis, while left-side placement may be preferred for comparative or historical visual structuring.
🎨 Visual Style Modes
The indicator provides two main visualization styles: Split Volume and Delta Heatmap. In Split Volume mode, buy and sell volume are visually separated within each price row, allowing users to observe relative participation balance. In Delta Heatmap mode, the script emphasizes the difference between buying and selling pressure within each row, using intensity-based shading to represent dominance. These modes offer different perspectives on the same underlying volume data without altering the core distribution logic.
🌈 Color Customization System
Users can fully customize the visual appearance of the profile through a flexible color input system. Separate colors are assigned to buy volume, sell volume, Point of Control (POC), Value Area boundaries, High Volume Nodes (HVN), and Low Volume Nodes (LVN). This allows traders to visually distinguish different structural elements of the profile according to their preference or visual clarity needs. Adjusting colors does not impact calculations and is purely for readability and chart integration.
🌫️ Transparency & Heatmap Sensitivity
The Base Transparency (bgAlpha) setting controls the overall opacity of volume nodes, allowing users to emphasize or soften the visual intensity of the profile. Lower values create more solid visual blocks, while higher values produce a lighter appearance. The optional Heatmap Mode dynamically adjusts transparency based on relative volume density, meaning high-activity zones appear more prominent while low-activity areas become more transparent. This enhances structural contrast without altering underlying data.
📊 Value Area Percentage Control
The Value Area setting defines what portion of total session volume is used to construct the Value Area High (VAH) and Value Area Low (VAL). The default value is typically set around 70%, but users can adjust it between 50% and 90%. A higher percentage expands the value area to include more of the session’s volume distribution, while a lower percentage creates a more concentrated and narrow value zone around the Point of Control.
📌 Structural Display Toggles
Users can enable or disable multiple structural elements such as the developing POC, final POC line, Value Area boundaries, and HVN/LVN zones. These toggles allow traders to simplify or enrich the visual output depending on their analysis requirements. For example, some users may prefer only POC and Value Area visibility, while others may activate full structural visualization for deeper market context.
🧠 Customization Philosophy
The customization system is designed to support flexibility without altering the core logic of the indicator. All settings influence visual representation or session boundaries, while the underlying OHLC-based path distribution model remains consistent. This ensures that analytical integrity is preserved while allowing users to tailor the indicator to different markets, timeframes, and personal trading workflows.
🧠 Design Rationale & Component Interaction (How Everything Works Together)
The Path-Based Session Volume Profile combines multiple analytical components into a single structured framework to represent session-based volume distribution in a more detailed and layered form. Each feature is not designed in isolation; instead, all modules operate on the same underlying dataset (OHLC + Volume) and contribute to a unified session profile representation.
The reason these elements are combined is to move from a simple volume-at-price representation toward a structured session model that reflects different dimensions of participation: distribution, concentration, balance, and relative strength across price levels.
📊 1️⃣ Core Engine: Path-Based Volume Distribution
At the foundation of the script is the path-based allocation engine, which distributes each candle’s volume across multiple price rows based on OHLC range interaction. This is the primary data transformation layer.
All other features depend on this stage because it creates the base structure of:
Volume per price level
Session-wide accumulation matrix
Relative participation across rows
Without this layer, the indicator would reduce to a simple single-price volume aggregation, which would lose internal structure.
🧩 2️⃣ Session-Based Segmentation Layer
Session logic acts as a boundary system that isolates data into distinct time windows. This ensures that:
Each session is processed independently
Volume does not mix across different market periods
Structural calculations remain context-specific
This layer is essential because volume profile interpretation is highly dependent on time segmentation. Without session separation, structural levels like POC and Value Area would lose contextual meaning.
🎯 3️⃣ Point of Control (POC) Calculation Layer
The POC is derived from the same volume matrix created by the distribution engine. It identifies the price row with the highest accumulated participation.
It works as:
A reference equilibrium level of the session
A dynamic output during session formation
A stabilized structural level after session completion
The POC does not operate independently; it is a direct result of the aggregated distribution process.
📐 4️⃣ Value Area Construction Layer (VAH / VAL)
The Value Area is built on top of the same cumulative volume data used for POC calculation. It expands outward from the POC until a defined percentage of total volume is included.
This means:
It depends entirely on the existing distribution matrix
It uses cumulative row volumes as input
It defines a bounded region of high participation
This layer provides a secondary structural boundary around the POC, representing concentration range rather than a single level.
🧭 5️⃣ Volume Concentration Classification (HVN / LVN Logic)
High Volume Nodes (HVN) and Low Volume Nodes (LVN) are derived by comparing adjacent row volumes within the same distribution structure.
They function as:
Relative peaks and troughs within the session profile
Structural variation indicators across price levels
Contextual zones of interest, not standalone signals
These elements do not introduce new data; they analyze the same dataset from a comparative perspective.
📈 6️⃣ Developing Profile Layer
The developing profile system continuously updates the same underlying matrix as new bars close. This ensures:
Real-time structural evolution
Progressive refinement of POC and Value Area
Live reflection of market participation changes
This layer is not separate from the core engine; it is a temporal update mechanism applied to the same dataset.
🎨 7️⃣ Visualization Layer (Heatmap / Split View)
The visual system is a presentation layer built on top of calculated data. It does not affect calculations but changes how results are displayed:
Split Volume shows directional distribution (buy vs sell approximation)
Delta Heatmap shows imbalance intensity visually
Color and transparency reflect relative participation
This layer only enhances readability and does not modify logic.
🔗 How All Components Work Together
All parts of the script are connected through a single flow:
OHLC + Volume data is collected per bar
Path-based logic distributes volume across price rows
A cumulative session matrix is built
POC is extracted from highest volume concentration
Value Area is derived around POC using cumulative thresholds
HVN/LVN zones are identified through relative comparisons
Visualization layer renders the structure dynamically
Each module is dependent on the same underlying dataset, but each serves a different analytical purpose within the session structure.
🧠 Design Logic Summary
These components are combined because the goal is not to create separate indicators, but to build a unified session-based volume framework. Each layer adds a different perspective on the same data:
Distribution → where activity occurred
POC → where maximum acceptance occurred
Value Area → where majority participation occurred
HVN/LVN → how structure varies across price
Development → how structure evolves over time
Together, they form a structured view of session-based market participation using only OHLC and volume data, without predictive assumptions or external data sources.
⚠️ Disclaimer
The Path-Based Session Volume Profile is a technical analysis tool designed to visualize and structure volume distribution across price levels within a defined trading session. It is based entirely on historical and real-time OHLC (Open, High, Low, Close) data and volume data provided by the trading platform. The calculations performed by this script are deterministic and rely strictly on available market data without using any forward-looking information.
This indicator is developed for educational and analytical purposes only. It is intended to help users better understand how volume may be distributed across price levels within a session and how structural elements such as Point of Control (POC), Value Area (VAH/VAL), and volume concentration zones are formed. It does not generate trading signals, does not provide financial advice, and does not recommend any buy or sell decisions.
All outputs shown by the indicator represent derived calculations based on historical price movement and volume activity. These outputs should be interpreted as contextual market structure information rather than predictive indicators of future price behavior. Market conditions are dynamic, and past volume distribution does not guarantee or imply any future performance, outcome, or market direction.
The script does not use tick-level order flow data, broker-level execution data, or any external order book information. Instead, it uses an OHLC-based approximation method to distribute volume across price levels. As such, the results should be understood as a structured representation of market activity rather than a precise reconstruction of actual traded volume at each price.
Users are solely responsible for any trading or investment decisions made based on this indicator. It is strongly recommended that this tool be used in combination with other forms of analysis, risk management techniques, and personal judgment. No indicator or analytical tool can eliminate risk or ensure profitability in financial markets.
Under no circumstances should this script be considered a guaranteed or accurate predictor of market behavior. All trading involves risk, including the possible loss of capital, and users should fully understand these risks before making any trading decisions.
By using this indicator, the user acknowledges that it is provided “as is,” without any warranties of performance, accuracy, or fitness for a particular purpose. The developer assumes no responsibility or liability for any financial losses or decisions made based on its output. مؤشر
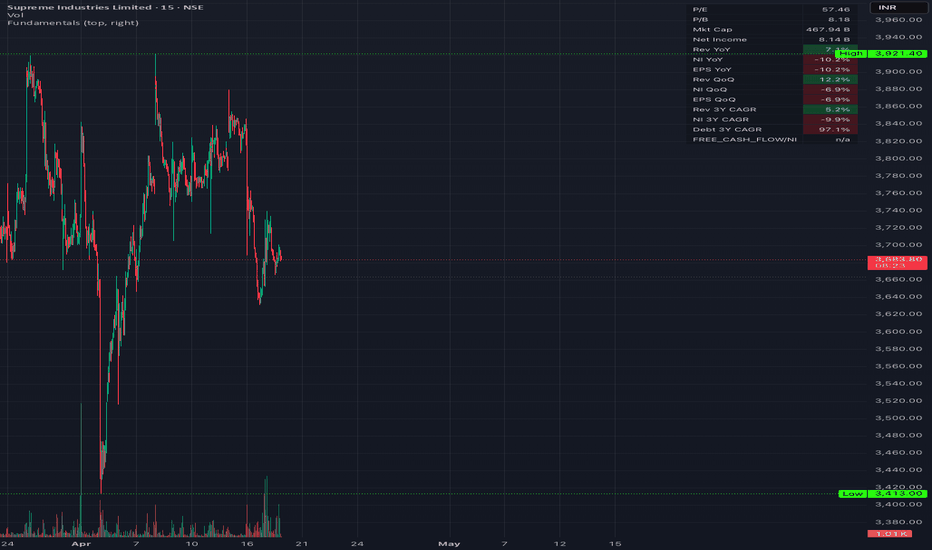
Financial fundamentalsThis indicator helps you understand the basic financial fundamentals of the company. It displays price to earning ratio, price to book ratio, market capitalisation, net income, revenue, net income and EPS growth, year on year and then quarter on quarter, followed by three years CAGR, growth of revenue, net income and debt. And if you think that these numbers can be manipulated, then it also shows free cash flow to net income ratio. So basically, it covers everything financiallythat is needed for you to see for a long-term investment. مؤشر
AI Smart Assistant UI Toolkit [Yosiet] AI Smart Assistant UI Toolkit
Most TradingView indicators provide data, but few provide a User Experience . This script is not just a market scanne, it is a fully modular UI Framework designed to help Pine Script developers build interactive, "talking" AI interfaces within their indicators.
The AI Smart Assistant Framework moves away from static labels and moves toward dynamic, state-driven communication.
Key Framework Features
+ State-Driven Typewriter Engine: Includes a logic-gate system that detects changes in market conditions and triggers a "typing" animation, making the AI feel responsive and alive.
+ Dynamic Pulsing System: A custom-built alpha-transparency oscillator that creates a "breathing" effect on the UI based on real-time tick data.
+ Advanced Theme Engine: Comes pre-loaded with 6 professionally designed color palettes (Nord, Midnight, Cyberpunk, Glassmorphism) that can be swapped with a single line of code.
+ Actionable Logic Lists: Demonstrates how to turn raw data into structured, easy-to-read "Recommended Action" checklists for the end-user.
++ Stateless Rendering : The UI is decoupled from the logic, allowing you to plug in any data source (MACD, EMA, Liquidity Zones) into the Assistant’s brain.
Included UI Themes
Nord: A professional, arctic-blue palette for serious analysts.
Midnight: High-contrast, deep-space colors for dark mode enthusiasts.
Cyberpunk: High-energy neon aesthetics for a modern "HUD" feel.
Warzone: Red bloody for a dramatic feel.
Minimalist Light: Clean and crisp for those who prefer white backgrounds.
How to use this as a Toolkit
This script is open-source and intended to be used as a template. To integrate this into your own project:
Define your Logic: Replace the RSI checks with your own entry/exit conditions.
Set the State: Use the AIState type to trigger the typewriter reset when your conditions are met.
Customize the UI: Modify the UITheme type to match your brand colors.
Requirements
Pine Script Version: v6
Performance: Lightweight. Optimized to render only on the last bar to save GPU resources.
Why I built this
I believe the future of TradingView scripts isn't just better math, it's better communication. If an user understands the "Why" behind a signal through a clear, beautiful interface, they become better traders.
Feel free to use this framework in your own public or private scripts. A credit to the original framework is always appreciated!
The data is not static, the UI should not be it مؤشر

مؤشر
مؤشر

مؤشر

مؤشر

WatermarkWatermark
A simple, clean watermark indicator designed to keep your trading mindset front and center while you work. Displays two fully customizable lines of text directly on your chart background — perfect for affirmations, rules, or reminders that keep you disciplined during a session.
Features:
Two editable text lines
Full color picker for text
Adjustable fade
Five text size options
Clean status line (no clutter)
How to Use:
Add the indicator to your chart, then click the Settings gear ⚙️ to customize the text, color, size, and fade to match your chart theme.
Default Text:
"Trade with no emotion"
"Not what you think it will do"
These two reminders were chosen intentionally — emotions are the #1 account killer, and the market will humble anyone who thinks they know what's coming next.
Customize the text to whatever rules or mantras matter most to your own trading process.
Free to use. No signals, no repaints, no nonsense — just a quiet reminder of what good trading looks like. مؤشر

مؤشر

Key Levels & SessionsThis is a professional-grade institutional key levels indicator designed for day traders who focus on session liquidity and high-volume price levels. The script provides a comprehensive view of the trading day by marking critical boundaries and institutional reference points, all strictly synchronized to the **America/New_York** (EST) timezone.
### **Key Features:**
#### **1. Institutional Daily Levels**
* **Previous Day High (PDH) & Low (PDL):** Marked with solid purple lines, these represent the most basic yet powerful liquidity levels from the prior trading day.
* **Previous Day Point of Control (POC):** A solid white line calculated using a Volume Profile algorithm. It identifies the price level where the most trading activity occurred during the previous session, acting as a "magnet" for price.
#### **2. Global Session Ranges**
* **Asia Session (8:00 PM - 2:00 AM EST):** Plotted in orange. This captures the initial range of the global trading cycle.
* **London Session (4:00 AM - 9:30 AM EST):** Plotted in blue. This identifies the volatility often seen during the European open leading into the New York session.
#### **3. New York 15-Minute Opening Range (ORB)**
* **ORB Box:** Automatically captures the high and low of the first 15 minutes of the New York session (9:30 AM - 9:45 AM EST).
* **Midline Projection:** Features a yellow dashed midline within the ORB box, a critical level often used by traders to determine intraday bias.
#### **4. Dynamic Projection & Cleanup**
* **Extension to Market Close:** Once established, every level (Asia, London, ORB, and PD levels) automatically projects forward to the **5:00 PM EST market close**.
* **Automatic Reset:** To keep your workspace clean and professional, the indicator utilizes an object-tracking system that deletes all drawings from the previous day at exactly 5:00 PM EST, allowing the chart to "reset" for the new Asia session.
* **Right-Anchored Labels:** All levels are clearly labeled on the right side of the chart, ensuring identification is instant without interfering with live price action candles.
### **How to Use:**
This tool is best used on **lower timeframes (1m to 15m)**. Traders often look for price to react at these levels—either as support/resistance or as "liquidity grabs" where price sweeps a session high/low before reversing. The NY ORB box provides a clear breakout or mean-reversion zone for the morning trend. مؤشر

مؤشر

MTF Candle Bias TableMTF Candle Bias Table
Brought to my attention by Max Algo — credit and appreciation to them for sharing this.
A clean, at-a-glance multi-timeframe dashboard that tells you where price is biased across up to 7 timeframes simultaneously — no more flipping between charts.
What it shows:
For each timeframe you choose, the table displays:
Candle — whether the current candle is bullish or bearish (close vs. open)
Bias — directional bias based on whether price has breached the prior bar's high or low
Trend — whether price is trading above or below a configurable EMA (default 50)
Hold/Fade — whether price is holding the bias level or fading it
Score — a confluence score (0–3) combining candle, trend, and hold alignment
Accuracy % — a rolling back-tested accuracy rate showing how often the bias predicted the next candle's direction correctly, over a selectable lookback period (1 day to 1 month)
A Bias Score row at the bottom gives you an instant bull vs. bear count across all visible timeframes, color-coded green or red based on overall market lean.
A session label (NY Open, Midday, PM Close, Globex, Overnight) keeps you oriented in the trading day at all times.
Customization:
Enable/disable any of the 7 timeframes individually
Toggle columns on/off (Trend, Hold, Score, Accuracy)
Vertical or Horizontal table layout
Symbols-only mode for a more compact view
Full color and position control
Great for confluence-based trading — use it to quickly confirm whether multiple timeframes agree before entering a trade.
Here's a breakdown of each feature straight from the logic in the code:
TREND
The trend column compares the current closing price to an EMA (default 50, but you can change the length). If close is above the EMA, it shows "↑ ABOVE" (bullish). If close is below the EMA, it shows "↓ BELOW" (bearish). This is calculated on each timeframe independently, so your 1m and 1D can show completely different trend readings. It's essentially asking: is price on the right side of the moving average on this timeframe?
HOLD vs. FADE
This column is tied directly to the Bias. Once a bias is established (bull or bear), Hold/Fade tells you whether price is respecting that bias level or failing it.
If the bias is bullish (price broke the prior bar's high), Hold checks whether the current close is still above that prior bar's high. If yes → ✓ HOLD. If not → ✗ FADE.
If the bias is bearish (price broke the prior bar's low), it checks whether the current close is still below that prior bar's low. If yes → ✓ HOLD. If not → ✗ FADE.
If there's no bias (neutral), it just shows a dash.
Think of it as a confidence check — a bias that's holding is stronger than one that's already fading.
SCORE (0–3)
The score is a simple confluence counter that adds up how many things are aligned with the bias. It scores a point for each of the following:
Candle agrees with bias — the current candle is bullish and bias is bullish, or both bearish
Trend agrees with bias — price is on the correct side of the EMA relative to the bias direction
Hold is active — price is holding the bias level (not fading)
So a score of 3/3 means everything is aligned: the bias is set, the candle confirms it, the trend supports it, and price is holding the level. A score of 0 or a dash means the bias exists but nothing else is confirming it. Neutral biases always show a dash regardless.
ACCURACY %
This is the most unique feature. It tracks, historically, how often the bias on each timeframe correctly predicted the direction of the next completed candle. Here's how it works:
Each time a new bar closes on a given timeframe, the indicator looks back at what the bias signal was on the previous completed bar
It then checks whether that bias was correct — did a bullish bias lead to a bullish close? Did a bearish bias lead to a bearish close?
It keeps a rolling log of those results (1 = correct, 0 = wrong) and calculates the percentage of correct predictions
The lookback window is controlled by your Accuracy Period setting (1 Day, 3 Days, 1 Week, 2 Weeks, or 1 Month), and it automatically scales the number of bars based on the timeframe
The color coding gives you a quick read:
🟢 Green (60%+) — the bias signal has been reliably predictive
🟡 Yellow (50–59%) — marginally better than a coin flip
🔴 Red (below 50%) — the signal has been more wrong than right recently
This helps you know which timeframes are currently giving trustworthy signals and which ones to treat with skepticism. مؤشر

استراتيجية

Liquidity Acceptance Map [PhenLabs]📊 Liquidity Acceptance Map
v1.0 — Equal high/low sweeps graded by a volume + ATR acceptance score — only the highest-conviction zones plotted
📌 OVERVIEW
Liquidity Acceptance Map (LAM) identifies high-probability liquidity zones by combining three layers of confirmation: equal high/low detection (liquidity pool location), sweep event confirmation (price takes out the level), and a graded Acceptance Score (0–100) that measures how convincingly the market accepted the new price range using volume and ATR expansion.
Zones that don’t clear the score threshold are never plotted — only the highest-conviction sweeps make it to the chart. A real-time dashboard shows all active zones, their type, and live scores. An optional HTF EMA bias filter ensures you only see zones aligned with the higher-timeframe trend.
HOW IT WORKS
Equal High/Low Detection
Swing pivots are identified using a balanced left/right lookback window
Two consecutive pivots within the configurable Equal Level Tolerance % form a liquidity pool
The pool level is the average of the two pivots — reducing precision noise
Sweep Confirmation
A sweep fires when price exceeds the pool level by Sweep Margin %
Optional: require the close to be beyond the level (prevents wick-only traps)
Sweep detection is gated on barstate.isconfirmed — no repainting
Acceptance Score (0–100)
Calculated on the sweep bar using two components:
Volume Component : how far current volume exceeds the N-bar average, normalized against the configured multiplier
ATR Component : how far current ATR exceeds the ATR average, normalized against the configured multiplier
Weighted combination: Score = Vol Score × Vol Weight% + ATR Score × (100 - Vol Weight%)
Score of 100 = full volume AND full ATR expansion at or above both multiplier thresholds
Zones with Score below Minimum Acceptance Score are silently discarded
Zone Management
Accepted zones plotted as semi-transparent filled rectangles with a label: type, score, and entry price
Each zone includes a dashed invalidation line at a configurable offset beyond the zone boundary
When price closes beyond the invalidation level, the zone is greyed out — never deleted, always auditable
Maximum active zones is configurable (default: 2) — oldest zone removed when limit is hit
HTF Bias Filter (Optional)
Pulls an EMA from a user-selected higher timeframe using lookahead_off — no lookahead repaint
Bullish zones (swept lows) only plot when HTF EMA is rising
Bearish zones (swept highs) only plot when HTF EMA is falling
Disabled by default — works as a standalone tool without it
🔑 POINTS OF INNOVATION
Graded Acceptance Score — most liquidity tools are binary (sweep or no sweep); LAM adds a 0–100 confidence layer so you know how much conviction backed the sweep
Dual-component scoring — volume expansion alone can mislead during low-ATR consolidation; combining both components produces a more robust regime signal
Zone cap per session — prevents chart clutter; only the 1–2 most relevant zones stay active at any time
Non-destructive invalidation — invalidated zones are greyed out, not deleted — preserving historical context without cluttering the active signal layer
HTF bias integration — directional conviction from a higher timeframe filters out counter-trend sweeps that statistically resolve against you
Dashboard table — real-time view of all active zones, types, and scores without needing to hover over boxes
🔧 SETTINGS
Equal High/Low Detection
Swing Lookback | Default: 20 | Range: 5–100 | Bars used to identify swing pivots
Equal Level Tolerance (%) | Default: 0.1 | Range: 0.0–2.0 | Max % difference for two pivots to be considered “equal”
Sweep Confirmation
Sweep Margin (%) | Default: 0.1 | Range: 0.0–2.0 | Price must exceed the pool level by this % to confirm a sweep
Require Close Beyond Sweep | Default: ON | Sweep requires a confirmed bar close beyond the level
Acceptance Score
Volume Expansion Multiplier | Default: 1.5 | Range: 1.0–5.0 | Volume ratio needed for full volume score
ATR Expansion Multiplier | Default: 1.2 | Range: 1.0–5.0 | ATR ratio needed for full ATR score
Volume Weight in Score (%) | Default: 60 | Range: 0–100 | Split between volume and ATR in the composite score
Minimum Acceptance Score | Default: 60 | Range: 0–100 | Zones below this score are discarded
Score MA Lookback | Default: 20 | Range: 5–100 | Lookback for volume and ATR moving averages
Zone Management
Max Active Zones | Default: 2 | Range: 1–5 | Cap on simultaneously visible zones
Invalidation Offset (%) | Default: 0.2 | Range: 0.0–2.0 | Close beyond this % negates the zone
Show Dashboard | Default: ON | Top-right table of active zones + scores
HTF Bias Filter
Enable HTF Bias Filter | Default: OFF
HTF Timeframe | Default: 240 (4H) | Higher timeframe for EMA
HTF EMA Period | Default: 50 | EMA period on the HTF
Colors
Bullish Zone, Bearish Zone, Sweep Marker, Invalidation Line — all fully customizable
🔥 ALERTS
LAM — Bullish Sweep Accepted : fires when a bullish sweep passes the acceptance score threshold
LAM — Bearish Sweep Accepted : fires when a bearish sweep passes the acceptance score threshold
🎨 VISUAL GUIDE
Teal filled rectangle = active bullish zone (swept low, price expected to hold as support)
Red filled rectangle = active bearish zone (swept high, price expected to hold as resistance)
Grey filled rectangle = invalidated zone (price closed beyond the invalidation line)
Dashed grey line = invalidation level for each zone
Orange triangle markers = sweep confirmation events (bull = below bar, bear = above bar)
Top-right table = dashboard: price level, zone type, acceptance score
📖 USAGE NOTES
Designed for 1H, 4H, and Daily timeframes — where equal high/low clusters carry the most institutional significance
On lower timeframes (15m) , increase Equal Level Tolerance to 0.15–0.2% to account for spread noise
On volatile assets (crypto) , increase Sweep Margin to 0.2–0.3% to avoid false sweep triggers
Scores above 75 indicate very high-conviction sweeps — consider these primary entries
Scores 60–75 are valid but lower confidence — useful for confirmation, not standalone entry
Enable HTF Bias Filter to avoid counter-trend fades in strongly trending markets
The zone height is one ATR centered on the swept level — giving each zone contextual thickness relative to the instrument’s volatility
✅ WORKS WELL WITH
Volume profile tools (to confirm zone with high-volume nodes)
Session-based VWAP (anchored from sweep bar)
Trend filters (EMA, Supertrend) to qualify zone direction
Risk management tools (ATR-based stops, aligning with invalidation levels)
⚠️ DISCLAIMER
This indicator is for educational and research purposes only. It does not constitute financial advice or a trading recommendation. Past performance does not guarantee future results. Always conduct your own analysis before making any trading or investment decision.
مؤشر

Cost Basis + Cipher Filtered Signal v3Cost Basis + Cipher Filtered Signal is a multi-layer market regime indicator built around a macro stress thesis that monitors two simultaneous compression cycles — a private credit and commercial real estate bubble deflating at the macro level, and a crypto speculative cycle correcting from its 2025 peak — using ETH SOPR (Spent Output Profit Ratio) from Glassnode as the primary on-chain regime signal, combined with RSI, dual EMA trend alignment (50/200), Bollinger Band squeeze detection, a funding rate proxy calculated from the spread between perpetual and spot price, and volume ratio analysis, all rolled into a composite scoring system that outputs a single color-coded BULLISH / BEARISH / NEUTRAL thesis reading with price targets, flush zones, and phone alerts — designed specifically to identify the inflection point where macro liquidity stress and crypto on-chain cycle signals converge, flagging either a final capitulation flush or a policy-driven reversal as the two possible regime exits. مؤشر

مؤشر