مؤشر

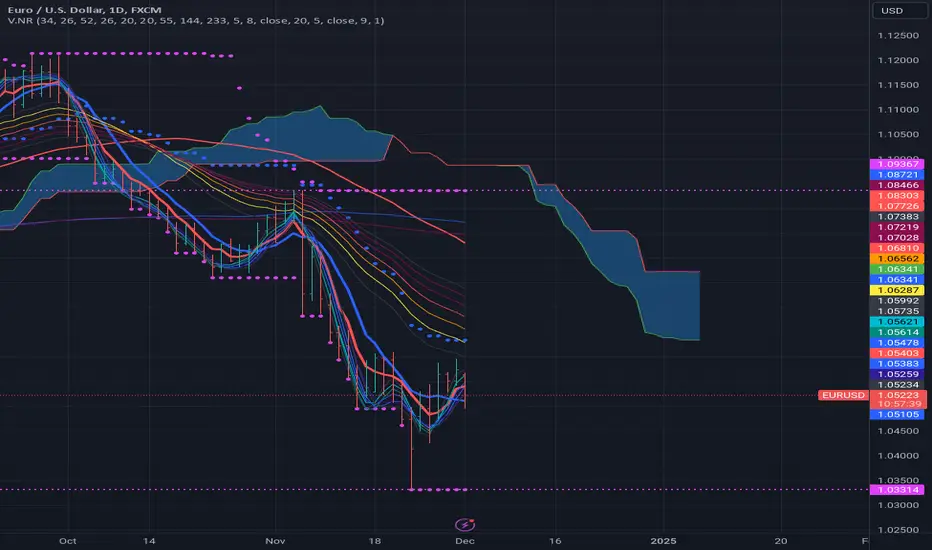
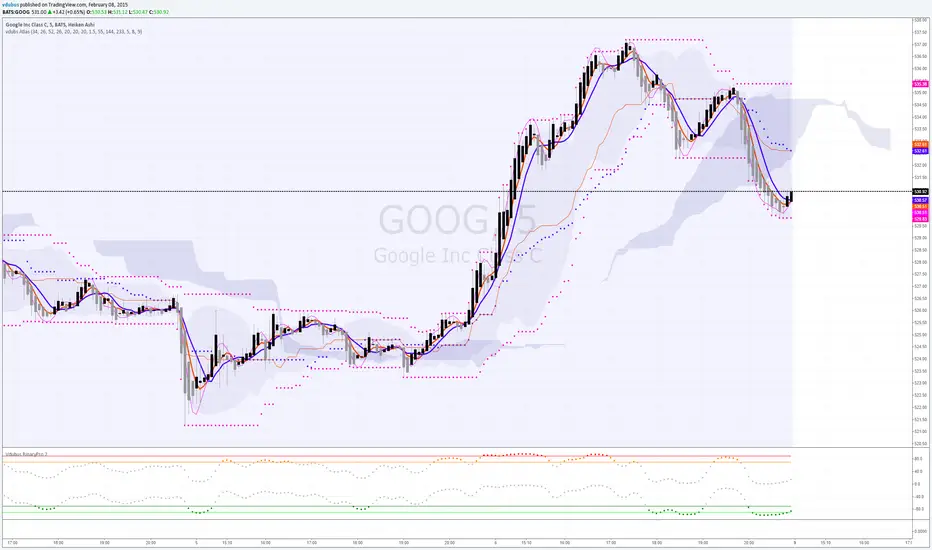
Guerrilla AdvancedThis indicator was designed with people without Pro License in mind (Including many of my close friends).
Basically, you will get a combo of few different tools in one box, with ability to turn them on and off with a single check mark, also, you have total control over the input numbers that was used in calculations if you so want to, for example, sometimes when i see a massive bullish up trend, i reduce the short rally from 12 to 8 even 6 to get faster signal for selling the trend.
So, what will you get in this pack?
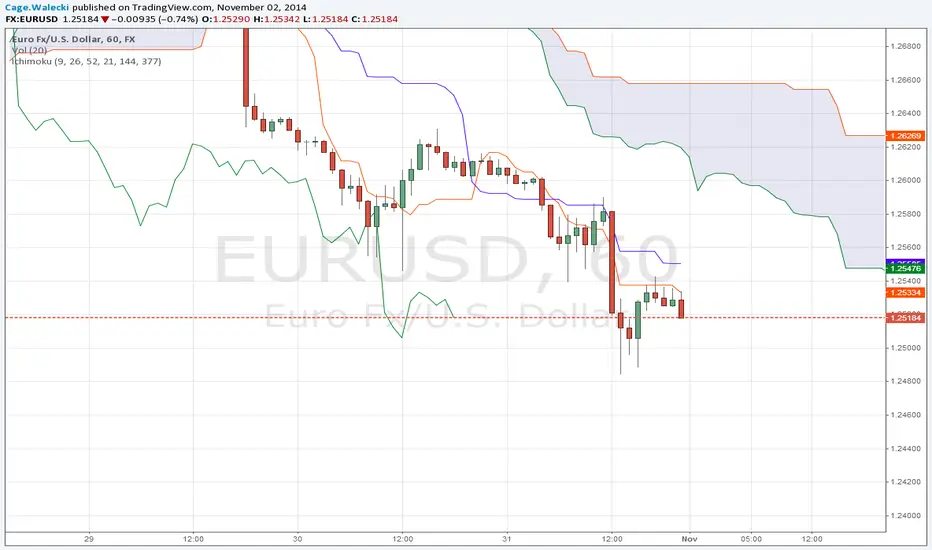
1- Ichimoko. Yes, you heard it right, although we have it in the default tools but hey, it will use one indicator slot and if you don't have a pro license, you will use that slot
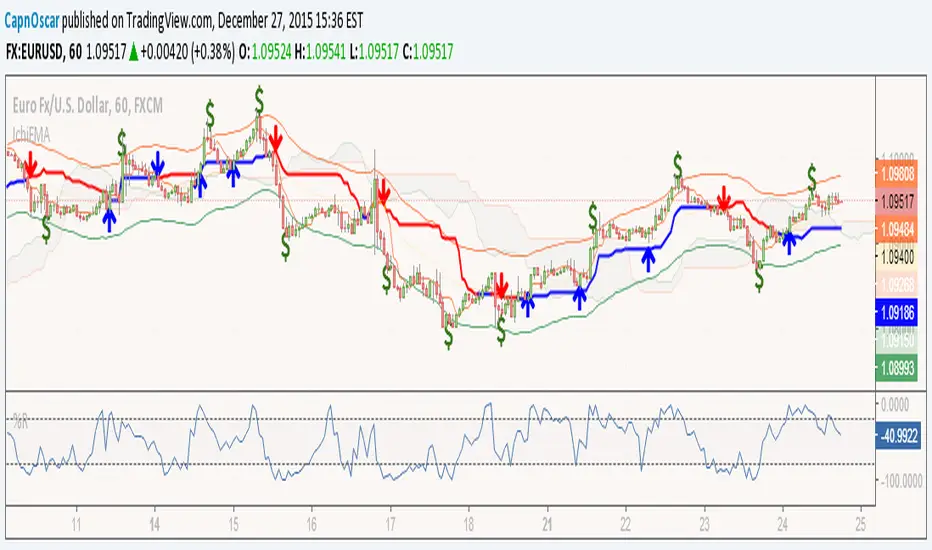
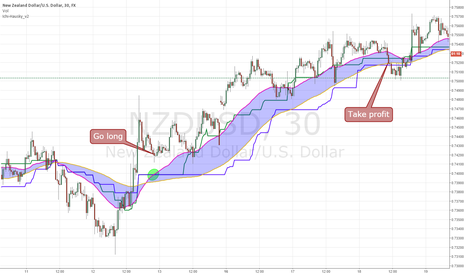
2- Rally. This is an old yet very powerful system for getting buy or sell signals, basically, you get two lines and for making the life easier i draw a cloud between them. when the trend passes above the cloud and it was bellow it in past, right after the very first candle that gets above the cloud you can put the buy order, and vice versa, the moment a candle body enters the cloud, if you want an aggressive signal, you can sell, if not, you may want to wait to see if the candles drop bellow the cloud or not then decide.
3- Resistance Support Cloud. Most of us always heard about resistance and support "lines" but many of us don't know that, in each trend, the trend line itself is a resistance or support line, and when you are going in a bullish or bearish tunnel, the floor and roof of tunnels are again resistance and supports, using this part of the tool, just like rally, you get a cloud that shows you the resistance / support "zone"
4- William Fractals. To be honest, I got this part of the code from another source available around. Why? looking at those fractal indicators, you can easily eyeball the trend line or existence of a tunnel.
5- Different EMA lines. If you are one of those people that use EMA lines for their trading, have fun with them, there are few different standard ones and even a custom one that you can put your desired number for it. مؤشر

مؤشر

استراتيجية

مؤشر

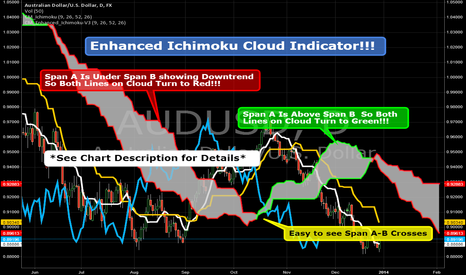
CM_Enhanced_Ichimoku Cloud-V5.2New version of the improved Ichimoku cloud
Original by Chris Moody, great work.
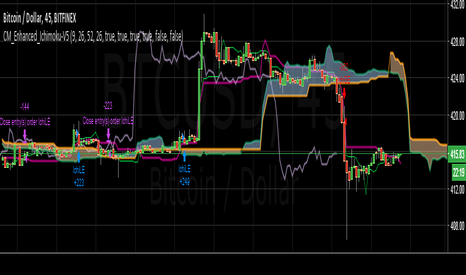
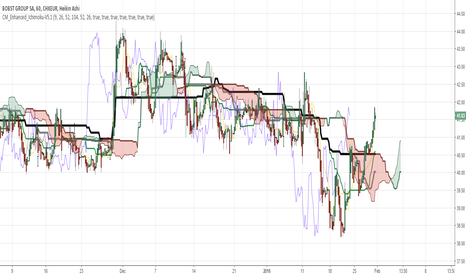
This indicator is a colorized Ichimoku with colors that you can change for any component. Not many changes between 5.1 and 5.2, I fixed some labels and the crossing detection, as well as the default colors.
There's not much more left we can do without radically changing the original Ichimoku. We could implement full-multiframe but you can already do that by adding several times this indicator and changing the periods.
Displayed components:
Kijun-Sen: middle of the highest/lowest prices during the last 26 periods
Tenkan-Sen: middle of the highest/lowest prices during the last 9 periods
Senkou Span A (SSA) : average of Kijun and Tenkan, projected 26 periods ahead
Senkou Span B (SSB): middle of the highest/lowest prices during the last 52 periods, and projected 26 periods ahead
Chikou Span: the closing price projected 26 periods behind.
Kumo: the cloud itself, the area between SSA/SSB.
The script also provides indication of the crossings between Tenkan and Kijun, some trading strategies are based upon that. There is also a separate Kijun with its own period for those you'd like to have this information at another timeframe. I removed the third Kijun that was in version 5.1, I don't think it was widely used and made the configuration screen too crowded. If you really need this, take a look at Donchian indicators, the Kijun is basically a Donchian on 26 periods.
Chris Moody Version (v5):
مؤشر

مؤشر

مؤشر
استراتيجية
مؤشر
مؤشر

استراتيجية

مؤشر
مؤشر

مؤشر

مؤشر
مؤشر

مؤشر

مؤشر

مؤشر

مؤشر

مؤشر

مؤشر