Oleg AlgoWelcome to Oleg Algo, a heavy-duty, multi-layered statistical mean-reversion and trend-following strategy designed for traders who like to scale into volatility like a crazy. This script allows you to harvest profits from market extremes using dynamic gap thresholds, aggressive scale-in martingale sizing, and built-in risk boundaries.
Key Features
Dual Strategy Modes: Switch effortlessly between Reversal Mode (catching extreme overextended moves by fading the gap) and Trending Mode (riding the momentum wave).
Flexible Band Calculations: Measure market boundaries using either ATR (Average True Range) for pure volatility-based distance or Bollinger Bands (Standard Deviations) for statistical dispersion.
Scale-In Martingale System: Automatically scale into positions as the market moves against you. Choose between an exponential Multiplier or a linear Quantity Step to average down like a true strategist.
Win/Loss Outcome Sizing: Optionally adjust your base position size up or down following a win or loss to dynamically manage your exposure streak.
Time Windows: Built-in EST market-session filters that strictly lock your trading window and automatically flatten all open positions before the closing bell rings.
Max Dollar Loss Circuit Breaker: An absolute safety switch that liquidates everything if unrealized open drawdowns cross your predefined dollar risk threshold.
Input Guide
Strategy Execution Mode: Choose whether we hunt the reversal when price crashes hard away from the line, or follow the big bear/bull wave.
Trade Direction: What kind of hunt we do—go both ways like a smart trader, or stick strictly to long-only or short-only.
Moving Average Type & Length: Pick your line flavor (SMA, EMA, HMA).
Band Calculation & Initial Gap: Define how far price must run away from the baseline before enter trade.
Scale-In Step & Martingale Settings: Control how deep price must drop before adding more size, and how aggressively each stacked layer grows.
Take Profit & Stop Loss Multipliers: Set your distance for collecting big feasts when the average entry price bounces back, alongside the emergency parachute stop loss.
Prop Mode & Start/End Times: Lock your trading strictly inside capitalist working hours so you never violate risk rules or hold overnight risk. استراتيجية

Aurora_Channel_V1█ Overview
The Aurora Channel is an adaptive multi-layer volatility and expansion framework that fuses Bollinger Bands, Keltner Channels, volume-sensitive dynamics, and intelligent moving-average selection into a single coherent system.
Instead of treating channels as static statistical boundaries, Aurora continuously evaluates market behavior, selects the most suitable moving-average engine in real time, expands or contracts outer envelopes according to volume and width regimes, and projects dynamic trigger and crossover levels that respond to actual price action.
The result is a hybrid channel system that blends:
• Adaptive MA selection (Auto / Adaptive Scoring)
• Volume-modulated Keltner expansion
• Hybrid Bollinger–Keltner “Aurora” bands
• Multi-layer expansion envelopes
• Peak-aware or dynamically tracking Trigger Channel
• Crossover Multiplier Engine with adaptive overlays
• Regime-aware visuals and a live Dashboard HUD
█ Why is this one unique
Most channel indicators are fixed formulas. Aurora is a full adaptive channel engine built in Pine Script v6.
It does not simply plot Bollinger or Keltner bands. It constructs a hybrid core, surrounds it with volume-aware expansion logic, maintains intelligent outer triggers, and generates dynamic crossover projection lines whose multiplier is itself adaptive.
⚪ What it does
At a high level:
Auto MA Selection Engine
Continuously scores SMA, EMA, RMA (SMMA), WMA, and VWMA candidates using a combined lag-error + jitter penalty. The engine automatically selects the MA with the lowest overall score (or lets the user force a manual choice). This becomes the center line for every subsequent calculation.
Hybrid Aurora Core
Builds classic Bollinger Bands and a volume-sensitive Keltner Channel around the selected midline. The Keltner multiplier dynamically expands between 3.0–4.0 during volume spikes. The difference between the two outer bands is then smoothed and re-applied, creating the final Aurora Upper / Lower bands.
Expansion Envelope
Measures the current Aurora width, smooths it, and projects outer envelope levels that react to both width expansion and tick-volume intensity. Optional “Breakouts Only” mode shows the envelope solely when price is already expanding beyond the Aurora bands.
Trigger Channel
Two memory modes:
• Dynamic Tracking – continuously follows expansion and decays when price returns inside.
• Hold Peak Level – latches the highest/lowest expansion extremes.
A proportional buffer is then added, creating clean outer trigger lines.
Crossover Multiplier Engine
Monitors crosses of a user-selected target (Midline, Aurora Bands, Envelope, or Trigger). On every cross it captures the current Keltner multiplier × volume ratio, latches that value, smooths it with the same adaptive MA engine, and projects symmetric overlay lines around the midline. These act as adaptive reaction / target levels.
Multi-Layer Clouds + Regime Visuals
Soft gradient fills between midline → Aurora and Aurora → Envelope, plus a softer fill toward the Trigger. Candles are colored by regime (above/below midline). A compact Dashboard HUD displays the active MA, cross target, current multiplier, expansion state, and regime.
⚪ Why it is good
The strongest aspect is the combination of adaptive center selection, volume-aware expansion, and quality-aware outer structures in one coherent framework.
Most channel tools are either pure statistical (Bollinger) or pure volatility (Keltner/ATR). Aurora merges both, then adds intelligent memory (Trigger modes) and a live crossover-driven multiplier engine. The visual hierarchy (multi-layer clouds) makes regime and expansion instantly readable, while the Dashboard keeps the key adaptive values visible without cluttering the chart.
⚪ What makes it sophisticated
• Real-time adaptive MA scoring with lag + jitter penalty
• Dynamic Keltner multiplier driven by volume ratio
• Hybrid band construction that re-injects smoothed BB–KC difference
• Dual-mode Trigger memory (peak hold vs continuous tracking + decay)
• Crossover-triggered multiplier latching and adaptive projection
• Multi-layer gradient fills that scale with the actual channel hierarchy
• Non-repainting alerts on confirmed crosses
⚪ Why It’s Marketable
Traders looking for more than a simple Bollinger or Keltner band receive a complete adaptive channel ecosystem. The Auto MA engine removes the endless debate of “which MA is best,” the Expansion Envelope and Trigger Channel give clear breakout and reaction zones, and the Crossover Multiplier Engine turns every significant cross into dynamic, volume-aware target lines. The result is a selective, visually rich, and highly configurable system that adapts to the instrument and timeframe instead of forcing a fixed formula onto every market.
⚪ Main weakness
The system is still rule-based adaptive logic, not deep learning. Performance depends on the chosen lengths, the quality of volume data (especially on tick-volume charts), and the current market regime. Over-optimization of the many parameters can reduce robustness.
█ How It Works
⚪ Auto MA Selection Engine
Scores five classic moving averages on tracking error (squared lag) plus a jitter penalty. The lowest combined score becomes the active center line used by every channel component.
⚪ Aurora Core Construction
• Midline = selected MA
• Bollinger = midline ± StdDev × multiplier
• Keltner = midline ± ATR × volume-modulated multiplier (3.0–4.0)
• Aurora bands = Keltner ± smoothed (BB – KC) difference
⚪ Expansion Envelope
Average Aurora width is multiplied by a base factor and further expanded by excess volume. The resulting offset is added outside the Aurora bands. Optional breakout-only plotting keeps the chart clean until genuine expansion occurs.
⚪ Trigger Channel
On expansion the system either latches the extreme (Hold Peak) or follows and slowly decays the level (Dynamic Tracking). A proportional buffer creates the final trigger lines.
⚪ Crossover Multiplier Engine
Detects crosses of the chosen target, captures kcMult × volRatio, latches the value, smooths it with the adaptive MA engine, and projects midline ± ATR × smoothed multiplier as dotted overlay lines.
█ How To Use
• Use the Aurora bands as the primary dynamic support/resistance zone.
• Watch the Expansion Envelope for genuine volatility breakouts.
• Treat the Trigger Channel as outer reaction / invalidation levels.
• The Crossover Multiplier lines act as adaptive targets or reaction zones after significant crosses.
• Candle color and the Dashboard HUD give instant regime and state information.
• Enable alerts on the crossover condition for automated notifications.
█ Settings
Auto MA Selection Engine
• MA Selection Engine (Auto Adaptive / Manual)
• Manual MA type
• Jitter Penalty strength
Core Channel Engine
• Base Center Length
• Bollinger StdDev multiplier
• Keltner ATR Length
• Tick Volume MA Length & Expansion Factor
• Band Difference MA Length
Expansion Envelope
• Show / Breakouts Only
• Expansion MA Length
• Envelope Base Multiplier & Volume Boost
Trigger Channel
• Show Trigger
• Buffer Multiplier
• Memory Mode (Dynamic Tracking / Hold Peak Level)
Crossover Multiplier Engine
• Show Dynamic Lines
• Cross Monitoring Target
• Multiplier MA Smoothing Length
Visual Settings
• Candle Coloring
• Multi-Layer Cloud
• Dashboard HUD
• Full color customization for every layer
█ Disclaimer
The content provided in this script is for educational and informational purposes only. It does not constitute financial advice, investment recommendations, or a solicitation to buy or sell any financial instruments. Past performance is not indicative of future results. All trading involves risk, and you are solely responsible for your own trading decisions. مؤشر

استراتيجية

مؤشر

TF: BB/KC and Potential Reversals (BBKC)TradingFlow: BB/KC and Potential Reversals (BBKC)
BBKC combines Bollinger Bands (BB) and a Keltner Channel (KC) in one clean overlay, then uses band re-entry and momentum conditions to highlight potential bullish and bearish reversals. Its purpose is to make volatility structure, trend behaviour, compression, expansion, and possible turning points easier to read without covering the chart with separate indicators.
The diamond markers are hints that price may be reacting after an extended move or that momentum may be fading. They are not automatic trade instructions, and they do not mean a reversal is confirmed.
A Unified BB / KC View
Bollinger Bands and Keltner Channels describe volatility in different ways:
• Bollinger Bands: use standard deviation, so their width changes as price movement expands or contracts.
• Keltner Channel: uses ATR around an EMA to create a smoother channel for reading trends and pullbacks.
BBKC plots both structures with one visual theme rather than stacking two unrelated indicators. The more visible aqua boundaries are the KC, while the lighter boundaries are the BB. Subtle shading makes it easier to see how the two envelopes contract and expand around price, and the full KC area can also be lightly shaded if preferred.
This merged presentation is useful even without the reversal markers. The slope and direction of the channels, the side of the channel where price is holding, and the way price reacts at the boundaries can all provide trend context.
Why the Default KC Multiplier Is 1.6
By default, the KC uses a 20-period EMA and an ATR multiplier of 1.6. Many modern Keltner Channel implementations use a 2.0 ATR setting. BBKC uses 1.6 to keep the boundaries somewhat closer to price, making routine pullbacks, boundary tests, and re-entry behaviour easier to see. This is a visual design choice, not a claim that 1.6 is inherently more accurate.
The multiplier is adjustable. Different instruments and trading styles may benefit from a wider or narrower channel, so 1.6 should be understood as a useful default rather than a universal optimum.
How to Read the Potential Reversal Markers
• Green diamond: a bullish potential reversal. Price has reacted from a lower volatility boundary and passed the enabled filters.
• Red diamond: a bearish potential reversal. Price has reacted from an upper volatility boundary and passed the enabled filters.
By default, the script looks for the close to cross back inside a lower or upper KC or BB boundary. An optional rejection rule also checks whether the current or preceding candle touched or pierced a Bollinger Band before the current candle closed back inside.
The optional filters are designed to reduce ordinary boundary crossings:
• Volatility context: one of the two preceding closes must have been outside the corresponding boundary of a separate ATR-based Volatility Channel.
• RSI momentum: RSI must be below the bullish threshold or above the bearish threshold. Both levels are adjustable.
• Stoch RSI extreme: within a recent validity window, at least one completed bar must have both smoothed K and D in the 90/10 extreme zone. The window is adjustable and defaults to the two bars before the potential reversal; the current re-entry bar is excluded.
Potential reversal conditions are confirmed at bar close. The separate Volatility Channel can remain hidden while its values are still used by the filter; display it when you want to inspect those boundaries on the chart.
What a Marker Can and Cannot Mean
A potential reversal may become a major trend reversal, but it may also be only a small pullback, a pause within the existing trend, or a failed signal followed by continuation. The script detects a filtered move back from a volatility boundary; it cannot know in advance which outcome will follow.
The marker is therefore more useful as a prompt to investigate the chart than as a standalone entry command. A marker appearing against a strong trend should generally require more evidence than one appearing at a well-established structural level after an exhausted move.
Practical Reading Process
1. Read the slope and position of the BB / KC structure to understand the current trend and volatility regime.
2. Note whether the BB is compressing inside the KC or expanding beyond it.
3. When a diamond appears, check whether it is located near meaningful market structure rather than evaluating the marker in isolation.
4. Look for confirmation through price action, trend structure, support and resistance, or a failed breakout.
5. Add independent context such as volume profile, high- and low-volume areas, and the reaction around important support or resistance levels.
6. Define invalidation and risk before considering an entry.
Alerts
Alerts can be created for bullish potential reversals, bearish potential reversals, or either direction. They use the same final confirmed conditions and remain available when chart markers are hidden. For live use, “Once Per Bar Close” is recommended.
Important
BBKC is a chart-reading and opportunity-screening tool. Its markers are filtered potential reversals, not probabilities, guaranteed turning points, or complete trading systems. Settings behave differently across instruments and timeframes. Always combine the output with broader trend analysis, market structure, volume context, support and resistance, and appropriate risk management.
---
TradingFlow: BB/KC and Potential Reversals (BBKC)
BBKC 把布林通道(Bollinger Bands,BB)與肯特納通道(Keltner Channel,KC)整合在同一張主圖,並根據價格重新進入通道及動能條件,標示潛在的多頭和空頭反轉。它讓波動、趨勢、收縮、擴張和可能的轉折位置更容易判讀,不用另外疊加兩個指標。
菱形標記只是一個提示:價格經過一段延伸後,可能開始回頭,或原有動能正在減弱。它不是自動交易指令,也不代表反轉已經確認。
整合的 BB / KC 顯示
BB 與 KC 以不同方式描述波動:
• 布林通道: 使用標準差,會隨價格波動的擴大和收窄而改變。
• 肯特納通道: 以 EMA 為中心,利用 ATR 建立較平滑的通道,適合觀察趨勢與回調。
BBKC 用統一的配色呈現兩者。較清晰的水藍色邊界是 KC,較淡的邊界是 BB。淡色填充可幫助觀察兩組通道如何隨價格收縮和擴張,也可選擇顯示整個 KC 範圍。
即使不看反轉標記,這組通道本身也能幫助判斷趨勢。可留意通道斜率、價格主要停留在哪一側,以及價格接近邊界時的反應。
為何 KC 預設倍數是 1.6
KC 預設使用 20 週期 EMA 和 1.6 倍 ATR。現代 KC 指標常見的 ATR 設定是 2.0;BBKC 改用 1.6,讓邊界稍微靠近價格,更容易看到一般回調、邊界測試及價格重新進入通道的情況。這是為了方便讀圖,並不代表 1.6 本身更準確。
倍數可以自行修改。不同市場、時間週期和交易方式可能適合不同寬度,因此 1.6 只是實用的起始設定,並非所有情況下的最佳值。
如何閱讀潛在反轉標記
• 綠色菱形: 多頭潛在反轉。價格從下方邊界回升,並通過已啟用的過濾條件。
• 紅色菱形: 空頭潛在反轉。價格從上方邊界回落,並通過已啟用的過濾條件。
預設會尋找收盤價重新進入 KC 或 BB 邊界的情況。也可加入額外條件:目前或前一根 K 線先觸及/突破 BB,然後目前 K 線收回通道內。
各項過濾器用於減少普通邊界穿越造成的雜訊:
• 波動背景: 前兩根 K 線中,至少一根的收盤價必須曾位於另一組 ATR 波動通道的相應邊界之外。
• RSI 動能: 多頭標記要求 RSI 偏低,空頭標記要求 RSI 偏高;門檻可自行調整。
• Stoch RSI 極端值: 在近期有效期內,至少一根已完成 K 線的平滑 K、D 必須同時進入 90/10 極端區域。有效期可以調整;預設檢查潛在反轉前的兩根 K 線,不包括目前重新進入通道的 K 線。
潛在反轉條件只會在 K 線收盤後確認。另一組 Volatility Channel 即使隱藏,其數值仍可用於過濾;如想直接查看這些邊界,可在設定中顯示它。
標記可能代表甚麼
潛在反轉可能最終發展成主要趨勢反轉,也可能只是一個小型回調、原有趨勢中的短暫停頓,甚至是錯誤提示,之後價格繼續沿原方向運行。這套判斷只能找出價格從波動邊界回頭的跡象,無法預先知道之後會出現哪一種結果。
標記的作用是提醒你多看一眼,而不是叫你立即進場。逆著強勁趨勢出現時,通常需要更多確認;若它出現在明確的支撐、阻力或區間邊緣,而且此前走勢已有明顯延伸,才更值得留意。
實用判讀流程
1. 先閱讀 BB / KC 的斜率及價格位置,判斷目前趨勢與波動狀態。
2. 觀察 BB 正在 KC 內部收縮,還是向 KC 外部擴張。
3. 菱形出現時,先看它是否接近支撐、阻力或區間邊緣,不要只看標記本身。
4. 利用價格行為、趨勢結構、支撐阻力或假突破尋找確認。
5. 配合成交量分布(Volume Profile)、高/低成交量區,以及重要支撐阻力附近的反應。
6. 考慮進場前,先定義失效位置及風險。
警報
如需追蹤,可分別在多頭潛在反轉、空頭潛在反轉,或兩者任一出現時建立警報。警報只會在收盤條件確認後觸發;隱藏圖表上的菱形標記不會影響警報。即時使用時,建議選擇「Once Per Bar Close」。
重要說明
BBKC 是圖表判讀及機會篩選工具。標記只表示經過條件過濾的潛在反轉,不代表任何勝率,也不是必然轉折或完整交易系統。不同市場和時間週期的表現可能不同。使用時仍要結合趨勢、市場結構、成交量、支撐阻力和風險管理。
---
TradingFlow: BB/KC and Potential Reversals (BBKC)
BBKCは、ボリンジャーバンド(BB)とケルトナーチャネル(KC)を1つの見やすいオーバーレイに統合し、バンドへの再進入とモメンタム条件から、強気・弱気の潜在的な反転を表示します。複数の指標を重ねてチャートを複雑にすることなく、ボラティリティ構造、トレンド、収縮、拡大、転換候補を読みやすくすることが目的です。
ひし形のマーカーは、伸びた値動きが反応し始めた、またはモメンタムが弱まりつつある可能性を知らせるヒントです。自動売買の指示ではなく、反転が確定したことも意味しません。
BBとKCを統合した表示
BBとKCは異なる方法でボラティリティを表します。
• ボリンジャーバンド: 標準偏差を使うため、価格のばらつきの変化に反応します。
• ケルトナーチャネル: EMAを中心にATRで幅を作る、より滑らかなチャネルです。トレンドや押し戻りの確認に使えます。
BBKCは両者を共通の配色で整理して表示します。より明瞭なアクア色の境界がKC、薄い境界がBBです。控えめな色付けにより、2つのチャネルが価格の周囲で収縮・拡大する様子を見やすくし、必要に応じてKC全体の範囲も薄く表示できます。
この統合表示は、反転マーカーを使わない場合にも有用です。チャネルの傾き、価格が維持されている側、境界での反応から、トレンドの背景を読み取れます。
KCのデフォルト倍率が1.6である理由
KCは、デフォルトで20期間EMAと1.6倍のATRを使用します。現代的なKCでは2.0倍のATRもよく使われますが、BBKCは境界を価格に少し近づけ、通常の押し戻り、境界テスト、チャネルへの再進入を見やすくするために1.6倍を採用しています。これは見やすさのための設計であり、1.6倍のほうが本質的に正確という意味ではありません。
倍率は調整可能です。銘柄、時間軸、取引スタイルによって適切な幅は異なるため、1.6は実用的な初期値であり、すべての市場に共通する最適値ではありません。
潜在リバーサル・マーカーの見方
• 緑のひし形: 強気の潜在リバーサル。価格が下側のボラティリティ境界から反応し、有効なフィルターを通過した状態です。
• 赤のひし形: 弱気の潜在リバーサル。価格が上側のボラティリティ境界から反応し、有効なフィルターを通過した状態です。
デフォルトでは、終値がKCまたはBBの境界内へ戻る動きを検出します。追加条件では、現在または直前の足がBBに到達・突破し、その後に現在の終値がバンド内へ戻った場合も候補にできます。
各フィルターは、通常の境界通過によるノイズを抑えるために使用します。
• ボラティリティ背景: 直前2本のうち少なくとも1本の終値が、別のATRベースのVolatility Channelの対応する境界より外側であることを要求します。
• RSIモメンタム: 強気ではRSIが下側しきい値未満、弱気では上側しきい値を超えていることを要求します。どちらもしきい値を調整できます。
• Stoch RSIの極端値: 直近の有効期間内で、少なくとも1本の確定足において平滑化されたKとDが同時に90/10の極端ゾーンへ入っていることを要求します。有効期間は調整でき、デフォルトでは潜在リバーサル前の2本を確認します。現在の再進入足は含めません。
潜在リバーサルの条件は足の確定時にのみ成立します。Volatility Channelは非表示でもフィルターに使われ、必要に応じてチャート上に境界を表示できます。
マーカーが意味する可能性
潜在的な反転は、大きなトレンド転換につながる場合もあれば、小さな押し戻り、既存トレンド内の一時停止、または誤ったシグナルとなってそのままトレンドが継続する場合もあります。検出しているのは、フィルターを通過したボラティリティ境界からの戻りです。その後の結果を事前に判断することはできません。
そのため、マーカーは単独のエントリー指示ではなく、チャートを詳しく確認するためのヒントとして使うのが適切です。強いトレンドに逆らうマーカーには、明確な構造水準で伸び切った後に出るマーカーよりも多くの確認が必要です。
実践的な読み方
1. BB / KCの傾きと価格位置から、現在のトレンドとボラティリティ状態を確認します。
2. BBがKCの内側で収縮しているか、外側へ拡大しているかを確認します。
3. ひし形が出たら、重要な市場構造の近くにあるかを確認し、マーカーだけで判断しないようにします。
4. プライスアクション、トレンド構造、サポートとレジスタンス、または失敗したブレイクから確認を探します。
5. ボリュームプロファイル、高・低出来高帯、重要なサポート/レジスタンスでの反応など、独立した情報を組み合わせます。
6. エントリーを検討する前に、無効化水準とリスクを定義します。
アラート
強気、弱気、またはいずれかの方向に潜在リバーサルが現れた場合のアラートを作成できます。どれも同じ足の確定条件で作動し、チャート上のマーカーを非表示にしても機能します。リアルタイムでは「Once Per Bar Close」の使用を推奨します。
重要
BBKCはチャート分析と候補抽出のためのツールです。マーカーはフィルターを通過した潜在的な反転を示すものであり、確率、保証された転換点、または完全な売買システムではありません。銘柄や時間軸によって挙動は異なります。より広いトレンド分析、市場構造、出来高、サポートとレジスタンス、適切なリスク管理と組み合わせて使用してください。
مؤشر

DNSE VN301!, Keltner Break Out Strategy"Keltner Channel Breakout with SMA Trend Filter" is a trend-following breakout strategy designed to capture strong directional price movements after volatility expansions. The strategy uses the Keltner Channel, constructed from an EMA(20) and ATR(10), to identify bullish breakouts when price closes above the upper channel and bearish breakouts when price closes below the lower channel.
To improve signal quality, the strategy incorporates an optional SMA(200) trend filter, allowing Long trades only when the SMA is rising and Short trades only when it is falling. By combining volatility-based breakout detection with long-term trend confirmation, the strategy seeks to reduce false signals during ranging markets while participating in sustained intraday trends. It also includes configurable stop loss, take profit, trading session filters, and automatic end-of-day position closure for disciplined risk management.
Strategy settings and configuration:
Chart timeframe: recommended 1-minute chart
Position size: 3 contracts
Keltner EMA length: 20
ATR length: 10
ATR multiplier: 2.0
SMA length: 200
Stop loss: 10 points
Take profit: 20 points
SMA trend filter: On / Off
Take profit: On / Off
Time filter: On / Off
Trading session: 09:00 – 14:30
Trade direction: Long / Short / Both
Default script settings:
The strategy calculates the Keltner Channel using EMA(20) and ATR(10). The upper band is calculated by adding ATR multiplied by 2.0 to EMA(20). The lower band is calculated by subtracting ATR multiplied by 2.0 from EMA(20).
When the closing price breaks above the upper Keltner band, buying pressure may be taking control. When the closing price breaks below the lower Keltner band, selling pressure may be taking control.
When the SMA(200) trend filter is enabled, the script only allows Long trades when SMA(200) is rising and only allows Short trades when SMA(200) is falling. When the SMA filter is disabled, the strategy can trade both directions based only on Keltner Channel breakout signals.
Entry and exit rules:
Long entry:
Closing price > Upper Keltner Channel band
AND SMA(200) is rising, if the SMA filter is enabled
AND the signal appears during the trading session
AND trade direction allows Long entries
Long exit:
Stop loss: 10 points from entry price
Take profit: 20 points from entry price, if enabled
Opposite breakout signal appears
Reversal when a valid Short signal appears
Automatic position close at the end of the trading session
Short entry:
Closing price < Lower Keltner Channel band
AND SMA(200) is falling, if the SMA filter is enabled
AND the signal appears during the trading session
AND trade direction allows Short entries
Short exit:
Stop loss: 10 points from entry price
Take profit: 20 points from entry price, if enabled
Opposite breakout signal appears
Reversal when a valid Long signal appears
Automatic position close at the end of the trading session
Risk disclaimer:
Futures trading involves a high level of risk and prices can move sharply. This script is provided for reference, research, and backtesting purposes only. Users should fully understand derivatives trading, their own risk tolerance, and the strategy logic before applying it to live trading.
All investment decisions are the responsibility of the user. phaisinh.online is not responsible for any losses arising from the use of this strategy in real trading. Past performance does not guarantee future results.
_____________________________________________________________________
"Keltner Channel Breakout với Bộ lọc Xu hướng SMA" là chiến lược giao dịch theo xu hướng (trend-following) được thiết kế để nắm bắt các nhịp biến động mạnh của giá sau khi thị trường mở rộng biên độ dao động. Chiến lược sử dụng Keltner Channel, được xây dựng từ EMA(20) và ATR(10), để xác định tín hiệu bứt phá tăng khi giá đóng cửa vượt lên trên dải trên và tín hiệu bứt phá giảm khi giá đóng cửa xuống dưới dải dưới của kênh.
Để nâng cao chất lượng tín hiệu, chiến lược tích hợp bộ lọc xu hướng SMA(200) (có thể bật/tắt), chỉ cho phép mở vị thế Long khi SMA đang hướng lên và vị thế Short khi SMA đang hướng xuống. Bằng cách kết hợp tín hiệu breakout dựa trên biến động với xác nhận xu hướng dài hạn, chiến lược hướng tới việc giảm các tín hiệu nhiễu trong giai đoạn thị trường đi ngang, đồng thời tận dụng hiệu quả các xu hướng mạnh trong giao dịch trong ngày. Ngoài ra, chiến lược còn hỗ trợ các tính năng quản trị rủi ro như Stop Loss, Take Profit, bộ lọc thời gian giao dịch và tự động đóng vị thế trước khi kết thúc phiên để tránh rủi ro qua đêm.
Cài đặt & cấu hình chiến lược:
Biểu đồ: khuyến nghị khung 1 phút
Khối lượng giao dịch: 3 hợp đồng
Chu kỳ EMA Keltner: 20
Chu kỳ ATR: 10
Hệ số nhân ATR: 2.0
Chu kỳ SMA: 200
Cắt lỗ: 10 điểm
Chốt lời: 20 điểm
Bộ lọc xu hướng SMA: Bật / Tắt
Dùng chốt lời: Bật / Tắt
Bộ lọc giờ: Bật / Tắt
Khung giờ giao dịch: 09:00 – 14:30
Chiều giao dịch: Mua / Bán / Cả hai
Cài đặt mặc định của script:
Chiến lược tính toán Keltner Channel dựa trên đường EMA(20) và độ biến động ATR(10). Dải trên được tính bằng EMA(20) cộng ATR nhân hệ số 2.0. Dải dưới được tính bằng EMA(20) trừ ATR nhân hệ số 2.0.
Khi giá đóng cửa vượt lên trên dải trên Keltner, lực mua có thể đang chiếm ưu thế. Khi giá đóng cửa phá xuống dưới dải dưới Keltner, lực bán có thể đang chiếm ưu thế.
Khi bật bộ lọc xu hướng SMA(200), script chỉ cho phép lệnh Mua khi SMA(200) dốc lên và chỉ cho phép lệnh Bán khi SMA(200) dốc xuống. Khi tắt bộ lọc SMA, chiến lược có thể giao dịch cả hai chiều chỉ dựa trên tín hiệu breakout của Keltner Channel.
Điều kiện vào và thoát lệnh:
Vào lệnh Mua:
Giá đóng cửa > Dải trên Keltner Channel
VÀ SMA(200) dốc lên, nếu bật bộ lọc SMA
VÀ tín hiệu xuất hiện trong khung giờ giao dịch
VÀ chiều giao dịch cho phép lệnh Mua
Thoát lệnh Mua:
Cắt lỗ: 10 điểm từ giá vào lệnh
Chốt lời: 20 điểm từ giá vào lệnh, nếu bật
Có tín hiệu breakout ngược chiều
Đảo chiều khi xuất hiện tín hiệu Bán hợp lệ
Tự động đóng lệnh khi hết khung giờ giao dịch
Vào lệnh Bán:
Giá đóng cửa < Dải dưới Keltner Channel
VÀ SMA(200) dốc xuống, nếu bật bộ lọc SMA
VÀ tín hiệu xuất hiện trong khung giờ giao dịch
VÀ chiều giao dịch cho phép lệnh Bán
Thoát lệnh Bán:
Cắt lỗ: 10 điểm từ giá vào lệnh
Chốt lời: 20 điểm từ giá vào lệnh, nếu bật
Có tín hiệu breakout ngược chiều
Đảo chiều khi xuất hiện tín hiệu Mua hợp lệ
Tự động đóng lệnh khi hết khung giờ giao dịch
Tuyên bố rủi ro:
Giao dịch hợp đồng tương lai có mức độ rủi ro cao và giá có thể biến động mạnh. Script này chỉ phục vụ mục đích tham khảo, nghiên cứu và kiểm thử. Người dùng cần hiểu rõ giao dịch phái sinh, khẩu vị rủi ro cá nhân và logic của chiến lược trước khi áp dụng vào giao dịch thực tế.
Mọi quyết định đầu tư thuộc trách nhiệm của người dùng. phaisinh.online không chịu trách nhiệm cho bất kỳ khoản lỗ nào phát sinh từ việc sử dụng chiến lược này trong giao dịch thực tế. Hiệu quả trong quá khứ không đảm bảo kết quả trong tương lai.
استراتيجية

BB Squeeze BreakoutBB Squeeze Breakout
Precision Breakout is a volatility compression and breakout indicator based on Bollinger Bands, Keltner Channels, momentum filters, volume confirmation, and ATR-based risk levels.
The goal of this tool is to help traders read when price is compressing, when volatility starts expanding again, and whether a breakout has enough confirmation to be considered stronger or weaker.
This indicator is not a trading system by itself. It is made to support chart reading and should be used together with market structure, support and resistance, liquidity zones, session context, and personal risk management.
────────────────────────────
MAIN IDEA
────────────────────────────
Markets often move through two phases:
1. Compression
Price contracts, Bollinger Bands become tighter, and the market prepares for a possible expansion.
2. Expansion
Price breaks outside the bands, volatility increases, and a directional move can start.
This script tracks those phases with:
- Bollinger Bands
- Keltner Channels
- Squeeze detection
- Bollinger Bandwidth
- %B position
- Candle quality
- RSI momentum
- Volume expansion
- OBV confirmation
- MFI confirmation
- A/D confirmation
- ADX trend strength
- MACD confirmation
- EMA trend filter
- ATR-based SL and TP levels
- A dashboard for quick reading
────────────────────────────
HOW THE SIGNALS WORK
────────────────────────────
A bullish breakout appears when price closes above the upper Bollinger Band for the required number of confirmation bars.
A bearish breakout appears when price closes below the lower Bollinger Band for the required number of confirmation bars.
The script then checks additional conditions such as candle body quality, momentum, volume, OBV slope, MACD behavior, ATR expansion, Bollinger Bandwidth expansion, and post-squeeze context.
The final signal depends on the confluence score and the selected filters.
A strong signal means that the breakout structure is present and the required confirmations are aligned.
A weak signal means that price broke outside the Bollinger Band, but the score or one of the active filters was not strong enough.
────────────────────────────
MINI TUTORIAL FOR BEGINNERS
────────────────────────────
1. Add the indicator to the chart.
2. Start with the default settings.
3. Look for a squeeze phase, where Bollinger Bands compress inside the Keltner Channel.
4. Wait for a squeeze release or a confirmed breakout outside the Bollinger Bands.
5. Check the dashboard:
- Squeeze: shows if compression is active.
- Post-SQ: shows if the market recently left a squeeze.
- BandWidth: shows if volatility is low or expanding.
- %B: shows where price is inside or outside the bands.
- SNIPER: shows the current confluence score.
- Signal: shows BUY, SELL, WEAK BUY, WEAK SELL, or WAIT.
6. If a signal appears, check if it agrees with the trend, support/resistance, and market structure.
7. Use the ATR-based Entry, SL, TP1, TP2, and TP3 levels as visual planning references.
8. Do not take a signal blindly. Always check the context before making a decision.
────────────────────────────
EXAMPLE CASES
────────────────────────────
Example 1: Bullish post-squeeze breakout
Price has been moving sideways, the Bollinger Bands are tight, and the squeeze is active. Then price closes above the upper Bollinger Band with a strong candle, rising volume, improving RSI, and expanding bandwidth. The dashboard shows a bullish score above the minimum threshold. A BUY label can appear, and the ATR risk levels show Entry, SL, TP1, TP2, and TP3.
Example 2: Bearish breakdown
Price loses support and closes below the lower Bollinger Band. RSI moves below 50, OBV weakens, MACD confirms downside pressure, and the candle closes near the low of its range. If the score and active filters agree, a SELL label can appear.
Example 3: Weak breakout
Price closes outside the Bollinger Band, but the candle is small, volume is not expanding, or momentum is weak. In this case, the script can show a WEAK signal instead of a confirmed one. This means the structure exists, but confirmation is not strong enough.
Example 4: Head fake
Price briefly breaks outside a band, then moves back inside the Bollinger structure. The script can mark this as a possible head fake. This helps identify failed breakouts, especially in choppy or low-volume markets.
Example 5: Band walk
During strong trends, price can continue moving along the upper or lower Bollinger Band. The script marks these band walk conditions to show possible trend continuation behavior.
────────────────────────────
INPUTS EXPLAINED
────────────────────────────
BOLLINGER BANDS
BB Length
Controls the moving average period used for the Bollinger Band basis. The default value is 20, which is the classic Bollinger setting.
BB StdDev
Controls the standard deviation multiplier used to build the upper and lower bands. The default value is 2.0, which is the common standard setting.
Neon Glow
Adds a visual glow effect around the Bollinger Bands.
Heat Zone
Colors the area between the Bollinger Bands depending on price position inside the band range.
────────────────────────────
KELTNER / SQUEEZE
Keltner Length
Controls the length used for the Keltner Channel calculation.
Keltner Mult
Controls the ATR multiplier used to build the Keltner Channel.
Show Keltner
Shows or hides the Keltner Channel on the chart.
Post-Squeeze Window
Defines how many bars after a squeeze release are still considered part of the post-squeeze phase.
Squeeze Ready Lookback
Looks back over a selected number of bars to detect when Bollinger Bandwidth is near a low-compression zone.
Show Squeeze Dots
Shows dots during squeeze conditions and squeeze release events.
────────────────────────────
BREAKOUT SIGNALS
Confirmation Bars
Defines how many consecutive closes outside the Bollinger Band are required before confirming a breakout.
Show BUY/SELL Labels
Shows or hides the main BUY and SELL labels.
Show Arrows
Shows or hides the arrow markers on the chart.
Show Tiny Info Labels
Shows or hides smaller labels such as weak signals and head fake warnings.
Head Fake Lookback
Controls how many bars are checked to detect a failed breakout after price moved outside a band.
Band Walk Bars
Controls how many bars are required to detect a band walk condition.
────────────────────────────
SNIPER ENGINE
Min Confluence Score
Sets the minimum score required for a confirmed signal. A higher value gives fewer signals but requires stronger confirmation.
Min Body/Range Ratio
Defines how large the candle body must be compared to the full candle range. This helps filter weak candles and dojis.
Close Must Be In Top/Bot %
For bullish candles, the close should be near the top of the range. For bearish candles, the close should be near the bottom of the range.
ATR Expansion Factor
Checks if current ATR is expanding compared to its average. This helps confirm volatility expansion.
Require Momentum Acceleration
Uses momentum behavior, mainly RSI acceleration, as part of the confirmation logic.
Require Volume Expansion
Uses volume expansion as part of the breakout quality reading.
Require BB Width Expansion
Checks if Bollinger Bandwidth is expanding during the breakout.
Anti-Wick Rejection Filter
Helps reject breakouts when the previous candle shows a strong wick against the breakout direction.
────────────────────────────
FILTERS
Use RSI Filter
Activates or disables RSI confirmation.
RSI Length
Controls the RSI calculation period.
Use OBV Filter
Activates or disables OBV confirmation.
Use Volume Spike Filter
Activates or disables volume spike confirmation.
Volume MA Length
Controls the moving average length used to compare current volume.
Volume Min x MA
Defines how much current volume must exceed the volume average.
Use MFI Filter
Activates or disables Money Flow Index confirmation.
MFI Length
Controls the MFI calculation period.
Use A/D Filter
Activates or disables Accumulation/Distribution confirmation.
Use ADX Filter
Activates or disables ADX trend strength confirmation.
ADX Length
Controls the ADX calculation period.
ADX Min
Defines the minimum ADX value required when the ADX filter is active.
Use MACD Filter
Activates or disables MACD confirmation.
Use EMA Trend Filter
Activates or disables EMA trend confirmation.
EMA Fast
Controls the fast EMA length.
EMA Slow
Controls the slow EMA length.
────────────────────────────
RISK MANAGEMENT
Show SL / TP
Shows or hides Entry, Stop Loss, and Take Profit levels.
Show SL/TP Zones
Shows or hides the colored risk and target zones.
Show SL/TP Labels
Shows or hides the Entry, SL, TP1, TP2, and TP3 labels.
SL ATR x
Controls the ATR multiplier used to calculate the Stop Loss distance.
TP1 ATR x
Controls the ATR multiplier used to calculate the first Take Profit level.
TP2 ATR x
Controls the ATR multiplier used to calculate the second Take Profit level.
TP3 ATR x
Controls the ATR multiplier used to calculate the third Take Profit level.
Enable TP3
Shows or hides the third Take Profit level.
RM Label Offset Bars
Moves the risk management labels slightly to the right of the current price area. The labels and zones update automatically as new candles appear.
────────────────────────────
DASHBOARD
Show Dashboard
Shows or hides the dashboard panel.
Position
Moves the dashboard to the selected chart corner.
High Contrast Panel
Makes the dashboard easier to read with stronger background contrast.
────────────────────────────
VISUAL ELEMENTS
────────────────────────────
The indicator can display:
- Bollinger Bands
- Bollinger glow effect
- Heat zone between bands
- Keltner Channels
- Squeeze dots
- Squeeze release dots
- BUY and SELL labels
- Weak breakout labels
- Head fake labels
- Band walk markers
- ATR-based Entry, SL, TP1, TP2, TP3 levels
- Colored risk and target zones
- A dashboard with market state information
────────────────────────────
IMPORTANT NOTES
────────────────────────────
This script is an indicator, not a strategy.
It does not place trades.
It does not guarantee profitable results.
It does not predict the future.
Signals can fail in ranging, low-liquidity, high-spread, or news-driven market conditions.
Users should test the indicator on their own symbols, timeframes, and trading style before using it in live market decisions.
Risk management remains the responsibility of the user. مؤشر

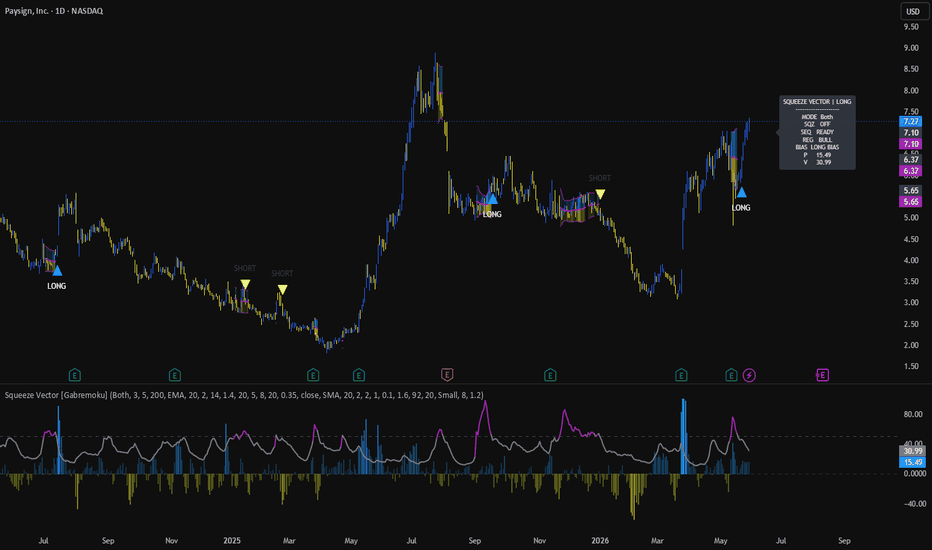
Squeeze Vector [Gabremoku]Squeeze Vector is a squeeze-based volatility breakout tool that combines Bollinger/Keltner compression detection, directional pressure flow, and a first-expansion state machine to help traders identify high-probability post-squeeze breakout setups.
The core idea is simple: compression precedes expansion. When Bollinger Bands shrink inside Keltner Channels, the market is coiling — and when that squeeze releases, the first directional signal can carry strong momentum. This script gives that process a structured visual and logical framework.
Core Concept — Squeeze → Release → Direction
A BB/KC squeeze occurs when Bollinger Bands, which reflect price volatility through standard deviation, contract inside Keltner Channels, which reflect typical range through ATR. This gap between the two envelopes is used as a proxy for volatility compression.
When BB width becomes smaller than KC width, the script identifies a Squeeze state. When it releases, the script enters an Armed state and opens a short post-squeeze window during which it looks for the first valid directional expansion.
Importantly, the squeeze release alone does not confirm direction. That is why the script adds multiple expansion confirmation filters before triggering a signal.
What it shows
Squeeze Vector Oscillator — a single line that rises as BB/KC compression increases. When it crosses above 50, the squeeze is active. The oscillator turns purple during squeeze states for fast visual identification.
Pressure Flow Histogram — a volume-weighted directional pressure value that reads where price closed within the candle range and weights it by volume relative to its moving average. Positive values indicate bullish pressure, negative values indicate bearish pressure.
Bollinger Overlay on Price — during squeeze states, the script renders Bollinger Bands directly on the main chart with gradient fills, making it easy to see where price is relative to the compressed structure.
LONG / SHORT signals — primary directional signals are placed on the main chart after a post-squeeze expansion bar meets all required conditions. Optional lighter repeat markers can be shown for follow-through confirmation.
Dashboard with live checklist — the on-chart dashboard shows the current state, regime, pressure, vector value, and a 6-point checklist for both long and short setups, with filled/empty circles to show how many conditions are currently met.
Signal Logic
The signal engine works as a state machine with three phases:
Squeeze — BB/KC compression is active. No signal is generated. The dashboard shows SQUEEZE.
Armed — the squeeze just released. The script opens a short expansion window and waits for directional confirmation. The dashboard shows ARMED.
Expansion signal — within the expansion window, if a valid directional bar forms with sufficient pressure, body size, and break condition, a LONG or SHORT label is placed on the main chart.
Signal direction is confirmed by checking:
Basis side: price above or below the BB basis
Pressure: smoothed directional pressure above threshold
Strong pressure: optional stronger filter
Body quality: minimum body-to-candle-range ratio
Break condition: higher high or lower low
Regime: optional EMA 200 trend filter
When both long and short conditions are simultaneously valid, the stronger pressure side wins. If pressure is equal, raw pressure bias decides.
States and Dashboard
The dashboard tracks the full machine at a glance:
Row Content
SQZ Squeeze ON / OFF
SEQ ARMED or READY
REG Trend regime (BULL / BEAR / OFF)
BIAS Current directional pressure bias
P Pressure Flow value
V Vector Oscillator value
Checklist 6-point LONG and SHORT condition matrix
The checklist can be set to appear only during Squeeze or Armed states to reduce visual noise when no setup is forming.
Features
✅ Bollinger/Keltner squeeze detection via ratio oscillator
✅ Volume-weighted directional pressure flow
✅ Post-squeeze first expansion state machine
✅ Armed → signal transition logic
✅ 6-point entry checklist for both long and short
✅ EMA 200 regime filter
✅ Bollinger overlay with gradient fill during squeeze
✅ LONG / SHORT signal labels on main chart
✅ Optional follow-through repeat markers
✅ Repeat window filter to suppress signal clustering
✅ Strategy mode: Long, Short, or Both
✅ Fully configurable dashboard with size and offset settings
✅ Alert conditions for BUY, SELL, and squeeze activation
How to use
A practical workflow:
Watch for the Vector Oscillator to cross above 50 and turn purple — that is the squeeze state.
When it releases below 50, the dashboard switches to ARMED.
In the expansion window, check the checklist: more filled circles on one side indicate stronger directional alignment.
A LONG or SHORT label confirms a valid first expansion signal.
Use the Pressure Flow histogram to gauge how strong and consistent the directional push is.
The squeeze release alone is not a signal. Direction is only confirmed when the expansion bar quality, pressure, and structure checks all align.
Notes
Like all squeeze-based tools, Squeeze Vector is most effective when used alongside price structure context. Squeezes release into strong moves, but not every release produces a sustained trend — volume, higher timeframe context, and support/resistance levels can all affect follow-through quality.
Author: Gabremoku
Pine Script v6 مؤشر
Keltner Squeeze Release Planner [AGPro Series]# Keltner Squeeze Release Planner
🧠 Core Idea
Is volatility compression turning into a clean Keltner Channel release, or is price still trapped inside the squeeze?
📌 Overview / What it does
Keltner Squeeze Release Planner is a volatility compression and expansion decision-support script built around Keltner Channels.
The script detects compressed Keltner width, evaluates whether price releases beyond the channel with enough expansion quality, scores the release from 0 to 100, and maps an expansion corridor with target rails and failure context.
It does not predict price direction, automate trading, or provide guaranteed signals. It organizes squeeze, release quality, volatility rank, direction bias, and action state into a cleaner workflow.
🎯 Purpose & Design Philosophy
Many traders can see a breakout after it happens, but the difficult part is separating real volatility expansion from a weak push outside the channel.
This script was built for traders who want a structured way to read Keltner squeeze behavior, release strength, and early failure risk.
The design supports patience during compression and cleaner observation when price finally leaves the channel.
⚡ Why This Script Is Different
Most Keltner tools draw the channel and leave interpretation to the user.
This script does NOT treat every channel break as meaningful.
Instead, it evaluates compression depth, expansion ratio, close pressure, candle body quality, relative volume, and basis slope before marking a release as READY.
⚙️ Methodology
1. Keltner Channel Mapping
2. Compression Detection
3. Release Edge Evaluation
4. Expansion Quality Scoring
5. Corridor And Failure Mapping
6. Panel And Alert Output
🗺️ How to Read the Chart
The Keltner Channel shows the active volatility envelope around price.
Compression shading marks periods where channel width is low relative to recent history.
BULL RELEASE and BEAR RELEASE labels appear when price leaves the channel with enough release quality.
The release corridor projects possible expansion space after a qualified release.
The panel summarizes Squeeze, Release Score, Volatility, Direction Bias, and Action.
🚦 Signals & States
• READY → A qualified Keltner squeeze release has formed.
• MONITOR → A release context is active and should be observed.
• WAIT → Compression may exist, but release quality is not confirmed.
• INVALIDATED → A release failed back into the channel context.
• BLOCKED → The script cannot define a valid Keltner context.
🔔 Alerts Logic
Bullish Keltner Squeeze Release Ready triggers when price releases above the upper Keltner Channel after compression with enough score quality.
Bearish Keltner Squeeze Release Ready triggers when price releases below the lower Keltner Channel after compression with enough score quality.
Keltner Compression Active triggers when channel width is low enough to qualify as squeeze context.
Keltner Squeeze Release Failed triggers when an active release loses quality and moves back into the failure area.
Alerts are attention markers, not trade instructions.
🧩 Confluence Logic
The release score combines compression depth, expansion ratio, close pressure beyond the channel, candle body quality, relative volume, and basis slope.
When these conditions align, the release context becomes stronger.
📊 When to Use
• Markets moving from low volatility to expansion
• Breakout environments
• Consolidation-to-trend transitions
• Intraday or swing contexts where volatility contraction matters
⚠️ When NOT to Use
• Extremely illiquid symbols
• Random high-noise chop
• News spikes with unstable spreads
• Symbols where Keltner width is distorted by abnormal candles
🎛️ Key Inputs
• Keltner Basis Length → controls the EMA basis of the channel.
• ATR Length → controls channel width and volatility normalization.
• Keltner ATR Multiplier → adjusts how wide the channel is.
• Squeeze Threshold → defines how deep compression must be.
• Minimum Ready Score → controls how selective READY releases are.
• Projection Bars → controls how far the corridor extends.
• Visual settings → control labels, channels, zones, panel, and chart density.
🖥️ Interface & Visual Design
The script uses a compact AG Pro panel to make the current state readable at a glance.
The visual hierarchy is designed to keep the chart clean: channel context first, release label second, corridor and targets third.
Default settings are tuned for readable publication screenshots without hiding the core volatility story.
🧪 Practical Usage Workflow
1. Read the panel state.
2. Check whether compression is active.
3. Wait for a qualified release label.
4. Review the corridor and target rails.
5. Watch whether price holds or fails back into the channel.
🔍 Interpretation Guidelines
A READY release means volatility expansion conditions aligned according to the script rules.
It does not mean price must continue.
A weak or failed release means the channel break lost quality and should be interpreted within broader market context.
🚫 What This Script Is NOT
This script is not a prediction engine.
It is not a buy or sell signal generator.
It is not an automated trading system.
It does not guarantee breakouts, continuation, or reversals.
⚠️ Limitations & Transparency
Keltner behavior can change across symbols, sessions, and timeframes.
Compression may last longer than expected.
Strong news events can create release signals that behave differently from normal volatility expansion.
The script should be used with broader structure, liquidity, and risk context.
🧠 Market Context Notes
Keltner squeeze behavior is most useful when volatility has contracted enough to create a visible transition point.
The best contexts often combine compression, clean channel release, participation, and enough room for expansion.
🧾 Use Case Examples
When price compresses inside the Keltner Channel and then closes beyond the upper band with strong expansion, the script may mark a bullish release.
When price breaks below the lower band after compression and the release score is strong enough, the script may mark a bearish release.
When price breaks out but quickly moves back into the channel, the release can lose quality.
🧱 System Philosophy
This script is part of the AGPro Series approach: clean visual context, practical scoring, and decision-support states instead of noisy prediction labels.
🔐 Non-Promise Statement
No script can provide certainty.
No signal should be treated as guaranteed.
All outputs are rule-based analytical markers.
📉 Risk Disclosure
Trading involves risk.
Users are responsible for their own decisions, risk management, and position sizing.
This script is for educational and analytical purposes only and does not provide financial advice.
📚 Educational Note
The purpose of this script is to help users study volatility compression and release behavior through a structured Keltner Channel framework.
مؤشر

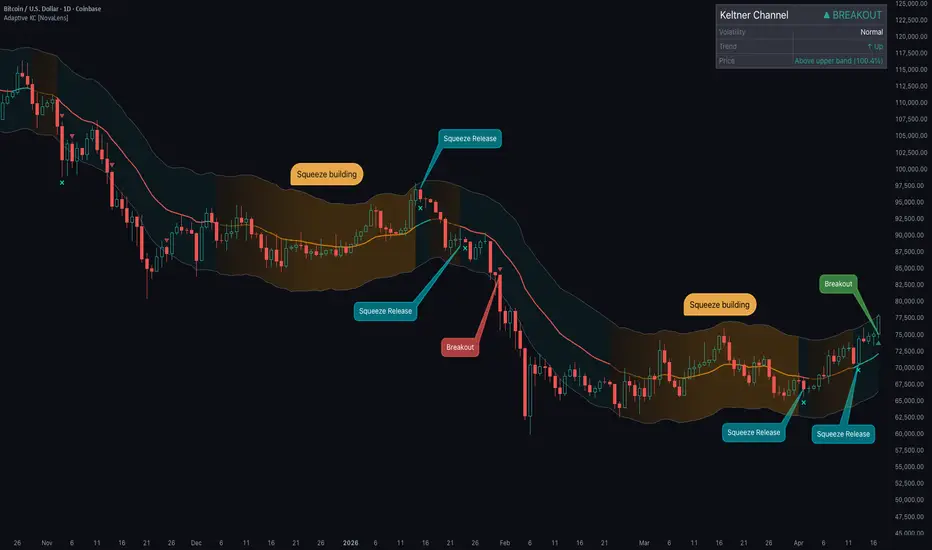
Adaptive Keltner Channel [NovaLens]Adaptive Keltner Channel detects when price is doing something exceptional versus simply moving within its expected range. It wraps price in ATR-based bands around an EMA center, optionally adjusts band width to the current volatility regime, and includes built-in squeeze detection and context-aware center reclaim signals.
════════════════════════════════════════════
◉ HOW IT WORKS
The indicator builds on the Keltner Channel concept introduced by Chester Keltner (1960) and refined into the modern ATR-based variant by Linda Bradford Raschke:
Center line : EMA of close
Upper band : Center + multiplier x ATR
Lower band : Center - multiplier x ATR
In static mode, the multiplier is fixed:
Upper = EMA(Close, Length) + Multiplier x ATR
Lower = EMA(Close, Length) - Multiplier x ATR
In adaptive mode, the multiplier scales with the current ATR percentile rank. When ATR is low relative to recent history, the channel widens to filter routine noise. When ATR is already elevated, the channel tightens so a band break still represents a genuine expansion rather than getting absorbed inside an overly wide envelope.
This is the opposite of how Bollinger Bands behave. Bollinger Bands widen mechanically as volatility rises because they use standard deviation. The adaptive Keltner deliberately tightens its multiplier in high-vol regimes to preserve the usefulness of a breakout signal across different conditions.
The script also includes squeeze detection: when Bollinger Bands contract inside the Keltner Channel, it flags that volatility has compressed. Compressed conditions can precede larger-than-normal moves, though the squeeze does not indicate which direction or guarantee that the expansion will follow through.
════════════════════════════════════════════
◈ HOW TO READ IT
Band interactions:
Price above upper band: upside expansion beyond the recent channel range
Price below lower band: downside expansion beyond the recent channel range
Center reclaims and losses:
Price reclaims center after a lower-band touch: downside extension did not hold
Price loses center after an upper-band touch: upside extension did not hold
These are not simple center crosses. The indicator tracks which band was touched most recently and only fires a reclaim or loss signal when that context is present. A center cross after sideways consolidation is a different event from a center cross following a failed band extension. This logic filters out a significant amount of the noise that makes naive center-cross signals unreliable.
Squeeze and trend:
Orange fill and center color: squeeze is active, volatility compressed
Squeeze intensity builds visually as the compression persists
Green center line: short-term trend pressure is up
Red center line: short-term trend pressure is down
Teal X-cross marker below bar: squeeze just released
The outer bands are intentionally neutral gray. Direction comes from price behavior, center slope, and the interaction signals.
════════════════════════════════════════════
✦ HOW WE USE IT: VOLATILITY CONTEXT
We use this channel as a volatility context layer rather than a standalone signal source. The question it answers: is the current price behavior routine or exceptional for this market's recent history?
When the channel is in squeeze state and the info panel reads "Compressed" with the bar count climbing, that is a low-conviction environment for new directional entries but a high-attention environment for preparation. On BTC 4H with Balanced settings, in our observation squeeze conditions often persist for 8-15 bars while the fill gradually deepens to orange. During that window, we are watching, not acting.
When the squeeze releases and price pushes through a band with the center slope already confirming, that combination (squeeze release, band break, center slope alignment) carries more weight than a random band break during an already-volatile session. No single element alone is the trigger.
On the reversion side, when price flushes to the lower band and then reclaims the center, the state-aware logic recognizes that the last band touched was the lower band. It treats that center cross as a meaningful reclaim rather than noise. This matters because price often consolidates between a band touch and the center for several bars. A naive center-cross indicator would miss the connection. This one remembers.
The practical workflow: use the channel to characterize whether price is inside its expected range, expanding beyond it, or compressed. Layer your directional signals on top of that context.
════════════════════════════════════════════
✦ OTHER APPLICATIONS
Breakout context : band breaks after compression, confirmed by center slope and price acceptance on subsequent bars
Mean reversion : in sideways conditions, band touches can frame moves back toward the center, especially when the center line is flat rather than sloped
Trend pullbacks : the center line as a dynamic support/resistance during directional moves
Risk management : use the center or opposite band as a trailing reference that adapts to current volatility
Alert-driven workflow : set alerts on squeeze start, squeeze release, breakout up/down, or center reclaim/loss and check the chart only when conditions change
════════════════════════════════════════════
⚙ GETTING STARTED
Adaptive Keltner Channel ships with reactivity presets:
Reactive : EMA 10 / Mult 1.5 / ATR 10. Tighter bands that respond quickly. Useful when you want the channel to track recent behavior more closely.
Balanced : EMA 20 / Mult 2.0 / ATR 14. The default. A reasonable starting point for most assets. Start here unless you have a specific reason not to.
Smooth : EMA 50 / Mult 2.5 / ATR 20. Wider and calmer. Useful on higher timeframes or when you want the channel to only flag larger-scale events.
Custom : Full manual control for specific setups.
Core settings:
Reactivity : selects the behavior profile. Start with Balanced.
Adaptive Band Width : on = regime-aware scaling, off = classic static Keltner. The difference is most visible when the market transitions between calm and volatile periods.
Adaptive Lookback : how far back ATR is ranked. 100 bars covers roughly 5 months on daily, 4 days on 1H. Increase for assets with long volatility cycles. Decrease for assets that shift regimes quickly.
Adaptive tuning:
Adaptive Max Multiplier (calm) : scales your base multiplier up in quiet conditions. Default 1.25 means the effective multiplier becomes 25% wider than the base (e.g., base 2.0 becomes 2.5). Increase if you are seeing too many false band touches during low-vol periods.
Adaptive Min Multiplier (vol) : scales your base multiplier down in volatile conditions. Default 0.75 means the effective multiplier becomes 25% narrower than the base (e.g., base 2.0 becomes 1.5). Decrease if breakouts are still not clearing the bands during high-vol sessions.
Squeeze settings:
Show Squeeze Detection : enables Bollinger-inside-Keltner squeeze logic
BB Length / BB Multiplier : default 20/2.0 matches standard Bollinger. Generally no reason to change unless comparing against a non-standard Bollinger on the same chart.
Display:
Show Info Panel : 4-row panel showing current state, volatility, trend direction, and price location as a channel percentage. Hover any label for a plain-English explanation.
Show Squeeze Background : subtle background tint during active squeezes. Off by default.
Light Theme Mode : adapts panel colors for light backgrounds.
════════════════════════════════════════════
△ LIMITATIONS
Lagging structure : the center is an EMA and the bands use historical ATR. Sharp reversals can outrun the channel. This is inherent to any channel overlay.
Squeeze is not directional : a squeeze tells you volatility has contracted, not which way the next move goes. The release can fail, reverse, or stall.
False band breaks : in noisy conditions, price can poke through a band and return inside on the next bar. Adaptive scaling is designed to help with this, but does not eliminate it.
Mean-reversion risk in trends : using center reclaims as reversion entries during a strong trend can stay wrong longer than expected. The center keeps moving with the trend.
History requirement : adaptive scaling needs enough bars to fill the Adaptive Lookback window (default 100 bars) before it adjusts properly. Squeeze detection also needs sufficient Bollinger and Keltner history. Early bars on any chart will have less reliable readings.
════════════════════════════════════════════
🔔 ALERTS
Six alert conditions are built in so you can monitor without watching the chart:
Breakout Up / Breakout Down : price closes beyond the upper or lower band
Squeeze Started : Bollinger Bands have contracted inside the Keltner Channel
Squeeze Released : squeeze just ended, volatility expanding
Center Reclaim : price crossed above the center after previously touching the lower band
Center Loss : price crossed below the center after previously touching the upper band
All alerts fire on bar close by default for confirmed signals.
════════════════════════════════════════════
⌁ NOTES
Original concept by Chester Keltner (1960), modern ATR-based variant by Linda Bradford Raschke
Uses ATR-based bands with optional volatility-regime adaptation via percentile ranking
Includes Bollinger-inside-Keltner squeeze detection with visual intensity buildup
Center reclaim/loss signals use state-aware logic that tracks which band was last touched
Values update in real time on the current bar and are confirmed at bar close
Open-source: inspect the logic directly in the Pine editor
مؤشر

استراتيجية

[ A L P H A X ] Bollinger/Keltner Volatility Pressure SystemAlphaX Volatility Pressure System — Bollinger/Keltner Squeeze Detection, Linear Regression Forecast, Multi-Confluence Band Touch Signals, Volatility Regime Classification & Institutional Dashboard
AlphaX Volatility Pressure System (VPS) is a professional-grade volatility analysis and signal system built on the interaction between Bollinger Bands and Keltner Channels — the foundation of squeeze-based trading. It combines a proprietary multi-layer squeeze engine, linear regression band forecasting, a six-factor confluence scoring system, and a comprehensive real-time dashboard into a single cohesive overlay. Designed and default-tuned for XAUUSD (Gold) on the 1-minute timeframe, fully adaptable to any instrument or timeframe.
━━━━━━━━━━━━━━━━━━━━━━━━━━━━━━━━━━━━━━━━
📸 Visual Overview
The indicator displays Bollinger Bands as a gradient cloud, Keltner Channel boundaries as dotted lines, squeeze status dots on the basis line, a projected forecast envelope extending into the future, confidence-scored entry signals at band touches, mean reversion exit markers, and a full diagnostic dashboard — all in a clean, non-cluttered layout with a consistent yellow-green / red / gray color theme.
━━━━━━━━━━━━━━━━━━━━━━━━━━━━━━━━━━━━━━━━
🔬 The Volatility Pressure Architecture — How It Works
At the core of AlphaX VPS is the principle that volatility is cyclical — periods of compression (low volatility) are followed by periods of expansion (high volatility), and vice versa. The system detects exactly where you are in this cycle and provides actionable intelligence at every stage.
The system operates through seven integrated layers:
Layer 1 — Bollinger Bands (Volatility Envelope)
A Simple Moving Average (SMA) basis line with standard deviation bands above and below
Default: 30-period SMA with 2.2x multiplier — tuned for gold's micro-noise on 1-minute charts
The bands expand during volatile moves and contract during consolidation
Price touching or piercing the outer bands represents statistical extremes — potential reversal zones
The space between upper and lower bands is rendered as a gradient cloud that shifts color based on price position relative to the basis — yellow-green when price is above basis (bullish pressure), red when below (bearish pressure)
Layer 2 — Keltner Channels (ATR Volatility Wrapper)
An Exponential Moving Average (EMA) center line with Average True Range (ATR) bands
Default: 30-period EMA with 1.8x ATR multiplier using 20-period ATR — calibrated for gold
Keltner Channels represent the "normal" volatility range based on true range, while Bollinger Bands represent statistical deviation — the relationship between them reveals compression and expansion states
Plotted as subtle dotted lines at the channel boundaries for clean visual reference without chart clutter
Layer 3 — Squeeze Engine
Squeeze ON — detected when Bollinger Bands contract inside the Keltner Channel (BB upper < KC upper AND BB lower > KC lower). This means volatility has compressed below normal levels — a spring is being loaded
Squeeze Release — the first bar where BB breaks back outside KC after a squeeze period. This is the explosive moment where the compressed energy releases into a directional move
Squeeze status is displayed as colored dots on the BB basis line: red dots during active squeeze, yellow-green dots on squeeze release, gray dots during normal conditions
Squeeze Momentum — a John Carter-style linear regression calculation determines the direction of the squeeze release: bullish momentum (price likely to break upward) or bearish momentum (price likely to break downward)
Squeeze release events generate flash markers on the chart: "⚡ SQ↑" for bullish releases, "⚡ SQ↓" for bearish releases
The dashboard tracks how many of the last 20 bars were in squeeze state — prolonged squeezes (12+ bars) tend to produce the most explosive releases
Layer 4 — Linear Regression Forecast
A forward-looking projection of the Bollinger Band envelope using linear regression slopes
The system calculates the current slope of both the BB basis and the BB deviation, then projects them forward by the configured number of bars (default: 20 bars = 20 minutes on 1-minute chart)
The projection is smoothed using a weighted blend from current values to forecasted values, preventing jarring visual jumps
Displayed as a projected envelope with upper, basis, and lower forecast lines, plus a filled forecast cloud
Forecast color reflects projected direction: yellow-green if the basis is projected to rise, red if projected to fall
Price labels at the forecast endpoints show the projected upper and lower band values — giving you concrete target levels
A minimum bandwidth floor prevents the forecast from collapsing to zero during extreme compression
Layer 5 — Trend EMA
A 100-period Exponential Moving Average provides macro trend context
Color-coded: yellow-green when price is above (bullish structure), red when below (bearish structure)
The EMA slope direction (rising vs. falling over 3 bars) is factored into the confluence scoring system
Acts as a structural filter — signals aligned with the EMA trend receive bonus confidence, signals against it receive penalties
Layer 6 — RSI Filter
A 14-period Relative Strength Index provides momentum confirmation
Oversold threshold at 30, overbought at 70 — stricter than typical settings to filter gold noise
RSI must be in a supportive zone for signals to fire: below 45 for bullish signals, above 55 for bearish signals
Deeply oversold or overbought RSI readings contribute up to 15 points to the confluence score
Layer 7 — Volatility Regime Classification
The system continuously classifies the current market state into one of five regimes:
SQUEEZE 🔴 — BB inside KC, volatility compressed, spring loading
RELEASE ⚡ — first bar after squeeze ends, explosive move initiating
EXPANSION 📈 — bandwidth increasing and price trending directionally
COMPRESSION — bandwidth decreasing, volatility contracting
RANGING — no clear volatility trend, sideways movement
The current regime is displayed prominently in the dashboard and influences signal generation — signals during active squeeze are blocked entirely
━━━━━━━━━━━━━━━━━━━━━━━━━━━━━━━━━━━━━━━━
📊 Signal System — Band Touch Signals
AlphaX VPS generates two types of chart signals: Entry Signals at band extremes and Exit Markers at mean reversion.
Entry Signals ( ⬆ / ⬇ )
Entry signals appear when price touches or pierces a Bollinger Band while multiple confluence factors align to confirm a high-probability reversal setup.
Bullish Entry (⬆) — a yellow-green label below the bar indicating a potential long opportunity:
Price touches or pierces the lower Bollinger Band
Confluence score meets the minimum confidence threshold (default: 60%)
RSI is below 45 (supportive of oversold bounce)
Volume is above average (institutional participation confirmed)
A swing low structure is present near the band (not just a random wick)
Candle shows bullish rejection — either a bullish close or a long lower wick (>50% of candle range)
Market is NOT in active squeeze (signals blocked during compression)
Cooldown period has elapsed since last bullish signal (default: 15 bars)
Bearish Entry (⬇) — a red label above the bar indicating a potential short opportunity:
Price touches or pierces the upper Bollinger Band
Confluence score meets the minimum confidence threshold
RSI is above 55 (supportive of overbought reversal)
Volume is above average
A swing high structure is present near the band
Candle shows bearish rejection — either a bearish close or a long upper wick
Market is NOT in active squeeze
Cooldown period has elapsed since last bearish signal
Each signal label displays the tier rating and confidence percentage :
S-Tier (80%+) — exceptional setup, maximum confluence — highest probability
A-Tier (70–79%) — strong setup, most factors aligned
B-Tier (60–69%) — decent setup, adequate confluence for a trade with proper risk management
Signals below B-Tier are automatically filtered out and never displayed.
━━━━━━━━━━━━━━━━━━━━━━━━━━━━━━━━━━━━━━━━
Exit Markers ( ✕ )
After an entry signal fires, the system tracks position direction and monitors for mean reversion to the BB basis line :
Long Exit ✕ — appears when price crosses back above the BB basis after a bullish entry, indicating the mean reversion target has been reached
Short Exit ✕ — appears when price crosses back below the BB basis after a bearish entry, indicating the mean reversion target has been reached
Exit markers serve as profit-taking signals — the statistical edge of a band touch trade is the reversion to the mean (basis line). Once price reaches the basis:
Take partial or full profit
Tighten stop loss to breakeven
Wait for the next band touch signal before re-entering
━━━━━━━━━━━━━━━━━━━━━━━━━━━━━━━━━━━━━━━━
🧠 Multi-Confluence Confidence Scoring System
Every entry signal is evaluated by a real-time scoring engine that produces a confidence percentage from 0% to 100%. This is not a simple threshold check — it is a weighted multi-factor assessment that rewards alignment and penalizes contradiction.
Scoring Factors — Bullish Signals:
Band Touch Quality (up to 20 points)
How deeply price pierced the lower Bollinger Band
Pierce depth >5% of band width = 20 points (strong penetration)
Any pierce = 15 points
Near-touch (within 0.1%) = 10 points
%B Position (up to 10 points)
Bollinger %B measures where price sits within the band range (0 = lower band, 1 = upper band)
%B below 0 (outside lower band) = 10 points
%B below 0.05 = 8 points
%B below 0.15 = 5 points
RSI Depth (up to 15 points)
RSI below 20 = 15 points (deeply oversold)
RSI below 25 = 12 points
RSI below 30 = 10 points
RSI below 40 = 3 points
EMA Trend Alignment (up to 10 points)
Price above 100 EMA AND EMA slope rising = 10 points (full alignment)
Price above 100 EMA only = 5 points
Squeeze Release Confluence (up to 10 points)
Squeeze just released with bullish momentum = 10 points (explosive setup)
Bullish squeeze momentum without active squeeze = 5 points
Candle Rejection Pattern (up to 10 points)
Long lower wick (>50% of range) + bullish close = 10 points (textbook rejection)
Long lower wick only = 7 points
Bullish close only = 3 points
Volume Confirmation (up to 10 points)
Above-average volume + bullish close = 10 points (institutional buying)
Above-average volume only = 5 points
MACD Momentum (up to 8 points)
MACD line above signal line OR histogram rising for 2+ bars = 8 points
200 SMA Structure (up to 7 points)
Price above 200 SMA = 7 points (macro trend support)
Penalty Deductions:
Price BELOW EMA trend = -15 points (counter-trend signal)
RSI above 55 = -12 points (momentum doesn't support reversal)
Active squeeze = -8 points (wait for release)
Expanding but directionless = -5 points
No volume spike when volume filter enabled = -5 points
Bearish candle rejection present = -10 points (wrong candle structure)
The same structure applies to bearish signals with inverted logic — upper band touch, overbought RSI, price below EMA, bearish rejection candles, etc.
━━━━━━━━━━━━━━━━━━━━━━━━━━━━━━━━━━━━━━━━
🛡 Signal Quality Gates — Why This Indicator Produces Clean Signals
Beyond the confidence score, every signal must pass through six independent quality gates before it can appear on the chart. If any single gate fails, the signal is blocked entirely — regardless of the confidence score:
Gate 1 — Band Touch Gate
Price must actually reach or pierce the Bollinger Band (within 0.1%)
Signals near the middle of the bands are impossible — only statistical extremes qualify
Gate 2 — RSI Zone Gate
Bullish signals require RSI below 45
Bearish signals require RSI above 55
This prevents signals when momentum is neutral or contradictory
Gate 3 — Volume Gate
Volume must exceed the 20-period volume moving average multiplied by 1.2x
Low-volume band touches are often noise — this gate requires institutional participation
Can be toggled off for instruments with unreliable volume data
Gate 4 — Swing Structure Gate
A swing low must be present within the last 3 bars for bullish signals (price formed a local bottom)
A swing high must be present within the last 3 bars for bearish signals (price formed a local top)
This prevents signals on through-band breakdowns where price is accelerating through the band, not bouncing off it
Can be toggled off for faster signal generation
Gate 5 — Candle Confirmation Gate
Bullish signals require either a bullish candle close (close > open) or a bullish rejection wick (lower wick > 50% of total range)
Bearish signals require either a bearish candle close or a bearish rejection wick
This confirms that price is actually rejecting the band level, not just touching it on the way through
Gate 6 — Squeeze Block Gate
No signals fire during active squeeze (BB inside KC)
During squeeze, volatility is compressed and band touches are unreliable — the bands themselves are artificially narrow
Signals resume after squeeze releases
Gate 7 — Cooldown Gate
A minimum of 15 bars (15 minutes on 1-minute chart) must elapse between signals of the same direction
Prevents signal spam during choppy band-walking conditions
This seven-gate architecture is why AlphaX VPS produces significantly fewer but higher-quality signals compared to basic Bollinger Band indicators.
━━━━━━━━━━━━━━━━━━━━━━━━━━━━━━━━━━━━━━━━
⚠ Identifying Choppy / Ranging Markets — When NOT to Trade
Knowing when to stay out is just as important as knowing when to enter. AlphaX VPS provides multiple visual cues for choppy, range-bound conditions:
How to identify choppy conditions:
BB Cloud is extremely narrow — when the Bollinger Bands contract tightly, the cloud between upper and lower bands becomes paper-thin. Narrow bands = low volatility = no clean directional moves.
Squeeze dots are RED for extended periods — prolonged red dots on the basis line mean BB is trapped inside KC. While this predicts an eventual explosive move, trading during the squeeze is a losing strategy. Wait for the yellow-green release dot.
Forecast cloud is flat and narrow — if the projected envelope shows no significant expansion or directional slope, the system expects continued compression. No expansion forecast = no trade.
Regime dashboard shows "COMPRESSION" or "RANGING" — the volatility regime classifier explicitly tells you the current state. These regimes have the lowest signal quality.
No signals appearing despite price touching bands — this means the quality gates are doing their job. If you see band touches but no labels, the confluence score is too low or a gate is blocking. Trust the filter.
EMA (100) is flat and price is oscillating around it — no trend, no edge.
Basis distance in dashboard shows very small percentage — price is hugging the basis line, meaning there is no stretched rubber band to snap back. Mean reversion trades need extension first.
What to do during choppy markets:
Do not force trades — wait for squeeze release (yellow-green dot + ⚡ marker)
Watch for the forecast cloud to start expanding and tilting directionally
Monitor the regime dashboard — wait for "RELEASE ⚡" or "EXPANSION 📈" to appear
Consider moving to a higher timeframe where structure may be clearer
Use the squeeze bar counter in the dashboard — once squeeze bars reach 12+/20, the release is likely imminent
━━━━━━━━━━━━━━━━━━━━━━━━━━━━━━━━━━━━━━━━
🚀 How to Trade with AlphaX VPS — Step by Step
Step 1 — Assess Market Regime
Check the dashboard REGIME field: Is it EXPANSION, COMPRESSION, SQUEEZE, or RANGING?
Check the Bollinger Band cloud width: Is it expanded or collapsed?
Check squeeze dots: Red = stay out. Gray = normal. Yellow-green = just released.
If the regime is SQUEEZE or COMPRESSION → do not trade. Wait for RELEASE or EXPANSION.
Step 2 — Monitor the Forecast
Look at the projected envelope ahead of current price
Is the forecast expanding or narrowing? What direction is the basis slope?
A widening forecast with a clear directional slope tells you where the bands are heading
The forecast upper and lower price labels give you concrete projected targets
Step 3 — Wait for a Band Touch Signal
Do not chase price in the middle of the bands — wait for price to reach an extreme
A ⬆ or ⬇ label will appear only when all seven quality gates pass and the confidence score meets your threshold
The label shows the tier (S/A/B) and exact confidence percentage — use this to size your position (higher confidence = larger size)
Step 4 — Enter the Trade
Enter on the signal bar's close (signals are confirmed on bar close, non-repainting)
Place your stop loss beyond the Bollinger Band that was touched (for bullish: below the lower band, for bearish: above the upper band)
Your profit target is the BB basis line (mean reversion target) — the system will mark this with a ✕ when reached
Step 5 — Manage and Exit
Watch for the ✕ exit marker — this appears when price crosses back to the BB basis
Take partial or full profit at the basis line
If price continues past the basis toward the opposite band, you can trail your stop using the basis line as your new stop level
If a new signal appears in the same direction before the exit triggers, it can be used to add to the position
Step 6 — Squeeze Release Trades (Advanced)
When you see the "⚡ SQ↑" or "⚡ SQ↓" release marker, this is a momentum breakout setup
The squeeze release direction (bull/bear) is determined by the squeeze momentum calculation
Enter in the direction of the release
These moves tend to be explosive — use wider stops and larger targets than mean reversion trades
The forecast projection will often show an expanding envelope in the direction of the release — use the forecast band endpoints as extended targets
━━━━━━━━━━━━━━━━━━━━━━━━━━━━━━━━━━━━━━━━
📋 Real-Time Dashboard — Complete Market Intelligence
The dashboard provides a comprehensive snapshot of every metric the system monitors, organized into five sections:
─── VOLATILITY ───
REGIME — Current volatility state (Squeeze / Release / Expansion / Compression / Ranging) with color-coded background
BANDWIDTH — Current BB width as percentage of basis, colored relative to its 50-period average (narrow = green/opportunity, wide = red/extended)
BB %B — Where price sits within the bands (0% = lower band, 100% = upper band). Extreme readings are color-highlighted
SQUEEZE BARS — How many of the last 20 bars were in squeeze (higher = more compressed = bigger expected release)
KC RELATION — Whether BB is inside KC (squeeze), above KC (expansion), or near KC (transition)
─── MOMENTUM ───
RSI — Current RSI value with zone label (OB/OS/HIGH/LOW/MID) and appropriate coloring
EMA — Trend direction based on price vs. 100 EMA and EMA slope (▲ BULL / ▲ RISING / ▼ BEAR / ▼ FALLING)
SQ MOMENTUM — Squeeze momentum direction and strength (▲▲ STRONG UP / ▲ RISING / ▼▼ STRONG DOWN / ▼ FALLING / — FLAT)
MACD — MACD momentum status (▲ BULLISH / ▼ BEARISH / — NEUTRAL)
VOLUME — Whether current volume exceeds the moving average threshold (▲ ABOVE AVG / — NORMAL)
─── CONFIDENCE ───
BULL CONF — Current bullish confluence score with tier rating (S-TIER / A-TIER / B-TIER / C-TIER / LOW)
BEAR CONF — Current bearish confluence score with tier rating
These update in real-time so you can see confluence building before a signal fires
─── FORECAST ───
BASIS SLOPE — Direction the BB basis is heading (▲ RISING / ▼ FALLING / — FLAT)
BAND FORECAST — Whether bands are projected to widen (▲ WIDENING) or narrow (▼ NARROWING) or remain stable
─── STRUCTURE ───
SMA 200 — Price position relative to 200 SMA (▲ ABOVE / ▼ BELOW) — macro trend context
─── TRADE STATE ───
POSITION — Current tracked position direction (▲ LONG / ▼ SHORT / — FLAT) with color-coded background
BASIS DISTANCE — How far price is from the BB basis as a percentage — measures extension and mean reversion potential
Dashboard position (Top Left / Top Right / Bottom Left / Bottom Right) and text size (Tiny / Small / Normal) are configurable.
━━━━━━━━━━━━━━━━━━━━━━━━━━━━━━━━━━━━━━━━
⚡ Key Features
📊 Bollinger Bands with gradient trend cloud — instant visual of price position within the volatility envelope
🔷 Keltner Channels with ATR-based boundaries — the volatility reference for squeeze detection
🔴 BB/KC Squeeze Engine — detects compression, tracks squeeze duration, classifies release direction
⚡ Squeeze Release Flash Markers — "⚡ SQ↑" and "⚡ SQ↓" labels mark the explosive moment
🔭 Linear Regression Forecast — projects the band envelope forward with directional slope and price targets
🎯 Multi-confluence band touch signals — six-factor scoring with seven independent quality gates
📐 Volume filter — requires above-average volume for signal confirmation (toggleable)
🏗 Swing structure filter — requires local swing formation near bands (toggleable)
🕯 Candle rejection analysis — wick ratio and close direction confirmation
📈 MACD momentum integration — histogram trend confirmation within the scoring system
📏 200 SMA macro structure — long-term trend context for scoring
📐 100 EMA trend filter — intermediate trend direction and slope analysis
✕ Mean reversion exit markers — automatic profit target detection at the BB basis
🏷 Tiered signal labels — S / A / B tier with confidence percentage for position sizing decisions
📋 22-row real-time dashboard — complete market intelligence across volatility, momentum, confidence, forecast, structure, and trade state
🎨 Cohesive dual-tone color theme — yellow-green for bullish, red for bearish, orange for neutral, gray for inactive
🔔 11 alert conditions — S-Tier, A-Tier, and any-tier for both bull and bear, plus squeeze releases and exits
⚙ Fully configurable — all periods, multipliers, thresholds, colors, gates, and dashboard settings adjustable from the settings panel
🚫 No candle coloring — clean chart by default, your candles remain untouched
📏 Non-repainting — all signals confirmed on bar close
━━━━━━━━━━━━━━━━━━━━━━━━━━━━━━━━━━━━━━━━
⚙ Settings Reference
📊 Bollinger Bands
BB Length — SMA period for the basis line (default: 30)
BB Multiplier — standard deviation multiplier for band width (default: 2.2)
Source — price source for calculations (default: close)
Show BB Cloud — toggle the gradient band fill
🔷 Keltner Channel
KC Length — EMA period for the center line (default: 30)
KC ATR Multiplier — ATR multiplier for channel width (default: 1.8)
KC ATR Length — ATR calculation period (default: 20)
Show KC Lines — toggle Keltner boundary display
⚡ Squeeze
Show Squeeze Dots — toggle colored dots on the basis line
Alert on Squeeze Release — enable squeeze release alerts
🔭 Forecast
Show Regression Forecast — toggle the projected envelope
Forecast Bars — how many bars forward to project (default: 20)
🎯 Signals
Show Band Touch Signals — master toggle for entry labels
Min Confidence % — minimum confluence score required (default: 60%)
Signal Cooldown — minimum bars between same-direction signals (default: 15)
Show Mean Reversion Exits — toggle ✕ exit markers
📈 RSI Filter
RSI Length — calculation period (default: 14)
RSI Oversold — threshold for oversold scoring bonus (default: 30)
RSI Overbought — threshold for overbought scoring bonus (default: 70)
📐 EMA Trend Filter
Show Trend EMA — toggle the 100 EMA display
EMA Length — EMA period (default: 100)
📊 Volume Filter
Use Volume Confirmation — enable/disable volume gate (default: ON)
Volume Threshold Multiplier — how far above average volume must be (default: 1.2x)
Volume MA Length — period for volume moving average (default: 20)
🏗 Structure Filter
Use Swing Structure Filter — enable/disable swing gate (default: ON)
Swing Lookback — bars to check for swing formation (default: 3)
🎨 Colors
Bull Primary — yellow-green family for all bullish elements
Bear Primary — red family for all bearish elements
Basis / Neutral — orange for basis and neutral elements
Squeeze ON / OFF / Neutral — dot colors for squeeze states
Forecast Bull / Bear — projection envelope colors
Dashboard BG / Text / Neutral — dashboard styling
📋 Dashboard
Show Dashboard — master toggle
Position — corner placement (default: Top Right)
Text Size — Tiny / Small / Normal (default: Small)
━━━━━━━━━━━━━━━━━━━━━━━━━━━━━━━━━━━━━━━━
🔔 Alert Conditions
S-Tier Bull Band Touch — fires when a bullish signal with 80%+ confidence appears
A-Tier Bull Band Touch — fires when a bullish signal with 70–79% confidence appears
Any Bull Band Touch — fires on any bullish signal meeting minimum threshold
S-Tier Bear Band Touch — fires when a bearish signal with 80%+ confidence appears
A-Tier Bear Band Touch — fires when a bearish signal with 70–79% confidence appears
Any Bear Band Touch — fires on any bearish signal meeting minimum threshold
Any Band Touch Signal — fires on any entry signal regardless of direction
Squeeze Release — Bullish — fires on bullish squeeze release
Squeeze Release — Bearish — fires on bearish squeeze release
Any Squeeze Release — fires on any squeeze release
Long Exit — Mean Reversion — fires when a long position reaches the BB basis
Short Exit — Mean Reversion — fires when a short position reaches the BB basis
All alert messages include {{ticker}}, {{interval}}, and {{close}} placeholders for webhook integration.
━━━━━━━━━━━━━━━━━━━━━━━━━━━━━━━━━━━━━━━━
🎯 Default Settings — Optimized For
The default configuration is specifically tuned for XAUUSD (Gold) on the 1-minute timeframe :
BB Length 30 and Multiplier 2.2 — smooths gold's micro-noise and widens bands to reduce false touches
KC Length 30 and ATR Multiplier 1.8 — matched to BB for proper squeeze detection on gold
Confidence threshold at 30% — aggressively filters low-quality signals while keeping genuine setups
Cooldown at 4 bars (4 minutes) — prevents signal spam during volatile gold transitions
Volume filter enabled with 1.2x threshold — confirms institutional participation
Swing structure filter enabled — requires actual price structure, not random wicks
100 EMA provides ~1.5 hours of trend context on 1-minute
20-bar forecast projects 20 minutes ahead — practical for scalping decisions
For other instruments or timeframes, adjust:
Higher timeframes (5m, 15m, 1H) — reduce BB Length to 20–25, reduce confidence to 45–55%, increase forecast bars to 30–50
Forex majors (EURUSD, GBPUSD) — reduce BB Multiplier to 2.0, reduce KC ATR Multiplier to 1.5, keep confidence at 50–60%
Indices (NAS100, US30, SPX500) — use defaults or increase BB Length to 35–40 for broader structure
Crypto (BTCUSD, ETHUSD) — increase BB Multiplier to 2.5, increase cooldown to 20–25 bars due to higher volatility
Less noise / fewer signals — increase Min Confidence to 70%+, increase Cooldown, enable all gates
More signals / aggressive scalping — decrease Min Confidence to 40–50%, reduce Cooldown to 8–10, disable Swing Structure gate
━━━━━━━━━━━━━━━━━━━━━━━━━━━━━━━━━━━━━━━━
👥 Who This Is For
🥇 Gold (XAUUSD) scalpers and intraday traders — built and default-tuned specifically for gold's volatility, noise profile, and session structure
📊 Bollinger Band traders — if you trade band touches and mean reversion, this system adds institutional-grade filtering to your existing strategy
⚡ Squeeze traders — the BB/KC squeeze engine with momentum direction and release markers provides a complete squeeze trading system
📉 Forex and index traders — applicable to all major instruments with minor setting adjustments
🧠 Systematic traders — the confidence scoring system provides a quantitative framework for position sizing and trade selection
📈 Traders who value clean charts — no indicator clutter, no candle painting, no overlapping signals. One cohesive system with consistent color coding
⚠ Traders who struggle with overtrading — the seven quality gates physically prevent low-quality signals from appearing. You cannot overtrade what you cannot see
🔭 Forward-looking traders — the regression forecast gives you a projected roadmap that most indicators do not provide
━━━━━━━━━━━━━━━━━━━━━━━━━━━━━━━━━━━━━━━━
📝 Notes
All calculations are non-repainting — signals are confirmed on bar close only
The linear regression forecast updates on each new bar — the projection is a mathematical estimate, not a guarantee of future price action
Volume filter uses the volume data provided by your broker/data feed — for instruments or exchanges with unreliable volume, consider disabling the volume gate
The 200 SMA used in scoring requires 200 bars of history to calculate — on very short chart histories, this factor may not contribute to early signals
Maximum 500 labels per chart are supported by TradingView — on very low timeframes with extended history, oldest labels may be automatically removed
The forecast polyline uses TradingView's polyline drawing objects — a maximum of 100 polylines are allocated
Dashboard uses a table object that updates on the last bar — it reflects real-time values on live charts
Squeeze momentum calculation uses the John Carter method — linear regression of the midline-basis deviation over the BB length
━━━━━━━━━━━━━━━━━━━━━━━━━━━━━━━━━━━━━━━━
⚠ Disclaimer
This indicator is a technical analysis and visualization tool intended for educational and informational purposes only. It does not constitute financial advice or a recommendation to buy or sell any financial instrument. All signals are generated from historical and real-time price data using mathematical calculations — their accuracy or profitability is not guaranteed. Past performance of any signal type does not guarantee future results. Always conduct your own analysis, use proper risk management, and consult a licensed financial advisor before making any trading decisions. The author accepts no responsibility for any losses incurred from the use of this indicator.
━━━━━━━━━━━━━━━━━━━━━━━━━━━━━━━━━━━━━━━━
Built for traders who demand clarity, precision, and institutional-grade filtering from their volatility analysis. مؤشر

BB Volatility Squeeze MomentumBB Volatility Squeeze / Expansion
This indicator highlights periods when Bollinger Bands are tight relative to price (a volatility squeeze) versus wider expansion phases. Squeeze conditions can be based on Keltner Channels, a percentile of BB width, or both.
What it shows on the chart
Bollinger Bands (upper, lower, SMA basis) drawn on price. Band and fill colors switch with squeeze state: cool tones (blue) when a squeeze is active, warm tones (orange) when it is not.
Small dots under each bar summarize how each underlying squeeze method reads that bar:
Green: neither Keltner nor percentile squeeze
Red: Keltner squeeze only
Orange: percentile squeeze only
Yellow: both methods agree (squeeze on both)
Dot vertical position is controlled as a percentage of the bar range below the low.
Squeeze logic (summary)
Keltner-based: Squeeze when the Bollinger envelope sits inside the Keltner envelope (BB lower above KC lower and BB upper below KC upper).
Percentile-based: Computes BB width as (upper - lower) / basis. Squeeze when the percent rank of that width over the lookback is below your threshold (e.g. unusually narrow vs. recent history).
Squeeze method input chooses Keltner only, percentile only, or either (fires if either condition is true). The active squeeze used for band coloring follows that choice; the dots always show both methods for comparison.
Multi-timeframe (MTF) table
A table in the top-right shows four user-selected timeframes. For each TF it reports whether Keltner and percentile squeezes are on (SQZ) or off (—), with red/green cell backgrounds. Calculations use request.security() with no lookahead.
Inputs (by group)
Bollinger Bands: length, standard-deviation multiplier.
Keltner Channels: length, ATR multiplier.
Percentile method: lookback bars for the percent rank, squeeze threshold (percentile).
Squeeze method: Keltner / percentile / both.
MTF table: four timeframe strings (defaults: 15m, 1h, 4h, daily).
Visuals: squeeze dot offset below the bar (% of range).
License
This source code is subject to the terms of the Mozilla Public License 2.0.
مؤشر

Liquidation Cascade Detector - BasicThe Liquidation Cascade Detector identifies high-probability reversal entries by detecting the microstructure footprint of forced liquidations in futures, equities, crypto, and forex markets. When leveraged positions are stopped out in clusters, they create a recognizable sequence of price action, volume, and volatility signatures. This indicator scores the confluence of those signatures in real time — for both long and short setups simultaneously — and fires a signal only when the combined evidence exceeds a threshold.
This runs four of the seven analysis modules found in the full LCD system, fires up to five signals per regular trading session, and displays an aggregate confluence score. No external libraries, no dependencies — a single self-contained script.
Designed primarily for micro futures (MNQ, MGC, MES) on intraday timeframes (1m–15m), though the scoring system works on any liquid instrument with reliable volume data. Works on all TradingView plans.
## How It Works
The indicator evaluates four independent analysis modules, computes a directional confluence score for each side, and gates output through a cooldown and session cap before firing.
**Volume Analysis**
Classifies current volume relative to a rolling average. When volume exceeds a configurable spike multiplier, it indicates potential forced liquidation activity — the kind of participation surge that occurs when clustered stop-outs feed into the order book simultaneously. The volume score ramps linearly from normal conditions through spike territory. This module contributes context to both directions, since liquidation events produce volume regardless of which side is being forced out.
**Keltner Channel Exhaustion**
Measures price extension beyond dynamically calculated channel bands. The Keltner midline uses an EMA basis with ATR-scaled bands. When price pushes beyond the outer band, the indicator scores the degree of overextension — how far past the band in ATR terms. Greater extension produces a higher score, reflecting conditions where price has been pushed to statistical extremes consistent with forced-exit overshoot. The scoring is continuous, not binary: a slight breach scores low, while a 2-ATR overshoot receives the full module weight. Upper band exhaustion feeds into the short score; lower band exhaustion feeds into the long score.
**Price Action Structure**
Detects two liquidation-consistent candle patterns. The primary pattern is the liquidation bar: a candle with a disproportionately large wick and a small body on elevated volume, indicating price was shoved through a level by forced exits and then reclaimed by organic flow. Configurable wick-to-range and body-to-range ratios control detection sensitivity. The secondary pattern is the engulfing bar on volume — a full-range candle that absorbs the prior bar on above-average participation. Liquidation bars receive the full module score; engulfing bars receive a partial score reflecting their lower specificity as a liquidation signature.
**Higher Timeframe Trend**
Pulls a single EMA from a configurable higher timeframe and reads its slope direction. Signals aligned with the higher timeframe trend receive the full trend bonus. Counter-trend signals receive zero from this module but are not blocked — they simply need stronger confluence from the other three modules to reach the threshold. Counter-trend signals that do fire are visually dimmed on the chart so you can distinguish them at a glance.
**Scoring**
Each module contributes to a weighted confluence score computed independently for long and short directions on every bar. Volume (20 points max), Keltner exhaustion (30 points max), price action (25 points max), and higher timeframe trend (25 points max) sum to a 0–100 scale. A minimum-modules gate ensures at least two modules contribute meaningfully — a single strong reading in isolation cannot fire a signal. If both directions exceed the threshold simultaneously, only the higher-scoring direction fires.
**Signal Gating**
A fixed cooldown prevents signal clustering: after a signal fires, subsequent signals in the same direction are suppressed for a configurable number of bars. A per-session signal cap limits total signals during regular trading hours. When a signal is detected but suppressed by the session cap, a small marker appears at the bottom of the chart so you know the system saw something. Signals only fire during NY cash session AKA RTH (9:30 AM – 4:00 PM ET).
Functionality not in this version:
- **CVD Divergence Analysis** — Session-aware cumulative volume delta with structural divergence detection and momentum shift analysis. Detects when price is making new extremes but order flow is not confirming, which is one of the strongest signals of impending liquidation exhaustion.
- **PCA Breadth** — Cross-asset market internals aggregation (
TICK
,
ADD
,
V
VOLD
, VIX term structure) into a composite reading of internal market health. Identifies whether conditions favor longs, shorts, or neither.
- **ETF Correlation** — Monitors the relationship between the futures contract and its corresponding ETF, detecting alignment and divergence in relative momentum.
- **MFP Regime Classification** — A macro flow pressure model monitoring six asset classes (equity index futures, dollar, volatility, gold, crude, yield curve) to classify the current environment from Strong Risk-On to Strong Risk-Off. Adjusts signal thresholds, provides position sizing suggestions, and enables emergency exit alerts on adverse regime shifts.
- **Adaptive Thresholds** — Signal threshold adjusts dynamically based on current volatility regime rather than using a fixed value.
- **Full Pattern Library** — Additional liquidation patterns including sweep-reclaim, stop-hunt, and multi-bar absorption with quality scoring.
- **Five Presets** — Pre-tuned parameter sets for aggressive scalping, conservative scalping, intraday trend-fade, mean-reversion, and swing trading.
- **Unlimited signals per session** with adaptive cooldown that responds to market conditions.
## Display
Signal markers plot on the chart as directional triangles. Color intensity indicates trend alignment: bright signals are with-trend, dimmed signals are counter-trend. A small dot marker appears at the chart bottom when a qualifying signal was suppressed by the session cap.
Keltner channel bands are plotted as an overlay (toggle in settings). A score gauge in the bottom-right corner shows the leading direction, aggregate score, threshold, session signal count, and current session state. An info table (position configurable) provides a compact dashboard with scores for both directions, HTF trend, volume state, Keltner status, and signal budget.
Session awareness is built into the display: the RTH open price plots as a dashed horizontal line, and the opening range (9:30–10:00 ET) is highlighted with a subtle background shade.
## Settings
All parameters are adjustable:
- **Volume Lookback / Spike Multiplier** — Controls rolling average length and the threshold for classifying a volume bar as a spike. Default 20-bar lookback, 1.8x multiplier.
- **Keltner Length / ATR Multiple / ATR Length** — Controls channel width and sensitivity. Default 20-bar EMA, 2.0 ATR multiple, 14-bar ATR.
- **Liquidation Wick Ratio / Max Body Ratio** — Controls how strict the liquidation bar pattern detection is. Higher wick ratio and lower body ratio = fewer but higher-quality detections.
- **Trend Timeframe / Trend EMA Length** — Controls the higher timeframe trend overlay. Default 15-minute timeframe with 21-period EMA.
- **Signal Threshold** — Minimum confluence score to fire. Lower = more signals with lower average quality. Default 45.
- **Cooldown Bars** — Minimum spacing between signals. Default 10 bars.
- **Signals per Session** — Maximum signals during RTH. Default 5.
- **Display toggles** — Individually toggle Keltner bands, session markers, info table, and score gauge.
## Usage Notes
This is a scoring and alerting tool, not a strategy. It identifies conditions consistent with forced liquidation events and scores setup quality. It does not determine position size, stop placement, or profit targets. Not financial advice.
Signals are most reliable on liquid futures during active trading hours. The opening range and power hour tend to produce the highest-quality signals. Lunch hours (12:00–1:30 ET) typically produce thinner conditions. The indicator suppresses overnight signals by only firing during RTH.
Uses one `request.security()` call for the higher timeframe trend. All data uses confirmed bars with no lookahead. Open source under the Mozilla Public License 2.0. مؤشر

Keltner SD SuperTrend | RakoQuantKeltner SD SuperTrend by RakoQuant is a structural trend-following system that replaces ATR volatility with Standard Deviation inside a SuperTrend framework.
Instead of using raw range-based expansion, this model measures statistical dispersion around an EMA baseline, producing cleaner volatility envelopes in both compression and expansion phases.
The result is a SuperTrend variant that reacts to true deviation structure, not just candle range.
RakoQuant Architecture
1. EMA Baseline (Structural Mean)
The core baseline is an EMA:
* Provides directional bias
* Anchors volatility expansion
* Serves as slope reference for momentum gating
This keeps the model responsive without being overly reactive.
2. Standard Deviation Volatility (σ Engine)
Instead of ATR, this system uses:
Upper Band = EMA + (Multiplier × StdDev)
Lower Band = EMA − (Multiplier × StdDev)
This shifts the logic from range volatility to statistical dispersion.
Key effects:
* Compression phases tighten sharply
* Breakouts emerge from structured contraction
* Noise-based volatility spikes are reduced
* Trend shifts become more statistically defined
3. SuperTrend Trailing Logic
Classic trailing band mechanics are applied:
* Bands trail only in trend direction
* Once flipped, they do not reset until structurally broken
* Regime continuity is maintained
This prevents band “repainting” behavior and keeps state transitions clean.
4. Momentum Gate (Structural Confirmation)
An optional slope-based confirmation layer is included:
Momentum = EMA slope normalized by Standard Deviation
This ensures:
* Flips require directional bias
* Weak breaks in flat conditions are filtered
* Volatility expansion aligns with structural movement
It adds discipline without over-complicating the model.
Signal Model (RakoQuant Regime Logic)
The indicator operates using state-based architecture:
* Bullish Regime when SuperTrend flips upward
* Bearish Regime when SuperTrend flips downward
Flip events are:
* Deterministic
* Backtest-ready
* Alert-enabled
No repainting. No hidden smoothing. Clean state transitions.
Visual System
Keltner SD SuperTrend includes modular visual configuration:
* Multiple palette options (RakoQuant Neon, Classic, Gold/Indigo, Ocean/Coral, Mono)
* Line style control (Line Break default to prevent shelf artifacts)
* Dual-layer glow system
* Optional fill (to mid or to price)
* Optional EMA baseline display
* Candle painting toggle
* Optional UP/DN markers
The default Line Break style avoids the “box shelf” effect common in naive SuperTrend implementations.
Practical Use Cases
Trend Continuation
Use flips to capture directional expansion from statistical compression.
Breakout Detection
Watch for SD tightening before regime transition.
Volatility Rotation
Observe how dispersion expands during strong directional phases.
System Integration
Pairs cleanly with:
* Momentum oscillators
* Volume filters
* Higher timeframe bias systems
Design Philosophy (RakoQuant)
This tool reflects the RakoQuant framework:
* Statistical dispersion > raw range volatility
* Structural regime tracking > visual-only overlays
* Deterministic outputs > black-box smoothing
* Strategy-ready architecture
Everything is manual, open-source, and reproducible.
Chart Example
مؤشر

مؤشر
مؤشر

Squeeze ChannelSqueeze Channel
Volatility compression is one of the most reliable precursors to significant price movement. When markets consolidate, energy builds—like a coiled spring waiting to release. This indicator detects these compression phases using the classic squeeze methodology, then captures the consolidation range as a tradeable channel. The tighter the squeeze, the more potential energy stored for the eventual breakout.
What makes this approach effective is the combination of volatility-based timing with price structure. Rather than blindly trading every squeeze release, the indicator defines clear breakout levels based on the actual swing highs and lows formed during compression. This creates objective entry triggers while the squeeze intensity gradient (yellow → red) helps gauge the quality of the setup before committing.
How It Works
Squeeze Detection
The indicator identifies periods of volatility compression when Bollinger Bands contract inside Keltner Channels. A 5-color gradient (yellow → orange → red) visualizes squeeze intensity in real-time—the tighter the squeeze, the closer to red.
Channel Formation
When a squeeze begins, the indicator captures a swing high/low channel:
- Lookback : Grabs the highest high and lowest low over the past N bars
- Lookforward : Allows the channel to expand if price exceeds bounds in the first few bars
- Lock : Once the expansion window closes, the channel locks in place
The channel persists until price breaks out, regardless of whether the squeeze has ended.
Signal Types
Primary Signals
Bullish Breakout | 🔼 Teal Triangle | Close above channel high
Bearish Breakout | 🔽 Red Triangle | Close below channel low
Failed Breakout Reversals
When enabled, the indicator watches for failed breakouts—price breaks one direction then reverses through the opposite channel bound.
Bull Reversal | 💎 Cyan Diamond | Failed bear breakout, reclaims above
Bear Reversal | 💎 Magenta Diamond | Failed bull breakout, breaks below
Extended S/R Retest Signals
After a breakout, channel levels are stored as support/resistance for future retests. These levels remain invisible until price approaches within a user-defined ATR distance.
S/R Bull Breakout | 🔼 Faded Triangle | Breaks above extended resistance
S/R Bear Breakout | 🔽 Faded Triangle | Breaks below extended support
S/R Bull Reversal | 💎 Faded Diamond | Reclaims extended support
S/R Bear Reversal | 💎 Faded Diamond | Rejected at extended resistance
Settings
Squeeze Detection
- Bollinger Length (default: 12) — Shorter length = tighter bands, easier squeeze entry
- Bollinger Multiplier (default: 2.0)
- Keltner Length (default: 20)
- Keltner ATR Multiplier (default: 2.0) — Higher = wider channel, easier squeeze entry
Channel Settings
- Swing Lookback Bars (default: 5) — Bars to look back for initial channel
- Swing Lookforward Bars** (default: 3) — Bars to allow channel expansion
Reversal Detection
- Enable Failed Breakout Reversal — Toggle reversal signals on/off
- Reversal Watch Bars (default: 7) — How long to watch for failed breakout
Extended S/R
- Show Extended S/R Levels — Display historical channel levels
- Enable S/R Retest Signals — Toggle retest signals on/off
- Extended Level Bars (default: 50) — How long levels remain active
- S/R Signal Delay Bars (default: 5) — Delay before retest signals activate (filters noise)
- ATR Proximity Threshold (default: 1.0) — Distance for level visibility
- ATR Length (default: 14)
Visual Guide
- Colored dots = Active squeeze channel (gradient shows intensity)
- Fuchsia dots = Channel waiting for breakout (squeeze ended)
- Faded teal/red dots = Extended S/R levels (appear on proximity)
- Triangles = Breakout signals
- Diamonds = Reversal signals (failed breakouts) مؤشر

استراتيجية
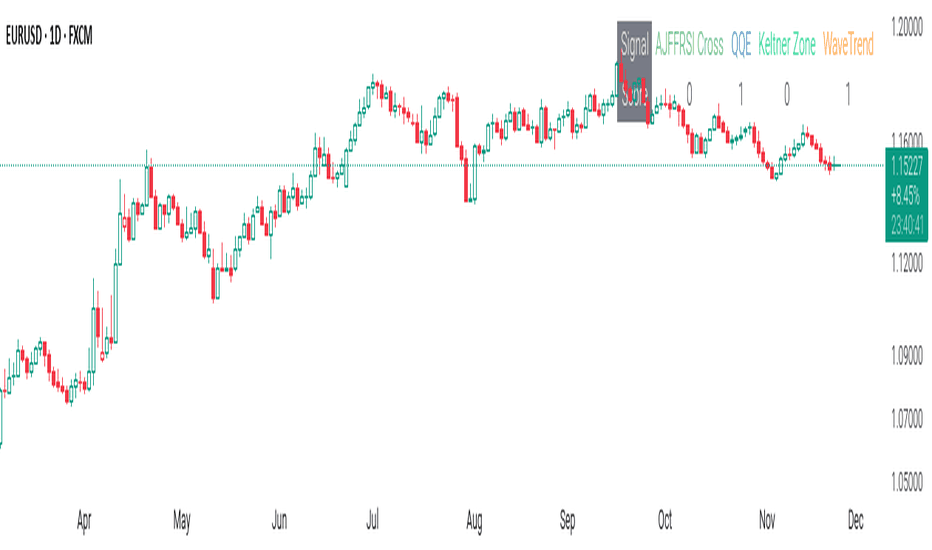
مؤشر

مؤشر

Chaikin Money FlowThis indicator provides an implementation of the classic Chaikin Money Flow (CMF), a volume-weighted oscillator designed to measure money flow pressure. It is enhanced with a customizable signal line and a built-in divergence detection engine.
Key Features:
Full Divergence Suite (Class A, B, C): The primary feature is the integrated divergence engine. It automatically detects and plots all three major types of divergences:
Regular (A): Signals potential trend reversals.
Hidden (B): Signals potential trend continuations.
Exaggerated (C): Signals weakness at double tops/bottoms.
Divergence Filtering and Visualization:
Price Tolerance Filter: Divergence detection is enhanced with a percentage-based price tolerance (pivPrcTol) to filter out insignificant market noise, leading to more robust signals.
Persistent Visualization: Divergence markers are plotted for the entire duration of the signal and are visually anchored to the CMF level of the confirming pivot.
Customizable Signal Line: Includes an optional moving average of the CMF, which serves as a signal line. The type of MA (Signal Smoothing) and its length can be customized. This signal line can also be optionally volume-weighted (Volume weighted).
Note on Confirmation (Lag): Divergence signals rely on a pivot confirmation method to ensure they do not repaint.
The Start of a- divergence is only detected after the confirming pivot is fully formed (a delay based on Pivot Right Bars).
The End of a divergence is detected either instantly (if the signal is invalidated by price action) or with a delay (when a new, non-divergent pivot is confirmed).
Multi-Timeframe (MTF) Capability:
MTF CMF & Signal Lines: The CMF and its signal line can be calculated on a higher timeframe, with standard options to handle gaps (Fill Gaps) and prevent repainting (Wait for...).
Limitation: The Divergence detection engine (pivDiv) is disabled if a timeframe other than the chart's timeframe is selected. Divergences are only calculated on the active chart timeframe.
Integrated Alerts: Includes 16 comprehensive alerts for:
The start and end of all 6 divergence types.
The CMF crossing its signal line.
The CMF crossing the zero line.
DISCLAIMER
For Informational/Educational Use Only: This indicator is provided for informational and educational purposes only. It does not constitute financial, investment, or trading advice, nor is it a recommendation to buy or sell any asset.
Use at Your Own Risk: All trading decisions you make based on the information or signals generated by this indicator are made solely at your own risk.
No Guarantee of Performance: Past performance is not an indicator of future results. The author makes no guarantee regarding the accuracy of the signals or future profitability.
No Liability: The author shall not be liable for any financial losses or damages incurred directly or indirectly from the use of this indicator.
Signals Are Not Recommendations: The alerts and visual signals (e.g., crossovers) generated by this tool are not direct recommendations to buy or sell. They are technical observations for your own analysis and consideration. مؤشر
Volume Weighted Keltner ChannelThis indicator provides a customizable implementation of Keltner Channels (KC), a volatility-based envelope designed to identify trend direction and potential reversal or breakout zones. It allows deep control over its core components and calculation methods.
Key Features:
Customizable Components: This implementation allows for full control over the channel's construction:
Basis Line: Choose from a wide range of moving average types (e.g., EMA, SMA, WMA) for the central line.
Volatility Bands: Select the volatility measure used to construct the bands: Average True Range (ATR), True Range (TR), or bar Range (High-Low).
Volume Weighting: An option (Volume weighted) allows for volume to be incorporated into the calculation of both the basis moving average and the selected volatility measure (e.g., creating a Volume-Weighted ATR). This makes the channel more responsive to moves backed by high market participation.
Logarithmic Scaling: The indicator includes an optional 'Normalize' mode that calculates the channel on a logarithmic scale. This creates bands that represent a constant percentage distance from the basis, making it a suitable tool for analyzing long-term trends in exponential markets.
Multi-Timeframe (MTF) Engine: The indicator includes an MTF conversion block. When a Higher Timeframe (HTF) is selected, advanced options become available: Fill Gaps handles data gaps, and Wait for timeframe to close prevents repainting by ensuring the indicator only updates when the HTF bar closes.
Integrated Alerts: Includes a full set of built-in alerts for the source price crossing over or under the upper band, lower band, and the central basis line.
DISCLAIMER
For Informational/Educational Use Only: This indicator is provided for informational and educational purposes only. It does not constitute financial, investment, or trading advice, nor is it a recommendation to buy or sell any asset.
Use at Your Own Risk: All trading decisions you make based on the information or signals generated by this indicator are made solely at your own risk.
No Guarantee of Performance: Past performance is not an indicator of future results. The author makes no guarantee regarding the accuracy of the signals or future profitability.
No Liability: The author shall not be held liable for any financial losses or damages incurred directly or indirectly from the use of this indicator.
Signals Are Not Recommendations: The alerts and visual signals (e.g., crossovers) generated by this tool are not direct recommendations to buy or sell. They are technical observations for your own analysis and consideration. مؤشر