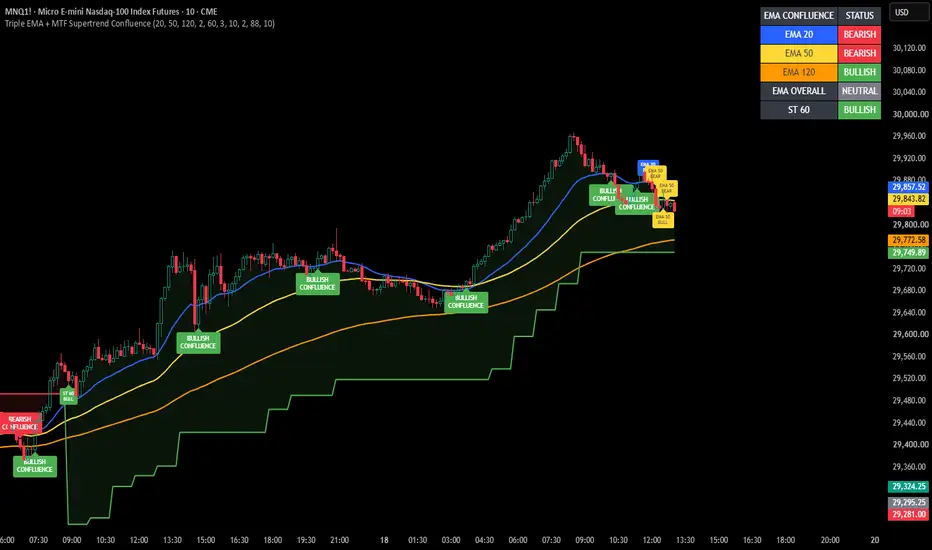
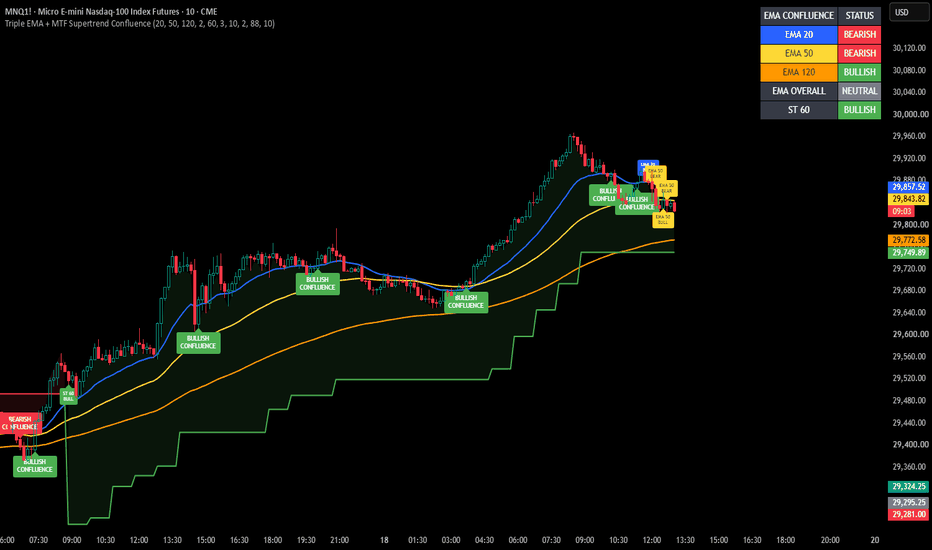
Triple EMA MTF Supertrend ConfluenceTriple EMA & Multi-Timeframe Supertrend Confluence is a technical analysis indicator designed to help traders identify market direction, trend changes, and potential areas of alignment across multiple moving averages.
The indicator features three fully adjustable Exponential Moving Averages (EMAs), with default settings of 20, 50, and 200. Each EMA is displayed using a distinct colour and generates individual bullish and bearish flip labels when price moves across the respective EMA.
The indicator also includes a configurable Multi-Timeframe Supertrend, allowing traders to monitor higher-timeframe trend direction while analysing lower-timeframe price action. The Supertrend is displayed with colour-coded bullish and bearish lines, together with optional shaded areas extending between the Supertrend line and the candles.
A confluence dashboard provides a clear overview of each EMA's current direction, overall EMA alignment, and Supertrend status. When all three EMAs align bullishly or bearishly, the indicator displays a confluence label and provides corresponding alert conditions.
Individual EMA flip labels include an optional expiry feature, allowing traders to automatically remove older labels after a selectable number of candles. This helps maintain a cleaner and more organised chart.
Key Features:
• Three adjustable EMAs with individual colour coding
• Bullish and bearish EMA flip labels
• Configurable Multi-Timeframe Supertrend
• Bullish green and bearish red Supertrend shading
• EMA confluence detection
• Real-time trend status dashboard
• Optional Supertrend flip labels
• Selectable individual EMA label expiry
• Alert conditions for EMA flips, Supertrend flips, and EMA confluence
This indicator is intended as a visual decision-support tool. It does not guarantee trading results and should be used alongside appropriate risk management and independent market analysis. مؤشر
Aurora KAMA | KAMA Adaptive Trend StrategyAurora KAMA Trend is a trend-following strategy built around Kaufman's Adaptive Moving Average (KAMA) — a moving average that speeds up when the market is trending cleanly and slows down when it's choppy, instead of using a fixed lookback like a standard SMA/EMA.
How it works:
Core signal: KAMA's slope determines direction. The strategy requires KAMA to be persistently rising (for longs) or falling (for shorts) over a configurable number of bars, filtering out minor wiggles near turning points.
Trend filter: An optional long-term SMA only allows longs above it and shorts below it, keeping trades aligned with the dominant trend.
Trade spacing: A cooldown period (in bars) prevents new entries from stacking up too close together during a single volatile move.
Risk management: An optional fixed percentage stop-loss, plus a trailing stop that only arms after a delay period, giving new positions room to develop before being trailed tightly.
Direction control: Trade long-only, short-only, or both.
Visuals:
The KAMA line changes color with trend direction (green/rising, red/falling, gray/flat), with a glowing red/green fill between KAMA and price whose intensity scales with the distance between them.
The trend SMA is rendered as a layered "glow" line — gold when sloping up, amber when sloping down.
Entries are marked with simple triangles; exits with small gray X's.
Tips:
Test on daily bars for liquid, trending instruments (e.g. BTCUSD, ES1!, SPY, QQQ) — KAMA needs a real trend to earn its keep.
Widen the rising/falling persistence inputs if you're getting whipsawed near turning points.
Turn off the SMA filter if you want KAMA to trade purely on its own slope, independent of the broader trend.
The trailing stop's delay is there to stop you from getting stopped out on entry noise — tighten it only if you're trading a slower timeframe.
استراتيجية

20/50 EMA Pullback Tap IndicatorThe 20/50 EMA Pullback Tap Indicator is a simple price-action based tool designed to identify potential entries after a momentum shift, rather than entering immediately when the 20 EMA crosses the 50 EMA.
The core idea is simple:
The EMA cross identifies a change in momentum. The pullback provides the entry.
How It Works
🟢 Long Setup
The 20 EMA crosses above the 50 EMA.
The indicator arms a bullish setup.
No trade is signalled on the crossover.
Price must first establish itself above the 20 EMA.
The indicator then waits for price to pull back and touch the 20 EMA.
When the 20 EMA is tapped, a BUY signal is generated.
Only one long signal is generated from that crossover.
If price does not touch the 20 EMA within 30 candles, the setup expires.
🔴 Short Setup
The short setup works in the opposite direction:
The 20 EMA crosses below the 50 EMA.
The indicator arms a bearish setup.
No trade is signalled on the crossover.
Price must first establish itself below the 20 EMA.
The indicator waits for price to pull back and touch the 20 EMA.
When the 20 EMA is tapped, a SELL signal is generated.
Only one short signal is generated from that crossover.
If price does not touch the 20 EMA within 30 candles, the setup expires.
Why Use the Pullback?
A common problem with EMA crossover systems is entering immediately on the crossover. By the time the cross occurs, price may already have moved significantly.
This indicator takes a different approach.
The 20/50 crossover is treated as confirmation that momentum has shifted, while the 20 EMA pullback is used as the potential entry location.
This can provide a more structured entry instead of chasing the initial move.
No Additional Indicators
The indicator intentionally keeps the methodology simple.
It does not use:
RSI
MACD
VWAP
Volume filters
Additional trend indicators
Multiple confirmation indicators
The system is built around just:
20 EMA + 50 EMA + Pullback to the 20 EMA
Signal Behaviour
The indicator is designed to detect the EMA tap during the active candle rather than requiring the candle to close first.
This means signals can appear while the current candle is developing when price reaches the 20 EMA.
Because of this behaviour, traders should understand that a live-bar signal can change or disappear before the candle closes depending on market movement and TradingView's realtime calculations.
Setup Expiration
Each crossover creates a new setup.
If the required pullback does not occur within the configured number of candles, the setup is automatically cancelled.
The default expiration is:
30 candles
This prevents an old EMA crossover from generating an entry long after the original momentum shift.
Recommended Use
The indicator can be used on its own as a simple EMA pullback system or combined with a trader's own:
Support and resistance
Market structure
Liquidity levels
Risk management
Higher-timeframe analysis
However, these additional concepts are not required by the indicator itself.
Important Disclaimer
This indicator identifies potential setups based on the rules described above. A signal does not guarantee a profitable trade.
Always use appropriate risk management and test the indicator on your chosen market and timeframe before using it with real capital. مؤشر

DNSE VN301!, BB-SMA Trend Following "Bollinger Bands Breakout with SMA Trend Filter" is a volatility-based trend-following strategy designed to capture strong directional price movements when price breaks beyond its recent volatility range. The strategy uses Bollinger Bands with a default SMA(20) basis and 2.0 standard deviations to identify bullish breakouts above the upper band and bearish breakouts below the lower band.
To improve signal quality, the strategy combines Bollinger Band breakouts with a mandatory SMA(200) trend filter, allowing Long trades only when the SMA is rising and Short trades only when it is falling. By combining volatility expansion with broader trend confirmation, the strategy seeks to reduce counter-trend and false breakout signals while participating in stronger intraday movements. It also includes configurable stop loss, take profit, trading session, trade direction, and automatic end-of-session position closure for disciplined risk management.
Strategy settings and configuration:
Chart timeframe: recommended 5-minute chart
Position size: 3 contracts
Bollinger Bands length: 20
Bollinger Bands multiplier: 2.0
SMA length: 200
Stop loss: 10 points
Take profit: 20 points
SMA trend filter: always enabled
Take profit: On / Off
Time filter: On / Off
Trading session: 09:00 – 14:30
Trade direction: Long / Short / Both
Default script settings:
The strategy calculates Bollinger Bands using the SMA(20) of the closing price. The upper and lower bands are created by adding or subtracting two standard deviations around the middle line.
When the closing price breaks above the upper Bollinger Band, buying pressure may be taking control. When the closing price breaks below the lower Bollinger Band, selling pressure may be taking control.
SMA(200) is used as the main trend filter. When SMA(200) is rising, the script only allows Long trades. When SMA(200) is falling, the script only allows Short trades.
In CNPS 04, the SMA(200) filter is always enabled. This helps the bot filter out breakout signals that go against the longer-term trend.
Users can add the built-in Bollinger Bands indicator on TradingView with Length 20 and Multiplier 2.0 to visually monitor the signal on the price chart.
Entry and exit rules:
Long entry:
Closing price > upper Bollinger Band
AND SMA(200) is rising
AND the signal appears during the trading session
AND trade direction allows Long entries
Long exit:
Stop loss: 10 points from entry price
Take profit: 20 points from entry price, if enabled
Opposite breakout signal appears
Reversal when a valid Short signal appears
Automatic position close at the end of the trading session
Short entry:
Closing price < lower Bollinger Band
AND SMA(200) is falling
AND the signal appears during the trading session
AND trade direction allows Short entries
Short exit:
Stop loss: 10 points from entry price
Take profit: 20 points from entry price, if enabled
Opposite breakout signal appears
Reversal when a valid Long signal appears
Automatic position close at the end of the trading session
Risk disclaimer:
Futures trading involves a high level of risk and prices can move sharply. This script is provided for reference, research, and backtesting purposes only. Users should fully understand derivatives trading, their own risk tolerance, and the strategy logic before applying it to live trading.
All investment decisions are the responsibility of the user. phaisinh.online is not responsible for any losses arising from the use of this strategy in real trading. Past performance does not guarantee future results.
_________________________________________________________________
"Bollinger Bands Breakout với Bộ lọc Xu hướng SMA" là một chiến lược giao dịch theo xu hướng dựa trên biến động, được thiết kế nhằm nắm bắt các chuyển động giá mạnh theo một hướng khi giá phá vỡ khỏi vùng biến động gần nhất. Chiến lược sử dụng Bollinger Bands với đường cơ sở mặc định là SMA(20) và 2,0 độ lệch chuẩn để xác định tín hiệu bứt phá tăng khi giá vượt lên trên dải trên và tín hiệu bứt phá giảm khi giá xuống dưới dải dưới.
Để nâng cao chất lượng tín hiệu, chiến lược kết hợp tín hiệu bứt phá Bollinger Bands với bộ lọc xu hướng SMA(200) bắt buộc, chỉ cho phép giao dịch Long khi SMA đang dốc lên và giao dịch Short khi SMA đang dốc xuống. Bằng cách kết hợp sự mở rộng của biến động với xác nhận xu hướng tổng thể, chiến lược hướng tới việc giảm thiểu các tín hiệu giao dịch ngược xu hướng và các tín hiệu phá vỡ giả, đồng thời tận dụng các chuyển động intraday mạnh hơn. Chiến lược cũng bao gồm các tùy chọn Stop Loss, Take Profit, khung thời gian giao dịch, hướng giao dịch và cơ chế tự động đóng vị thế khi kết thúc phiên, nhằm đảm bảo quản trị rủi ro một cách chặt chẽ và có kỷ luật.
Cài đặt & cấu hình chiến lược:
Biểu đồ: khuyến nghị khung 5 phút
Khối lượng giao dịch: 3 hợp đồng
Chu kỳ Bollinger Bands: 20
Hệ số nhân Bollinger Bands: 2.0
Chu kỳ SMA: 200
Cắt lỗ: 10 điểm
Chốt lời: 20 điểm
Bộ lọc xu hướng SMA: luôn bật
Dùng chốt lời: Bật / Tắt
Bộ lọc giờ: Bật / Tắt
Khung giờ giao dịch: 09:00 – 14:30
Chiều giao dịch: Mua / Bán / Cả hai
Cài đặt mặc định của script:
Chiến lược tính toán Bollinger Bands dựa trên đường SMA(20) của giá đóng cửa. Dải trên và dải dưới được tạo bằng cách cộng hoặc trừ hai độ lệch chuẩn quanh đường giữa.
Khi giá đóng cửa vượt lên trên dải trên Bollinger Bands, lực mua có thể đang chiếm ưu thế. Khi giá đóng cửa phá xuống dưới dải dưới Bollinger Bands, lực bán có thể đang chiếm ưu thế.
SMA(200) được dùng làm bộ lọc xu hướng chính. Khi SMA(200) dốc lên, script chỉ cho phép lệnh Mua. Khi SMA(200) dốc xuống, script chỉ cho phép lệnh Bán.
Trong CNPS 04, bộ lọc SMA(200) luôn bật. Điều này giúp bot loại bỏ bớt các tín hiệu breakout đi ngược xu hướng dài hạn.
Người dùng có thể thêm chỉ báo Bollinger Bands có sẵn trên TradingView với tham số Length 20 và Multiplier 2.0 để quan sát tín hiệu trực quan trên biểu đồ giá.
Điều kiện vào và thoát lệnh:
Vào lệnh Mua:
Giá đóng cửa > dải trên Bollinger Bands
VÀ SMA(200) dốc lên
VÀ tín hiệu xuất hiện trong khung giờ giao dịch
VÀ chiều giao dịch cho phép lệnh Mua
Thoát lệnh Mua:
Cắt lỗ: 10 điểm từ giá vào lệnh
Chốt lời: 20 điểm từ giá vào lệnh, nếu bật
Có tín hiệu breakout ngược chiều
Đảo chiều khi xuất hiện tín hiệu Bán hợp lệ
Tự động đóng lệnh khi hết khung giờ giao dịch
Vào lệnh Bán:
Giá đóng cửa < dải dưới Bollinger Bands
VÀ SMA(200) dốc xuống
VÀ tín hiệu xuất hiện trong khung giờ giao dịch
VÀ chiều giao dịch cho phép lệnh Bán
Thoát lệnh Bán:
Cắt lỗ: 10 điểm từ giá vào lệnh
Chốt lời: 20 điểm từ giá vào lệnh, nếu bật
Có tín hiệu breakout ngược chiều
Đảo chiều khi xuất hiện tín hiệu Mua hợp lệ
Tự động đóng lệnh khi hết khung giờ giao dịch
Tuyên bố rủi ro:
Giao dịch hợp đồng tương lai có mức độ rủi ro cao và giá có thể biến động mạnh. Script này chỉ phục vụ mục đích tham khảo, nghiên cứu và kiểm thử. Người dùng cần hiểu rõ giao dịch phái sinh, khẩu vị rủi ro cá nhân và logic của chiến lược trước khi áp dụng vào giao dịch thực tế.
Mọi quyết định đầu tư thuộc trách nhiệm của người dùng. phaisinh.online không chịu trách nhiệm cho bất kỳ khoản lỗ nào phát sinh từ việc sử dụng chiến lược này trong giao dịch thực tế. Hiệu quả trong quá khứ không đảm bảo kết quả trong tương lai.
استراتيجية

مؤشر

DNSE VN301!, SMA ADX/DI Trend Following Strategy"SMA ADX DI Trend Following" is a trend-following strategy designed to identify and capture directional price movements by combining SMA slope analysis with ADX trend-strength confirmation and DI directional signals. The strategy uses SMA(89) to determine the primary trend direction, while ADX(14) confirms that the market has sufficient trend strength and DI identifies whether bullish or bearish pressure is dominant.
By requiring agreement between trend direction, trend strength, and directional momentum, the strategy seeks to filter out weak or unclear market conditions while participating in stronger intraday trends. An optional SMA(200) trend filter provides additional broader-trend confirmation. The strategy also includes configurable stop loss, take profit, trading session filters, signal confirmation settings, and automatic end-of-session position closure for disciplined risk management.
Strategy settings and configuration:
Chart timeframe: recommended 15-minute chart
Position size: 3 contracts
Signal SMA length: 89
SMA slope lookback: 5
ADX length: 14
ADX threshold: 20
DI filter: On / Off
New signal only: On / Off
SMA trend filter: disabled by default
Trend filter SMA length: 200
Stop loss: 10 points
Take profit: 20 points
Take profit: On / Off
Time filter: On / Off
Trading session: 09:00 – 14:30
Trade direction: Long / Short / Both
Signal arrows: disabled by default
Default script settings:
The strategy uses a signal SMA with a length of 89 to identify the main market direction. Instead of comparing the current SMA with only the previous candle, the bot uses a slope lookback of 5.
This means the bot compares the current SMA with the SMA value from 5 candles ago. If the current SMA is higher than the SMA from 5 candles ago, the SMA is considered rising. If the current SMA is lower than the SMA from 5 candles ago, the SMA is considered falling.
This method helps reduce noise on the 1-minute timeframe. The bot does not enter a trade just because the SMA moves slightly within one candle.
ADX(14) is used to confirm trend strength. When ADX is above 20, the market is considered to have enough trend strength for trading signals to be considered.
DI is used to confirm trend direction. When +DI is above -DI, buying pressure is dominant. When -DI is above +DI, selling pressure is dominant.
When the DI filter is enabled, the bot only allows Long trades when +DI > -DI. It only allows Short trades when -DI > +DI.
The “New signal only” option helps reduce repeated entries in the same signal state. When this option is enabled, the bot only enters when a new Long or Short state appears.
The SMA(200) trend filter is disabled by default. Users can enable this filter if they want stricter alignment with the larger trend.
When the SMA(200) trend filter is enabled, the script only allows Long trades when SMA(200) is rising and only allows Short trades when SMA(200) is falling.
Entry and exit rules:
Long entry:
Signal SMA is rising based on the 5-candle lookback
AND ADX(14) > 20
AND +DI > -DI, if the DI filter is enabled
AND SMA(200) is rising, if the SMA trend filter is enabled
AND a new Long state has just appeared, if new signal only mode is enabled
AND the signal appears during the trading session
AND trade direction allows Long entries
Long exit:
Stop loss: 10 points from entry price
Take profit: 20 points from entry price, if enabled
Signal SMA turns downward
Reversal when a valid Short signal appears
Automatic position close at the end of the trading session
Short entry:
Signal SMA is falling based on the 5-candle lookback
AND ADX(14) > 20
AND -DI > +DI, if the DI filter is enabled
AND SMA(200) is falling, if the SMA trend filter is enabled
AND a new Short state has just appeared, if new signal only mode is enabled
AND the signal appears during the trading session
AND trade direction allows Short entries
Short exit:
Stop loss: 10 points from entry price
Take profit: 20 points from entry price, if enabled
Signal SMA turns upward
Reversal when a valid Long signal appears
Automatic position close at the end of the trading session
Strategy logic:
CNPS 05 is suitable for market phases with clear trend direction. The signal SMA identifies the main direction. ADX filters for markets with enough trend strength. DI confirms whether buying or selling pressure is dominant.
This structure helps reduce noise in sideways conditions. The bot does not rely only on SMA slope. It also requires enough trend strength and directional confirmation from DI.
Time filter:
The default trading session is 09:00 – 14:30, designed to avoid two abnormal volatility periods.
ATO 08:45 – 09:00 is the opening auction period. Price can gap strongly and technical signals may be noisy.
ATC and negotiated trading 14:30 – 15:00 is the closing auction period. Price can move sharply or reverse quickly.
Users can adjust the start time and end time in the bot settings.
Risk disclaimer:
Futures trading involves a high level of risk and prices can move sharply. This script is provided for reference, research, and backtesting purposes only. Users should fully understand derivatives trading, their own risk tolerance, and the strategy logic before applying it to live trading.
All investment decisions are the responsibility of the user. phaisinh.online is not responsible for any losses arising from the use of this strategy in real trading. Past performance does not guarantee future results.
______________________________________________________________
"SMA ADX DI Trend Following" là một chiến lược giao dịch theo xu hướng, được thiết kế nhằm xác định và nắm bắt các chuyển động giá theo xu hướng bằng cách kết hợp phân tích độ dốc SMA với xác nhận sức mạnh xu hướng từ ADX và tín hiệu định hướng từ DI. Chiến lược sử dụng SMA(89) để xác định hướng xu hướng chính, trong khi ADX(14) xác nhận thị trường đang có đủ sức mạnh xu hướng và DI xác định bên mua hay bên bán đang chiếm ưu thế.
Bằng cách yêu cầu sự đồng thuận giữa hướng xu hướng, sức mạnh xu hướng và động lượng định hướng, chiến lược hướng tới việc lọc các điều kiện thị trường yếu hoặc không rõ xu hướng, đồng thời tham gia vào các xu hướng intraday mạnh hơn. Bộ lọc xu hướng SMA(200) tùy chọn cung cấp thêm xác nhận về xu hướng tổng thể. Chiến lược cũng bao gồm các tùy chọn Stop Loss, Take Profit, bộ lọc khung thời gian giao dịch, cài đặt xác nhận tín hiệu và cơ chế tự động đóng vị thế khi kết thúc phiên, nhằm đảm bảo quản trị rủi ro một cách chặt chẽ và có kỷ luật.
Cài đặt & cấu hình chiến lược:
Biểu đồ: khuyến nghị khung 15 phút
Khối lượng giao dịch: 3 hợp đồng
Chu kỳ SMA tín hiệu: 89
SMA slope lookback: 5
Chu kỳ ADX: 14
Ngưỡng ADX: 20
Bộ lọc DI: Bật / Tắt
Chỉ vào khi tín hiệu mới: Bật / Tắt
Bộ lọc xu hướng SMA: Tắt mặc định
Chu kỳ SMA bộ lọc: 200
Cắt lỗ: 10 điểm
Chốt lời: 20 điểm
Dùng chốt lời: Bật / Tắt
Bộ lọc giờ: Bật / Tắt
Khung giờ giao dịch: 09:00 – 14:30
Chiều giao dịch: Mua / Bán / Cả hai
Hiện mũi tên tín hiệu: Tắt mặc định
Cài đặt mặc định của script:
Chiến lược sử dụng SMA tín hiệu chu kỳ 89 để xác định hướng chính của thị trường. Thay vì so sánh SMA hiện tại với đúng một nến trước, bot sử dụng SMA slope lookback 5.
Điều này có nghĩa là bot so sánh SMA hiện tại với SMA của 5 nến trước. Nếu SMA hiện tại cao hơn SMA của 5 nến trước, SMA được xem là đang dốc lên. Nếu SMA hiện tại thấp hơn SMA của 5 nến trước, SMA được xem là đang dốc xuống.
Cách tính này giúp giảm nhiễu trên khung 1 phút. Bot không vào lệnh chỉ vì SMA nhích nhẹ trong một nến ngắn.
ADX(14) được dùng để xác nhận sức mạnh xu hướng. Khi ADX lớn hơn 20, thị trường được xem là có đủ lực xu hướng để xét tín hiệu giao dịch.
DI được dùng để xác nhận hướng xu hướng. Khi +DI lớn hơn -DI, lực tăng đang chiếm ưu thế. Khi -DI lớn hơn +DI, lực giảm đang chiếm ưu thế.
Khi bật bộ lọc DI, bot chỉ cho phép lệnh Mua khi +DI > -DI. Bot chỉ cho phép lệnh Bán khi -DI > +DI.
Tùy chọn “Chỉ vào khi tín hiệu mới” giúp hạn chế vào lại liên tục trong cùng một trạng thái. Khi bật tùy chọn này, bot chỉ vào lệnh khi trạng thái Long hoặc Short vừa mới xuất hiện.
Bộ lọc SMA(200) được để tắt mặc định. Người dùng có thể bật bộ lọc này nếu muốn giao dịch chặt hơn theo xu hướng lớn.
Khi bật bộ lọc SMA(200), script chỉ cho phép lệnh Mua khi SMA(200) dốc lên và chỉ cho phép lệnh Bán khi SMA(200) dốc xuống.
Điều kiện vào và thoát lệnh:
Vào lệnh Mua:
SMA tín hiệu dốc lên theo lookback 5
VÀ ADX(14) > 20
VÀ +DI > -DI, nếu bật bộ lọc DI
VÀ SMA(200) dốc lên, nếu bật bộ lọc xu hướng SMA
VÀ trạng thái Mua vừa mới xuất hiện, nếu bật chế độ chỉ vào tín hiệu mới
VÀ tín hiệu xuất hiện trong khung giờ giao dịch
VÀ chiều giao dịch cho phép lệnh Mua
Thoát lệnh Mua:
Cắt lỗ: 10 điểm từ giá vào lệnh
Chốt lời: 20 điểm từ giá vào lệnh, nếu bật
SMA tín hiệu đảo chiều xuống
Đảo chiều khi xuất hiện tín hiệu Bán hợp lệ
Tự động đóng lệnh khi hết khung giờ giao dịch
Vào lệnh Bán:
SMA tín hiệu dốc xuống theo lookback 5
VÀ ADX(14) > 20
VÀ -DI > +DI, nếu bật bộ lọc DI
VÀ SMA(200) dốc xuống, nếu bật bộ lọc xu hướng SMA
VÀ trạng thái Bán vừa mới xuất hiện, nếu bật chế độ chỉ vào tín hiệu mới
VÀ tín hiệu xuất hiện trong khung giờ giao dịch
VÀ chiều giao dịch cho phép lệnh Bán
Thoát lệnh Bán:
Cắt lỗ: 10 điểm từ giá vào lệnh
Chốt lời: 20 điểm từ giá vào lệnh, nếu bật
SMA tín hiệu đảo chiều lên
Đảo chiều khi xuất hiện tín hiệu Mua hợp lệ
Tự động đóng lệnh khi hết khung giờ giao dịch
Logic chiến lược:
CNPS 05 phù hợp với các giai đoạn thị trường có xu hướng rõ ràng. SMA tín hiệu giúp xác định hướng di chuyển chính. ADX giúp lọc những giai đoạn thị trường có lực. DI giúp xác nhận lực đang nghiêng về bên Mua hay bên Bán.
Cấu trúc này giúp bot hạn chế tín hiệu nhiễu trong vùng sideway. Bot không chỉ nhìn độ dốc SMA, mà còn yêu cầu thị trường có đủ sức mạnh xu hướng và có xác nhận hướng từ DI.
Bộ lọc giờ:
Mặc định 09:00 – 14:30, nhằm tránh hai vùng biến động bất thường.
ATO 08:45 – 09:00 là giai đoạn khớp lệnh mở cửa. Giá thường có thể gap mạnh và tín hiệu kỹ thuật dễ bị nhiễu.
ATC và giao dịch thỏa thuận 14:30 – 15:00 là giai đoạn khớp lệnh đóng cửa. Giá có thể biến động mạnh hoặc đảo chiều nhanh.
Người dùng có thể điều chỉnh giờ bắt đầu và giờ kết thúc trong phần cài đặt bot.
Tuyên bố rủi ro:
Giao dịch hợp đồng tương lai có mức độ rủi ro cao và giá có thể biến động mạnh. Script này chỉ phục vụ mục đích tham khảo, nghiên cứu và kiểm thử. Người dùng cần hiểu rõ giao dịch phái sinh, khẩu vị rủi ro cá nhân và logic của chiến lược trước khi áp dụng vào giao dịch thực tế.
Mọi quyết định đầu tư thuộc trách nhiệm của người dùng. phaisinh.online không chịu trách nhiệm cho bất kỳ khoản lỗ nào phát sinh từ việc sử dụng chiến lược này trong giao dịch thực tế. Hiệu quả trong quá khứ không đảm bảo kết quả trong tương lai.
استراتيجية

Multi EMA SMA Pro - 5/13/20/50/100/200 - MTFMULTI EMA/SMA PRO — 5/13/20/50/100/200 + MTF
Nine independent moving averages in one indicator, each with its own length,
type, timeframe, color and width. Defaults give you the classic 20 / 50 / 100 /
200 on your chart timeframe, with 5 and 13 a click away.
EVERY LINE IS LABELLED
No more guessing which line is which. Each average is tagged at the right edge
with its length — and optionally its type, its timeframe, its current value, and
how far price sits from it in percent. You read "200 D +18.06%" straight off the
chart instead of hovering over lines to find out.
DAILY / WEEKLY / MONTHLY AVERAGES ON ANY CHART
Every slot has a Chart / Daily / Weekly / Monthly / Custom selector, so you can
sit on a 5-minute chart and still see exactly where the daily 200 and the weekly
200 are — the levels that actually decide intraday reversals. Slots 7, 8 and 9
come pre-set to 200 D, 30 W and 200 W. Each higher-timeframe line is tagged with
D, W or M so there is never any ambiguity about what you are looking at. Ask for
a timeframe below your chart and the slot quietly falls back to chart data rather
than returning misleading values.
INFO TABLE
An on-chart panel lists every enabled average, its current value, and how far
price is above or below it in percent, color-coded green and red. It is the
fastest way to tell whether price is extended and due a snap back, or resting on
support. Decimal precision is adjustable.
GOLDEN CROSS / DEATH CROSS, DONE PROPERLY
GC/DC detection is on by default and measured on the DAILY 50 vs 200 no matter
what timeframe you are viewing — so an intraday chart shows the real cross, not a
5-minute imitation of one. Markers carry their own context: "GC 50/200 D".
Lengths, timeframe and MA type are all configurable, or you can point the cross
logic at any two of your plotted lines instead.
EVERYTHING ELSE
- EMA / SMA / WMA / HMA / RMA / VWMA globally, or overridden per line
- Custom source, plot offset, transparency, per-line width and color
- Line / step-line / circles / cross plot styles
- Slope-based coloring (green rising, red falling)
- Ribbon fill between any two averages
- Alerts for price crossing each average, plus golden and death cross
- Palette chosen to stay readable on both light and dark chart backgrounds
A NOTE ON HIGHER-TIMEFRAME DATA
Leave "wait for bar close" off and the daily and weekly lines update live inside
the forming candle, which is usually what you want when trading. The trade-off is
that an intraday cross can appear and then disappear before the session closes.
Turn it on for confirmed, non-repainting values that step one bar late.
If you find this useful, a boost is appreciated. Suggestions and feedback welcome in the comments.
Open-source — feel free to study, fork, and adapt. مؤشر

TF: Price-MA Deviation (PMAD)TradingFlow: Price-MA Deviation (PMAD)
TradingFlow: Price-MA Deviation (PMAD) is a mean-reversion indicator that measures how far price has deviated from its moving average, normalized to a 0–100 scale based on recent historical range. Raw percentage deviation varies widely across assets and timeframes, so PMAD takes a different approach. It answers a simple question: where does the current deviation sit relative to recent history? This makes PMAD comparable across different symbols, timeframes, and market conditions. A reading of 85 on Bitcoin means the same thing as a reading of 85 on a stock. Price is stretched to the upper end of its recent deviation range.
Key Features:
Normalized Deviation (0–100)
The core line oscillates between 0 and 100. At 50, price is at its moving average. Above 50, price is above the MA. Below 50, price is below. The value shows where the current deviation falls within the highest and lowest deviations over the normalization lookback period.
Adaptive Timeframe Scaling
PMAD automatically adjusts its MA and normalization periods based on the chart timeframe. On intraday charts, shorter periods keep the indicator responsive. On daily and higher timeframes, the full user-specified periods produce a smoother macro view. Intraday scaling can be fine-tuned with exposed base period and normalization multiplier inputs.
Auto Market-Hour Detection
PMAD detects the asset type and sets trading hours automatically. Crypto and forex get 24 hours, futures get 23 hours, and equities get 6.5 hours. A manual override is available for non-standard sessions.
Overbought and Oversold Zones
Dotted reference lines at 85 and 15 mark potential overbought and oversold conditions. The area above 85 is shaded red; the area below 15 is shaded green. These levels are configurable.
Signal Line
An optional smoothed line (SMA or EMA) of the deviation can be displayed. Crossovers between the deviation line and the signal line can help identify shifts in momentum. The signal line period is set in bars and works across all timeframes.
Alerts
Six built-in alert conditions are available: overbought cross, oversold cross, signal bullish cross, signal bearish cross, bullish regime (above 50), and bearish regime (below 50).
How to Read the Chart
A reading above 50 means price is trading above its moving average. A reading below 50 means price is below. The further from 50, the more extended the deviation.
Overbought (above 85) means price has deviated to the upper end of its recent range. Oversold (below 15) means price has deviated to the lower end. These zones suggest potential mean-reversion conditions, but should not be treated as automatic entry or exit signals.
When the deviation line crosses above the signal line, short-term momentum is increasing. When it crosses below, momentum is decreasing.
Flexible Configuration
PMAD supports SMA and EMA moving-average types, adjustable MA and normalization periods, configurable thresholds, and per-asset trading hour settings. Intraday base period and normalization multiplier can be fine-tuned for different markets or trading styles.
Practical Use
PMAD can identify extended price conditions, monitor mean-reversion opportunities, filter entries against the broader deviation context, and compare relative strength across multiple symbols. It works best alongside price action, support and resistance, volume, volatility analysis, and disciplined risk management.
PMAD does not predict future price movement and should not be used as a standalone entry or exit system.
---
TradingFlow: Price-MA Deviation (PMAD)
TradingFlow: Price-MA Deviation (PMAD) 是一個均值回歸指標,衡量價格偏離移動平均線的程度,並根據近期歷史範圍歸一化至 0–100 的刻度。不同商品和時間週期之間的百分比偏離差異很大,PMAD 不顯示原始偏離值,而是回答一個簡單的問題:目前的偏離程度,在近期歷史中處於什麼位置?這讓 PMAD 可以在不同標的、時間週期和市場條件之間進行比較。Bitcoin 上的 85 讀數與股票上的 85 讀數含義相同。價格已偏離至其近期偏離範圍的上端。
核心功能:
歸一化偏離值(0–100)
核心線在 0 到 100 之間震盪。位於 50 時,價格正好在移動平均線上。高於50,價格在均線上方;低於50,價格在均線下方。該數值代表目前偏離值在歸一化回看期內最高和最低偏離值之間的位置。
自適應時間週期縮放
PMAD 會根據圖表時間週期自動調整 MA 和歸一化的期間。在日內圖表上使用較短的週期以保持靈敏度;在日線及以上圖表上使用完整的使用者設定週期,以獲得更平滑的宏觀視角。日內縮放可透過基礎期間和歸一化倍數進行微調。
自動市場時數偵測
PMAD 會偵測資產類型並自動設定交易時數。加密貨幣和外匯為24小時,期貨為23小時,股票為6.5小時。也提供手動覆蓋選項,適用於非標準交易時段。
超買和超賣區域
85 和15 的虛線參考標記潛在的超買和超賣狀態。85 以上區域以紅色陰影標示;15 以下區域以綠色陰影標示。這些水平可自行調整。
訊號線
可選擇顯示偏離值的平滑線(SMA 或 EMA)。偏離線與訊號線之間的交叉,有助於識別動能的轉變。訊號線期間以 K 棒數設定,適用於所有時間週期。
警報
內建六種警報條件:超買突破、超賣跌破、訊號線多頭交叉、訊號線空頭交叉、多頭狀態(50 以上)及空頭狀態(50 以下)。
如何閱讀圖表
當偏離線高於50時,價格交易在移動平均線上方;低於50時,價格在均線下方。距離50越遠,偏離越極端。
當線條進入超買區域(高於85),價格已偏離至近期範圍的上端;進入超賣區域(低於15),價格已偏離至下端。這些區域暗示可能的均值回歸條件,但不應視為自動的進場或出場訊號。
當偏離線向上穿越訊號線,短期動能正在增強;向下穿越則代表動能減弱。
彈性設定
PMAD 支援 SMA 和 EMA 移動平均類型、可調整的 MA 和歸一化期間、可設定的閾值,以及每種資產的交易時數設定。日內基礎期間和歸一化倍數可針對不同市場或交易風格進行微調。
實際使用方式
PMAD 可用於辨識極端價格條件、觀察均值回歸機會、根據偏離背景過濾交易,以及比較多個標的的相對強弱。它適合搭配價格行為、支撐阻力、成交量、波動率分析與風險管理一起使用。
PMAD 無法預測未來價格走勢,也不應單獨用作進場或出場系統。
---
TradingFlow: Price-MA Deviation (PMAD)
TradingFlow: Price-MA Deviation (PMAD) は、価格が移動平均線からどれだけ乖離しているかを測定し、直近の歴史的なレンジに基づいて 0〜100 に正規化する平均回帰型インジケーターです。生の乖離率は銘柄や時間足によって大きく異なるため、PMAD は異なるアプローチを採用しています。シンプルな問いかけに答えます。現在の乖離は、直近の歴史の中でどの位置にあるか。これにより、異なる銘柄、時間足、市場条件間で比較が可能になります。Bitcoin で 85 という読み値は、株式で 85 と同じ意味を持ちます。価格が直近の乖離レンジの上限にまで引き伸ばされている状態です。
主な機能:
正規化乖離値(0〜100)
コアとなるラインは 0 から 100 の間で推移します。50 は価格が移動平均線上にある状態を示します。50 以上なら価格は MA を上回り、50 以下なら下回ります。この値は、正規化のルックバック期間における最高乖離値と最低乖離値のレンジの中で、現在の乖離がどの位置にあるかを示しています。
アダプティブタイムフレームスケーリング
PMAD はチャートの時間足に応じて、MA と正規化の期間を自動調整します。日中足では短い期間を採用し、インジケーターの応答性を維持します。日足以上の時間足では、ユーザーが指定した期間をそのまま使用し、より滑らかなマクロ視点を実現します。日中のスケーリングは、ベース期間と正規化倍数の入力パラメーターで微調整可能です。
マーケット時間の自動検出
PMAD はアセットの種類を検出し、取引時間を自動設定します。暗号通貨と FX は 24 時間、先物は 23 時間、株式は 6.5 時間が適用されます。非標準の取引セッションにも対応できる手動設定が用意されています。
買われすぎ・売られすぎゾーン
85 と 15 の破線は、買われすぎ・売られすぎの目安を示します。85 以上の領域は赤で塗りつぶされ、15 以下の領域は緑で塗りつぶされます。これらの水準は変更可能です。
シグナルライン
乖離値を平滑化した線(SMA または EMA)をオプションで表示できます。乖離線とシグナルラインのクロスは、勢いの変化を捉えるのに役立ちます。シグナルラインの期間はバー数で指定し、すべての時間足で動作します。
アラート
6 種類のアラート条件を標準装備しています。買われすぎ突破、売られすぎ下抜け、シグナルラインの買いクロス、シグナルラインの売りクロス、強気レジーム(50 以上のクロス)、弱気レジーム(50 以下のクロス)です。
チャートの読み方
乖離値が 50 を上回れば、価格は移動平均線の上で推移しています。50 を下回れば、下で推移しています。50 から離れるほど、乖離は極端になります。
買われすぎ(85 以上)は、価格が直近レンジの上限に達していることを示します。売られすぎ(15 以下)は、下限に達していることを示します。これらのゾーンは平均回帰の可能性を示唆しますが、自動的な売買シグナルとして扱うべきではありません。
乖離線がシグナルラインを上抜けた場合は短期の勢いが増し、下抜けた場合は勢いが衰減しています。
柔軟な設定
PMAD は SMA と EMA の移動平均タイプ、MA と正規化の期間調整、閾値の設定、アセット別の取引時間設定に対応しています。日中のベース期間と正規化倍数は、市場やトレードスタイルに合わせて微調整可能です。
実際の使い方
PMAD は、価格の過熱状態の把握、平均回帰の機会の監視、乖離のコンテキストに基づくエントリーのフィルタリング、複数銘柄間の相対ストレングスの比較に活用できます。価格アクション、サポート・レジスタンス、出来高、ボラティリティ分析、そして規律あるリスク管理と組み合わせて使用することが推奨されます。
PMAD は将来の価格動向を予測するものではなく、単独での売買システムとして使用すべきではありません。
مؤشر

مؤشر

Moving Average Liquidity Sweeps - Candle Iron CoreMoving Average Liquidity Sweeps - Candle Iron Core
OVERVIEW
Moving Average Liquidity Sweeps is a rule-based indicator designed to identify wick-based sweeps around a dynamically calculated moving average.
Unlike a fixed horizontal liquidity level, a moving average continuously changes with price. This indicator uses the selected EMA or SMA as a dynamic reference and evaluates how individual candles interact with it.
A candle is not classified as a sweep simply because its wick touches or crosses the moving average.
To qualify, the interaction must satisfy independent conditions involving:
The position of the candle body relative to the moving average.
The total length of the wick.
The actual depth of penetration beyond the moving average.
The purpose is to provide a configurable and repeatable method for distinguishing qualifying wick-based interactions from ordinary touches or shallow retests of a moving average.
CORE CONCEPT
The selected moving average acts as the dynamic reference level.
Users can choose:
EMA - Exponential Moving Average
SMA - Simple Moving Average
Moving Average Length
Moving Average Source
For example, the indicator can evaluate interactions with a 21 EMA, 89 SMA, 200 EMA, or any other user-defined combination.
The moving average itself does not determine whether an interaction qualifies as a sweep.
The candle must independently satisfy the sweep conditions described below.
MOVING AVERAGE CALCULATION
When EMA is selected, the script calculates an Exponential Moving Average using the selected source and length.
When SMA is selected, the script calculates a Simple Moving Average using the selected source and length.
The resulting value becomes the Liquidity Moving Average used as the reference for each candle.
Because the moving average is recalculated over time, the reference level evaluated by the script changes from bar to bar.
TWO INDEPENDENT PERCENTAGE FILTERS
The indicator separates two measurements:
Minimum Wick Length (%)
Minimum Sweep Depth Beyond MA (%)
These measurements serve different purposes.
A candle can have a large wick while only slightly crossing the moving average.
Conversely, crossing the moving average does not necessarily mean that the wick itself is significant.
Requiring both conditions provides additional control over what the user chooses to classify as a qualifying sweep.
1. MINIMUM WICK LENGTH
This parameter evaluates the complete wick responsible for the interaction.
For a sweep below the moving average:
Lower edge of candle body → Candle Low
For a sweep above the moving average:
Upper edge of candle body → Candle High
The lower edge of the candle body is defined as the lower value between Open and Close.
The upper edge of the candle body is defined as the higher value between Open and Close.
Therefore, the calculation works consistently for both bullish and bearish candles.
The percentage calculation used by the indicator is:
Lower Wick % = (Body Low - Low) / Body Low × 100
Upper Wick % = (High - Body High) / Body High × 100
The complete wick must meet or exceed the Minimum Wick Length selected by the user.
2. MINIMUM SWEEP DEPTH BEYOND MA
Sweep Depth measures a different distance.
Instead of measuring the complete wick, it measures only how far price extends beyond the moving average.
For a sweep below:
Moving Average → Candle Low
For a sweep above:
Moving Average → Candle High
The percentage calculation is:
Sweep Depth Below % = (Moving Average - Low) / Moving Average × 100
Sweep Depth Above % = (High - Moving Average) / Moving Average × 100
This condition helps distinguish a qualifying penetration from a candle that merely touches or moves slightly beyond the moving average.
SWEEP ABOVE MOVING AVERAGE
A candle qualifies as a Sweep Above when all of the following conditions are satisfied:
The entire candle body remains at or below the moving average.
The upper wick crosses above the moving average.
The complete upper wick meets or exceeds the selected Minimum Wick Length.
The distance from the moving average to the candle High meets or exceeds the Minimum Sweep Depth Beyond MA.
The selected direction settings allow sweeps above the moving average.
When all conditions are satisfied, a downward triangle is plotted above the candle.
SWEEP BELOW MOVING AVERAGE
A candle qualifies as a Sweep Below when all of the following conditions are satisfied:
The entire candle body remains at or above the moving average.
The lower wick crosses below the moving average.
The complete lower wick meets or exceeds the selected Minimum Wick Length.
The distance from the moving average to the candle Low meets or exceeds the Minimum Sweep Depth Beyond MA.
The selected direction settings allow sweeps below the moving average.
When all conditions are satisfied, an upward triangle is plotted below the candle.
WHY BODY POSITION MATTERS
The candle body is intentionally required to remain on the original side of the moving average.
A candle whose body crosses through the moving average represents a different type of interaction from a candle that penetrates the level only with its wick.
For this reason:
Sweep Above → Body remains below the MA.
Sweep Below → Body remains above the MA.
This allows the indicator to focus specifically on wick-based interactions rather than classifying every candle that crosses a moving average as a sweep.
WHY WICK LENGTH AND SWEEP DEPTH ARE SEPARATE
Consider a candle with a large lower wick.
The candle may satisfy the Minimum Wick Length requirement while extending only slightly below the moving average.
Without an additional depth requirement, a shallow interaction could qualify solely because the candle happened to have a long wick.
The Minimum Sweep Depth Beyond MA solves this by requiring price to travel a separately defined minimum distance beyond the moving average.
Therefore:
Wick Length measures the wick itself.
Sweep Depth measures the penetration beyond the moving average.
A qualifying signal must satisfy both.
SWEEP DIRECTION
The indicator allows users to select:
Both - Detect interactions above and below the moving average.
Above MA - Detect only sweeps above the moving average.
Below MA - Detect only sweeps below the moving average.
CANDLE CLOSE CONFIRMATION
The Confirm only after candle close option determines whether the script waits for the current candle to close before confirming a signal.
When enabled, a sweep is marked only after the bar is confirmed.
This is particularly relevant because the High, Low and Close of an active candle can continue changing before the candle closes.
VISUAL SETTINGS
Users can customize:
Whether the moving average is displayed.
Moving Average color.
Moving Average width.
Sweep marker color.
The plotted moving average corresponds directly to the dynamic reference used by the sweep calculations.
HOW TO USE
A basic workflow is:
Select EMA or SMA.
Choose the Moving Average Length.
Select the Moving Average Source.
Define the Minimum Wick Length.
Define the Minimum Sweep Depth Beyond MA.
Choose whether to detect sweeps above, below, or in both directions.
Optionally require candle-close confirmation.
Evaluate qualifying interactions within the context of the user's own trading methodology.
EXAMPLE
Suppose a trader selects a 200 EMA.
A candle trades below the EMA and its upper wick extends through it.
Crossing the EMA alone does not produce a signal.
For the candle to qualify as a Sweep Above:
Its complete body must remain at or below the EMA.
Its upper wick must cross the EMA.
Its complete upper wick must satisfy the Minimum Wick Length.
The portion extending beyond the EMA must satisfy the Minimum Sweep Depth Beyond MA.
Only when all conditions are satisfied does the indicator plot the sweep marker.
ORIGINALITY AND PURPOSE
This indicator is not intended to introduce another moving-average crossover system.
The moving average serves only as a dynamically changing reference level.
The script's primary functionality is the classification of candle interactions around that reference using three independent structural conditions:
Candle-body position relative to the moving average.
Minimum total wick length.
Minimum penetration depth beyond the moving average.
Separating total wick length from actual penetration depth is particularly important because the two measurements describe different characteristics of the candle.
This combination allows users to define a consistent threshold for wick-based interactions with dynamic EMA or SMA levels rather than treating every touch, crossover, or wick penetration as equivalent.
ALERTS
Alert conditions are included for:
Liquidity Sweep Above MA
Liquidity Sweep Below MA
The alerts use the same conditions as the corresponding visual markers.
IMPORTANT NOTES AND LIMITATIONS
The term "Liquidity Sweep" in this indicator describes a candle interaction that satisfies the quantitative rules defined above.
The indicator does not observe the exchange order book and therefore does not confirm the presence of resting orders, stop-loss concentrations, institutional orders, or actual available liquidity at the moving average.
Likewise, an EMA or SMA is not inherently a liquidity level.
The moving average is used by this script as a dynamic reference selected by the user for evaluating wick behavior.
A qualifying sweep does not predict that price will reverse, continue, or produce a profitable trading opportunity.
Moving averages, volatility and candle characteristics can behave differently across assets and timeframes. Parameters should therefore be evaluated specifically for the market, timeframe and methodology in which they are intended to be used.
This indicator does not provide Buy or Sell signals and does not guarantee future market behavior. مؤشر

CPI Gate Regime v3.1 (SMA)CPI Gate Regime v3.1 (SMA)
A daily trend + macro-regime dashboard built for trading TQQQ, using QQQ as the regime instrument. The trend signal runs on the TQQQ chart you apply it to; the bear-market classifier deliberately measures the underlying index (QQQ), because the index defines the market regime while the leveraged ETF is only the vehicle.
What chart to use it on
Apply it to the TQQQ daily chart (or another QQQ-tracking vehicle you trade). The moving-average signal computes on the chart symbol — on TQQQ, the lines are TQQQ's own 200-day and 20-day SMAs. The bear latch, however, always reads QQQ's drawdown, regardless of chart symbol. This is intentional: a −15% drawdown in QQQ corresponds to roughly a −40% move in TQQQ, and measuring the regime on the noisier 3x series would latch it on ordinary corrections. Index for the regime, leveraged ETF for the trade.
The idea
Not all bear markets are the same shape. Fast crashes in low-inflation environments (2018, 2020) tend to V-bottom, and a fast re-entry catches the recovery early. Grinding bears in high-inflation environments (2000–02, 2022) chop down for months, and the same fast re-entry buys every failed rally. The differentiator used here: when CPI is above ~3%, the central bank is constrained (cutting into hot inflation is hard), so declines are more likely to grind. When CPI is below 3%, policy support is available and declines are more likely to snap back.
Trend signal (two-speed, on the chart symbol — TQQQ)
200-day and 20-day simple moving averages of the daily close, computed on daily bars regardless of chart timeframe. Lines plot green when the close is above them, red when below.
The rule: LONG when the close is above the 200-day SMA, or (below it) above the 20-day SMA; FLAT only below both. Above the 200-day the position is locked long and the 20-day is ignored — the fast line only becomes active below the 200, where it serves as the early re-entry during a recovery.
In a latched GRIND bear (see below), the 20-day re-entry is disabled entirely — only a full 200-day reclaim signals a buy.
Signals on the chart
Exactly two marker types, printed only when the complete system flips: a green BUY label below the bar, a red SELL label above it. No markers on ordinary 20-day crosses (they don't change the position above the 200-day), and no markers on 20-day re-entries during a grind bear (the system refuses those trades). What you see marked is what the rule set actually does. Signals form on the daily close; execution is assumed at the next open.
The latched bear regime (the "CPI gate", on QQQ)
A bear LATCHES when QQQ closes 15% or more below its trailing 2-year high.
At that moment — once — the classifier checks CPI YoY: above the gate (default 3%) = GRIND, below = SNAP.
Latched means latched: the mode does not flip-flop with daily data. One-way upgrade only: SNAP can become GRIND if CPI heats up mid-bear, never the reverse.
The latch releases when QQQ recovers to within 5% of its 2-year high.
Effect on signals: GRIND kills the fast re-entry (200-day reclaim only); SNAP keeps the normal two-speed.
Dashboard (early warnings, top right)
CPI YoY vs the gate (ECONOMICS:USIRYY)
FINRA margin debt YoY — manual input; elevated / blow-off thresholds
High-yield credit spread (FRED:BAMLH0A0HYM2) — waking / stress thresholds
QQQ drawdown from its 2-year peak — heads-up at −10%, trigger at −15%
Regime label escalates: CALM → FRAGILITY BUILDING (hot CPI + elevated margin) → STRESS IGNITING (credit spreads waking) → BEAR: SNAP or GRIND (latched)
Only the −15% / CPI latch changes the signals; the other rows are context so a latch never arrives as a surprise.
Inputs
All thresholds are configurable: SMA lengths, CPI gate %, margin elevated/blow-off %, HY spread waking/stress (bps), drawdown heads-up/trigger %, and the CPI / HY spread symbols. Margin debt YoY is entered manually (FINRA publishes monthly).
Notes
Designed on daily bars; on intraday charts the signal stays locked to daily data. The bear-latch state on historical bars is computed from the chart's loaded history, so labels at the far left edge of a short history may differ from a fully loaded chart; current-bar state is unaffected. For educational purposes — this is a regime framework, not financial advice. Test any rule set yourself before trading it.
v3.1 — markers now show only full-system BUY/SELL signals (including the grind-bear gate); removed the 20-day cross dots and 200-day flip triangles. مؤشر

TRADLEWARE-DCA+Trend ETF
DCA + Trend: Monthly Contributions with a Bear-Market Exit and Dip-Ladder Re-entry
This strategy treats "putting money in every month" and "managing the pile of money already invested" as two separate jobs. A fixed monthly contribution never stops, even in a bear market — but the accumulated stack gets pulled out entirely when the long-term trend breaks, and put back to work gradually as the market recovers rather than all at once.
The target here is beating plain monthly dollar-cost averaging, not simple buy-and-hold. On broad-market ETFs, which tend to trend upward over long horizons, DCA already captures much of the benefit of buying dips just by staying systematic — a real bar to clear, not a strawman. It's also the one this strategy has consistently cleared across every asset tested so far (see Known limitations for where it falls short of buy-and-hold's raw return instead).
How it works
Every calendar month, a fixed dollar amount is invested, regardless of what the trend is doing — this means fixed dollars buy more shares exactly when the market is cheap, which is the whole point of dollar-cost averaging. Separately, a 200-day SMA acts as a trend filter for the accumulated position: when price closes below it, the entire stack built up so far is sold. When the trend recovers, that money doesn't necessarily go back in all at once — instead it can be split into tranches that buy in stages as price falls further below its prior peak during the bear market, so more of the recovery budget lands at genuinely lower prices instead of guessing the exact bottom.
Entry
Three separate mechanisms add to the position:
Monthly DCA: on the first bar of every calendar month, a fixed dollar amount is invested — by default, this keeps happening even during a bear market (can be turned off to pause contributions below the trend line instead)
Dip-ladder tranches: after a bear-market exit, the re-entry budget is split equally across up to three pieces, regardless of how deep each one triggers — each buys when price falls a further fixed percentage below the running all-time high (15%, 20%, and 30% below, by default) — this uses the all-time high as the reference level specifically because, unlike the moving average, it does not sink during the bear market
Lump sum recovery: any part of the re-entry budget that wasn't already spent by the dip-ladder tranches is deployed in one shot on the first bar the trend recovers
Exit
The entire accumulated position (not the monthly contributions still to come) is sold in full the moment price closes below the 200-day SMA — a trend-broken event, not something that unwinds gradually. An optional "death cross" confirmation (50-day SMA also below the 200-day SMA) can be required before treating a dip as a genuine bear market, which reduces false exits during brief pullbacks.
Parameters
SMA period: 200 days (the trend filter for the exit)
SMA hysteresis band: a dead zone around the SMA, on by default. The regime only flips bullish above SMA×(1+band) or bearish below SMA×(1-band); price sitting between those two lines just holds whatever state it was already in. This filters out marginal SMA crossings that would otherwise trigger an exit and re-entry over a move that never became a real trend break — most such round trips re-buy at close to the same price they sold at, paying costs without capturing anything. Set to 0 to require only a plain SMA cross.
Monthly DCA amount: fixed dollar amount invested on the first bar of each month
Lump re-entry percentage: how much of the value that was sold at the exit gets redeployed on recovery (0 = skip lump entirely and resume monthly DCA only; higher = more of the recovery captured, at the cost of more drawdown if the recovery turns out to be a false one)
Death cross confirmation: off by default; when enabled, requires the 50-day SMA below the 200-day SMA before treating the market as unsafe
DCA during bear regime: on by default; contributions keep buying through the bear market instead of pausing
Dip-ladder toggle and three rung levels (percentage below the running high): default 15%, 20%, 30% below; any rung can be set to 0 to disable it
Whole-share DCA: off by default. A fractional monthly quantity (contribution amount smaller than one share) rounds down to zero on most equity brokers and never fills or fires an alert. Turning this on banks any unspent contribution and carries it to the next month, firing a whole-share order once enough has accumulated
Label offset: how far the buy/sell trade labels sit from the bar, in multiples of ATR(14)
Chart labels
Every fill is marked directly on the chart: a green label below the bar for each buy (tagging which mechanism fired — DCA, LUMP, or RUNG 1/2/3, combined if more than one lands on the same bar) and a red label above the bar for each exit (CRASH EXIT or PERIOD END), showing the blended profit/loss across everything that closed on that bar. Since one crash exit can unwind dozens of separate monthly contributions and dip-ladder buys at once, the P&L shown is the combined result of all of them, not just one trade. Both label types also show the cash left in the account after that fill — useful for keeping an eye on how close the pool is to running dry, since TradingView blocks an order it can't cover and DCA/lump/rung buys stall until the next sale refills it.
Costs modelled
0% commission (typical for US equity brokers), 1 tick slippage, fills at next bar's open.
Intended assets and timeframe
Daily bars, US equity ETFs. Built and tested on MGK specifically, using the settings published as its defaults (death-cross confirmation off, rungs at 15/20/30% below the running high) — that combination is the only one checked end-to-end against a live TradingView run. Seven other broad-market, growth, value, equal-weight, and momentum funds — QQQ, VOO, IVW, IVE, RSP, SPYM, and SPMO — were also tested, each with its own settings rather than MGK's defaults left unchanged, and are very likely to beat plain monthly DCA too: that pattern held without exception on every asset checked so far. Their validated combination is different from what's published here — death-cross confirmation on and wider rungs at 20/30/40% — which is the better starting point if you switch tickers, with QQQ as the one exception even to that (see Known limitations): it pairs better with death-cross confirmation off and the hysteresis band set to 2% instead. Parameter choices matter more than they might look — death-cross on/off, the lump percentage, and the rung spacing have each swung the outcome by a wide margin in testing — so tuning for whichever asset and regime you're actually using, rather than leaving the MGK-tuned defaults unchanged, is worth the effort.
Known limitations
The exit reacts at the next bar's open after the trend breaks, so it lags fast crashes rather than anticipating them. In a slow, grinding bear market, the dip ladder's fixed rungs can all fire and the market can keep falling anyway, leaving a larger paper loss than the version without a ladder — the extra return the ladder aims to capture on recovery is paid for with real, and sometimes severe, worst-case pain during a prolonged decline. Size the lump and rung percentages to a drawdown you could actually hold through, not just a comfortable one. Bear-market DCA contributions can sit on paper losses for a long time before a recovery arrives. Switching to one of the other seven validated funds calls for different settings than the published MGK defaults — see Intended assets and timeframe above. QQQ specifically pairs better with the death-cross confirmation off and the hysteresis band at 2% rather than either of the other two combinations. For VOO, turning death-cross confirmation on is a genuine trade-off rather than a clear-cut fix: it gives a smaller drawdown and better Calmar ratio at the cost of slightly lower return and Sharpe. TradingView's own chart price does not include dividends, so a live TradingView backtest will differ somewhat from a dividend-adjusted one, though trade dates should still match. Over the published defaults' validated window, trade count sits below the sample size usually wanted for stable statistics — treat this as a directional result to build on, not a confirmed edge, until it's been checked over a longer window or across more of the validated assets.
If you already hold a lump-sum position and plan to add ongoing contributions on top of it, don't feed the lump into this strategy's own trading — a crash exit sells everything it holds at once, lump included, and testing found that dragged results down noticeably compared to keeping an existing lump in a separate buy-and-hold position and only running new contributions through this strategy. Even limited to just the ongoing contributions, though, this strategy's trading is not guaranteed to beat simply holding those same contributions — in the scenarios tested so far, plain buy-and-hold of the contributions matched or outperformed running them through the strategy's exit/re-entry logic. Treat this as a tool for managing how an existing trend-following thesis gets traded, not as a proven improvement over doing nothing.
استراتيجية

DNSE VN301!, SMA 34/89 Dual Slope Strategy "SMA 34/89 Dual Slope Trend Following" is a trend-following strategy designed to capture sustained directional price movements by identifying alignment between short-term and medium-term trend momentum. The strategy uses SMA(34) and SMA(89), generating Long signals when both moving averages are rising and Short signals when both are falling.
By requiring both SMA slopes to confirm the same direction, the strategy seeks to filter out weaker signals and avoid trades when short- and medium-term trends are not aligned. An optional SMA(200) trend filter provides an additional layer of broader trend confirmation. The strategy also includes configurable stop loss, take profit, trading session filters, and automatic end-of-session position closure for disciplined risk management.
Strategy settings and configuration:
Chart timeframe: recommended 2-minute chart
Position size: 3 contracts
Fast SMA length: 34
Slow SMA length: 89
SMA trend filter: disabled by default
Trend filter SMA length: 200
Stop loss: 10 points
Take profit: 20 points
Take profit: On / Off
Time filter: On / Off
Trading session: 09:00 – 14:30
Trade direction: Long / Short / Both
Signal arrows: disabled by default
Default script settings:
The strategy uses two main SMA lines: SMA(34) and SMA(89). SMA(34) reflects the short-term trend. SMA(89) represents the medium-term trend.
Unlike a traditional SMA crossover strategy, CNPS 03 does not wait for the two SMA lines to cross. Instead, the bot evaluates the slope of each SMA line to identify trend direction.
When SMA(34) is rising and SMA(89) is also rising, the bot confirms an uptrend. When SMA(34) is falling and SMA(89) is also falling, the bot confirms a downtrend.
The SMA(200) trend filter is disabled by default. This is because SMA(89) already acts as a medium-term trend component in the strategy. Users can still enable SMA(200) if they want a stricter trend filter.
When the SMA(200) trend filter is enabled, the script only allows Long trades when SMA(200) is rising and only allows Short trades when SMA(200) is falling.
Entry and exit rules:
Long entry:
SMA(34) is rising
AND SMA(89) is rising
AND SMA(200) is rising, if the SMA trend filter is enabled
AND the signal appears during the trading session
AND trade direction allows Long entries
Long exit:
Stop loss: 10 points from entry price
Take profit: 20 points from entry price, if enabled
Reversal when a valid Short signal appears
Close position when the SMA trend filter turns downward, if the SMA trend filter is enabled
Automatic position close at the end of the trading session
Short entry:
SMA(34) is falling
AND SMA(89) is falling
AND SMA(200) is falling, if the SMA trend filter is enabled
AND the signal appears during the trading session
AND trade direction allows Short entries
Short exit:
Stop loss: 10 points from entry price
Take profit: 20 points from entry price, if enabled
Reversal when a valid Long signal appears
Close position when the SMA trend filter turns upward, if the SMA trend filter is enabled
Automatic position close at the end of the trading session
Strategy logic:
CNPS 03 is suitable for market phases with clear trend direction. When both the fast SMA and the slow SMA are pointing in the same direction, the bot prioritizes trading in that direction.
This design allows the bot to react earlier than a traditional SMA crossover strategy. However, during sideways market conditions, the SMA slopes may change frequently. Users should test the strategy carefully before applying it to live trading.
Time filter:
The default trading session is 09:00 – 14:30, designed to avoid two abnormal volatility periods.
ATO 08:45 – 09:00 is the opening auction period. Price can gap strongly and technical signals may be noisy.
ATC and negotiated trading 14:30 – 15:00 is the closing auction period. Price can move sharply or reverse quickly.
Users can adjust the start time and end time in the bot settings.
Risk disclaimer:
Futures trading involves a high level of risk and prices can move sharply. This script is provided for reference, research, and backtesting purposes only. Users should fully understand derivatives trading, their own risk tolerance, and the strategy logic before applying it to live trading.
All investment decisions are the responsibility of the user. phaisinh.online is not responsible for any losses arising from the use of this strategy in real trading. Past performance does not guarantee future results.
__________________________________________________________
"SMA 34/89 Dual Slope Trend Following" là một chiến lược giao dịch theo xu hướng, được thiết kế nhằm nắm bắt các chuyển động giá có xu hướng kéo dài bằng cách xác định sự đồng thuận giữa xu hướng ngắn hạn và trung hạn. Chiến lược sử dụng SMA(34) và SMA(89), tạo tín hiệu Long khi cả hai đường trung bình động đều dốc lên và tín hiệu Short khi cả hai đều dốc xuống.
Bằng cách yêu cầu độ dốc của cả hai đường SMA xác nhận cùng một hướng, chiến lược hướng tới việc lọc các tín hiệu yếu và hạn chế giao dịch khi xu hướng ngắn hạn và trung hạn chưa đồng thuận. Bộ lọc xu hướng SMA(200) tùy chọn cung cấp thêm một lớp xác nhận xu hướng tổng thể. Chiến lược cũng bao gồm các tùy chọn Stop Loss, Take Profit, bộ lọc khung thời gian giao dịch và cơ chế tự động đóng vị thế khi kết thúc phiên, nhằm đảm bảo quản trị rủi ro một cách chặt chẽ và có kỷ luật.
Cài đặt & cấu hình chiến lược:
Biểu đồ: khuyến nghị khung 2 phút
Khối lượng giao dịch: 3 hợp đồng
Chu kỳ SMA nhanh: 34
Chu kỳ SMA chậm: 89
Bộ lọc xu hướng SMA: Tắt mặc định
Chu kỳ SMA bộ lọc: 200
Cắt lỗ: 10 điểm
Chốt lời: 20 điểm
Dùng chốt lời: Bật / Tắt
Bộ lọc giờ: Bật / Tắt
Khung giờ giao dịch: 09:00 – 14:30
Chiều giao dịch: Mua / Bán / Cả hai
Hiện mũi tên tín hiệu: Tắt mặc định
Cài đặt mặc định của script:
Chiến lược sử dụng hai đường SMA chính là SMA(34) và SMA(89). SMA(34) phản ánh xu hướng ngắn hạn. SMA(89) đại diện cho xu hướng trung hạn.
Khác với chiến lược giao cắt SMA thông thường, CNPS 03 không chờ hai đường SMA cắt nhau. Bot đánh giá độ dốc của từng đường SMA để xác định xu hướng.
Khi SMA(34) dốc lên và SMA(89) cũng dốc lên, bot xác nhận xu hướng tăng. Khi SMA(34) dốc xuống và SMA(89) cũng dốc xuống, bot xác nhận xu hướng giảm.
Bộ lọc xu hướng SMA(200) được để tắt mặc định. Lý do là SMA(89) đã đóng vai trò lọc xu hướng trung hạn trong chiến lược. Người dùng vẫn có thể bật thêm SMA(200) nếu muốn lọc xu hướng chặt hơn.
Khi bật bộ lọc SMA(200), script chỉ cho phép lệnh Mua khi SMA(200) dốc lên và chỉ cho phép lệnh Bán khi SMA(200) dốc xuống.
Điều kiện vào và thoát lệnh:
Vào lệnh Mua:
SMA(34) dốc lên
VÀ SMA(89) dốc lên
VÀ SMA(200) dốc lên, nếu bật bộ lọc xu hướng SMA
VÀ tín hiệu xuất hiện trong khung giờ giao dịch
VÀ chiều giao dịch cho phép lệnh Mua
Thoát lệnh Mua:
Cắt lỗ: 10 điểm từ giá vào lệnh
Chốt lời: 20 điểm từ giá vào lệnh, nếu bật
Đảo chiều khi xuất hiện tín hiệu Bán hợp lệ
Đóng lệnh khi SMA bộ lọc đảo chiều xuống, nếu bật bộ lọc xu hướng SMA
Tự động đóng lệnh khi hết khung giờ giao dịch
Vào lệnh Bán:
SMA(34) dốc xuống
VÀ SMA(89) dốc xuống
VÀ SMA(200) dốc xuống, nếu bật bộ lọc xu hướng SMA
VÀ tín hiệu xuất hiện trong khung giờ giao dịch
VÀ chiều giao dịch cho phép lệnh Bán
Thoát lệnh Bán:
Cắt lỗ: 10 điểm từ giá vào lệnh
Chốt lời: 20 điểm từ giá vào lệnh, nếu bật
Đảo chiều khi xuất hiện tín hiệu Mua hợp lệ
Đóng lệnh khi SMA bộ lọc đảo chiều lên, nếu bật bộ lọc xu hướng SMA
Tự động đóng lệnh khi hết khung giờ giao dịch
Logic chiến lược:
CNPS 03 phù hợp với các giai đoạn thị trường có xu hướng rõ ràng. Khi cả SMA nhanh và SMA chậm cùng nghiêng về một hướng, bot ưu tiên giao dịch theo hướng đó.
Thiết kế này giúp bot phản ứng sớm hơn so với chiến lược chờ giao cắt SMA truyền thống. Tuy nhiên, trong giai đoạn thị trường đi ngang, hai đường SMA có thể đổi độ dốc liên tục. Vì vậy, người dùng nên kiểm thử kỹ trước khi sử dụng thực tế.
Bộ lọc giờ:
Mặc định 09:00 – 14:30, nhằm tránh hai vùng biến động bất thường.
ATO 08:45 – 09:00 là giai đoạn khớp lệnh mở cửa. Giá thường có thể gap mạnh và tín hiệu kỹ thuật dễ bị nhiễu.
ATC và giao dịch thỏa thuận 14:30 – 15:00 là giai đoạn khớp lệnh đóng cửa. Giá có thể biến động mạnh hoặc đảo chiều nhanh.
Người dùng có thể điều chỉnh giờ bắt đầu và giờ kết thúc trong phần cài đặt bot.
Tuyên bố rủi ro:
Giao dịch hợp đồng tương lai có mức độ rủi ro cao và giá có thể biến động mạnh. Script này chỉ phục vụ mục đích tham khảo, nghiên cứu và kiểm thử. Người dùng cần hiểu rõ giao dịch phái sinh, khẩu vị rủi ro cá nhân và logic của chiến lược trước khi áp dụng vào giao dịch thực tế.
Mọi quyết định đầu tư thuộc trách nhiệm của người dùng. phaisinh.online không chịu trách nhiệm cho bất kỳ khoản lỗ nào phát sinh từ việc sử dụng chiến lược này trong giao dịch thực tế. Hiệu quả trong quá khứ không đảm bảo kết quả trong tương lai.
استراتيجية

Hybrid Breakout | VCP-Inspired TrendTrend Squeeze Breakout
Trend Squeeze Breakout is a trend-following momentum strategy designed to identify stocks in strong established uptrends that are consolidating into relatively tight trading ranges before attempting a breakout.
The strategy combines a simplified Minervini-style trend template, volatility contraction, volume confirmation, and stop-entry breakout execution. It is designed primarily for swing trading and is intended to participate in strong upward price expansions while filtering out many breakouts occurring in weak or declining trends.
Strategy Explanation
The strategy follows a simple sequence:
Identify a strong uptrend
A long setup requires:
Price above the 50-period SMA
50 SMA above the 150 SMA
150 SMA above the 200 SMA
200 SMA rising
200 SMA continuing to rise over the selected lookback period
50 SMA not declining
This establishes that the stock is already in a structurally bullish environment before considering an entry.
Identify a volatility contraction
The strategy looks for periods where recent price movement has become unusually tight.
It evaluates both:
Recent high-low range
Recent closing-price range
The high-low range is also compared with its historical percentile over the selected lookback period. This allows the strategy to identify relatively quiet consolidation periods rather than relying on a fixed volatility threshold alone.
Confirm volume
When the volume filter is enabled, breakout volume must exceed the moving-average volume baseline by the selected multiplier.
The default requirement is:
Volume > 20-period average volume × 1.2
This is intended to provide additional confirmation that the breakout is supported by meaningful participation.
Enter on a breakout
When the trend, contraction, and volume conditions are satisfied, the strategy places a stop-entry order above the recent high.
The default breakout lookback is 3 bars, allowing the strategy to attempt to enter as price moves through the recent consolidation high rather than simply buying while the stock remains inside the range.
Manage the position
Positions use tiered profit-taking:
25% closed at +10%
50% closed at +20%
Remaining position closed at +30%
Default stop loss at -8%
This allows the strategy to realize some profits during the initial move while maintaining exposure to larger momentum extensions.
Features
Trend Filter — 50/150/200 SMA bullish alignment
Long-Term Trend Confirmation — Requires the 200 SMA to be rising
Volatility Squeeze Detection — Identifies unusually tight recent ranges
Range Percentile Filter — Compares current volatility with historical volatility
Close-Range Filter — Detects tight price consolidation
Volume Confirmation — Optional volume expansion requirement
Stop-Entry Breakout — Enters only when price breaks the recent high
Tiered Profit Taking — Three configurable profit targets
Percentage-Based Stop Loss — Adjustable downside protection
Date Filter — Allows users to restrict backtests to a specific period
Configurable Parameters — Trend, volatility, volume, breakout, and risk settings can all be adjusted
Tips for Use
Use on liquid stocks
The strategy is generally better suited to liquid stocks and ETFs with sufficient trading volume. Extremely illiquid securities can produce unrealistic backtest results because of spreads and execution differences.
Start with daily charts
The strategy is particularly suited to identifying multi-day or multi-week momentum breakouts. Daily charts are a good starting point when evaluating the strategy.
Avoid optimizing every parameter
The many adjustable parameters make it possible to overfit the strategy to a particular stock or historical period. Test parameter changes across multiple securities and different market environments rather than optimizing exclusively for one chart.
Treat the volume filter as confirmation, not a guarantee
High volume can strengthen a breakout signal, but it does not guarantee that the breakout will succeed.
Test across different market conditions
Trend-following breakout systems typically perform differently during strong bull markets, corrections, sideways markets, and high-volatility periods. Evaluate results across multiple market regimes before relying on the strategy.
Pay attention to execution
The strategy uses stop-entry orders above recent highs. In live trading, gaps, slippage, spreads, and intrabar price movement can cause actual execution prices to differ from backtested results.
Important Note
This strategy is inspired by trend-template and volatility-contraction concepts, but it is not a complete implementation of a textbook VCP. It uses a simplified statistical contraction model rather than explicitly identifying multiple successive contractions, contraction depths, and their associated volume characteristics.
Backtest results are hypothetical and do not guarantee future performance. Always consider commissions, slippage, liquidity, position sizing, and market conditions when evaluating a strategy.
Recommended starting configuration: Daily timeframe, liquid stocks, default trend filter, volume confirmation enabled, and the default tiered risk-management settings.
استراتيجية

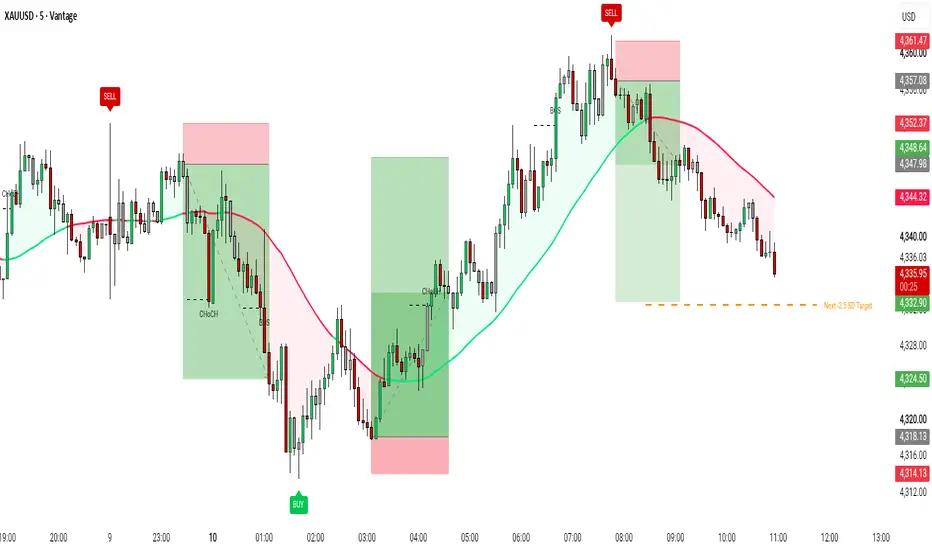
SMC Institutional Clean Wave & Structure PROSMC Institutional Clean Wave & Structure PRO
SMC Institutional Clean Wave & Structure PRO is a refined technical analysis indicator engineered to provide institutional order flow insights, precise market structure tracking, and uncluttered visual clarity on both light and dark trading themes. It replaces unnecessary chart noise with clean dynamic trend wave fills, smart consolidation candle color detection, and confirmed structure shifts.
Key Features Overview
1. Dynamic Single Trend Wave & Background Fill
Provides a smooth continuous structural trend wave. Renders vibrant green during bullish expansion phases and solid red during bearish contraction phases with a soft, unobtrusive background fill.
2. Smart Consolidation Candle Engine
Automatically highlights price action state. Bullish candles render in bright green, bearish candles in red, while tight consolidation or inside bar candles dynamically shift to a distinct grayish-white color to quickly highlight market compression.
3. Clean Market Structure Shifts (BOS & CHoCH)
Tracks key market structure breakouts. Identifies initial trend reversals as Change of Character (CHoCH) and structural extensions as Break of Structure (BOS), rendered with centered non-overlapping labels.
4. Confirmed Major Swing BUY & SELL Badges
Highlights major institutional high and low pivots with confirmed BUY and SELL badges. Pivot sensitivity and badge styling can be customized independently.
5. Target Standard Deviation Level (-2.5 SD)
Calculates real-time structural volatility and projects a dynamic -2.5 Standard Deviation Target line to help anticipate key potential market reaction levels.
Settings Overview
Trend Wave Settings
- Show Trend Wave Line: Toggle wave line and fill display.
- Colors & Opacity: Adjust trend line colors and background opacity.
Candle Engine Settings
- Enable Smart Candle Color Engine: Toggle adaptive candle colors.
- Custom Colors: Define unique colors for bullish, bearish, and inside bars.
Structure Settings
- Show BOS & CHoCH Shifts: Toggle structure labels.
- Structure Sensitivity: Fine-tune pivot detection rules for cleaner charts.
Signal Badges
- Show Confirmed BUY / SELL Badges: Toggle buy and sell markers.
- Signal Swing Sensitivity: Adjust lookback periods for pivot signals.
Standard Deviation Settings
- Show -2.5 SD Target Line: Toggle volatility target line.
- Custom Style: Adjust line thickness, color, and line style options.
Disclaimer
This script is built strictly for educational, analytical, and charting enhancement purposes. It does not offer financial advice or guaranteed trading results. Practice strict risk management.
مؤشر

DNSE VN301!, Bollinger Bands Break Out Strategy "Bollinger Bands Breakout with SMA Trend Filter" is a volatility breakout strategy designed to capture strong directional price movements when price breaks outside its recent trading range. The strategy uses Bollinger Bands, constructed from an SMA(20) and two standard deviations, to identify bullish breakouts when price closes above the upper band and bearish breakouts when price closes below the lower band.
To improve signal quality, the strategy incorporates an optional SMA(200) trend filter, allowing Long trades only when the SMA is rising and Short trades only when it is falling. By combining volatility-based breakout signals with long-term trend confirmation, the strategy seeks to reduce false breakouts during ranging markets while participating in sustained intraday trends. It also includes configurable stop loss, take profit, trading session filters, automatic end-of-day position closure, and trend reversal exits for disciplined risk management.
Strategy settings and configuration:
Chart timeframe: recommended 5-minute chart
Position size: 3 contracts
Bollinger Bands length: 20
Bollinger Bands multiplier: 2.0
SMA length: 200
Stop loss: 10 points
Take profit: disabled
SMA trend filter: On / Off
Take profit: On / Off
Time filter: On / Off
Trading session: 09:00 – 14:30
Trade direction: Long / Short / Both
Default script settings:
The strategy calculates Bollinger Bands using the SMA(20) of the closing price. The upper and lower bands are created by adding or subtracting two standard deviations around the middle line.
When volatility increases, the Bollinger Bands expand. When the market is quiet or moving sideways, the bands contract.
When the closing price breaks above the upper Bollinger Band, buying pressure may be taking control. When the closing price breaks below the lower Bollinger Band, selling pressure may be taking control.
When the SMA(200) trend filter is enabled, the script only allows Long trades when SMA(200) is rising and only allows Short trades when SMA(200) is falling. When the SMA filter is disabled, the strategy can trade both directions based only on Bollinger Bands breakout signals.
Users can add the built-in Bollinger Bands indicator on TradingView with Length 20 and Multiplier 2.0 to visually monitor the signal on the price chart.
Entry and exit rules:
Long entry:
Closing price > upper Bollinger Band
AND SMA(200) is rising, if the SMA filter is enabled
AND the signal appears during the trading session
AND trade direction allows Long entries
Long exit:
Stop loss: 10 points from entry price
Take profit: disabled by default
Closing price touches or breaks below the lower Bollinger Band
SMA(200) turns downward, if the SMA filter is enabled
Reversal when a valid Short signal appears
Automatic position close at the end of the trading session
Short entry:
Closing price < lower Bollinger Band
AND SMA(200) is falling, if the SMA filter is enabled
AND the signal appears during the trading session
AND trade direction allows Short entries
Short exit:
Stop loss: 10 points from entry price
Take profit: disabled by default
Closing price touches or breaks above the upper Bollinger Band
SMA(200) turns upward, if the SMA filter is enabled
Reversal when a valid Long signal appears
Automatic position close at the end of the trading session
Risk disclaimer:
Futures trading involves a high level of risk and prices can move sharply. This script is provided for reference, research, and backtesting purposes only. Users should fully understand derivatives trading, their own risk tolerance, and the strategy logic before applying it to live trading.
All investment decisions are the responsibility of the user. phaisinh.online is not responsible for any losses arising from the use of this strategy in real trading. Past performance does not guarantee future results.
____________________________________________________________________
"Bollinger Bands Breakout với Bộ lọc Xu hướng SMA" là một chiến lược giao dịch theo xu hướng dựa trên sự bứt phá của biến động giá, được thiết kế nhằm nắm bắt các chuyển động mạnh theo một hướng khi giá vượt ra khỏi vùng dao động gần nhất. Chiến lược sử dụng Bollinger Bands, được xây dựng từ SMA(20) và 2 độ lệch chuẩn, để xác định tín hiệu mua khi giá đóng cửa vượt lên trên dải trên và tín hiệu bán khi giá đóng cửa xuống dưới dải dưới.
Để nâng cao chất lượng tín hiệu, chiến lược tích hợp bộ lọc xu hướng SMA(200) (có thể bật hoặc tắt), chỉ cho phép mở vị thế Long khi SMA đang dốc lên và vị thế Short khi SMA đang dốc xuống. Bằng cách kết hợp tín hiệu bứt phá theo biến động của Bollinger Bands với xác nhận xu hướng dài hạn, chiến lược hướng tới việc giảm thiểu các tín hiệu phá vỡ giả trong giai đoạn thị trường đi ngang, đồng thời tận dụng các xu hướng intraday kéo dài. Ngoài ra, chiến lược còn bao gồm các tùy chọn Stop Loss, Take Profit, bộ lọc khung thời gian giao dịch, cơ chế tự động đóng toàn bộ vị thế khi kết thúc phiên, cùng với điều kiện thoát lệnh khi xu hướng SMA đảo chiều, nhằm đảm bảo quản trị rủi ro một cách chặt chẽ và có kỷ luật.
Cài đặt & cấu hình chiến lược:
Biểu đồ: khuyến nghị khung 5 phút
Khối lượng giao dịch: 3 hợp đồng
Chu kỳ Bollinger Bands: 20
Hệ số nhân Bollinger Bands: 2.0
Chu kỳ SMA: 200
Cắt lỗ: 10 điểm
Chốt lời: tắt
Bộ lọc xu hướng SMA: Bật / Tắt
Dùng chốt lời: Bật / Tắt
Bộ lọc giờ: Bật / Tắt
Khung giờ giao dịch: 09:00 – 14:30
Chiều giao dịch: Mua / Bán / Cả hai
Cài đặt mặc định của script:
Chiến lược tính toán Bollinger Bands dựa trên đường SMA(20) của giá đóng cửa. Dải trên và dải dưới được tạo bằng cách cộng hoặc trừ hai độ lệch chuẩn quanh đường giữa.
Khi biến động tăng mạnh, hai dải Bollinger Bands sẽ mở rộng. Khi thị trường đi ngang hoặc biến động thấp, hai dải sẽ co hẹp lại.
Khi giá đóng cửa vượt lên trên dải trên Bollinger Bands, lực mua có thể đang chiếm ưu thế. Khi giá đóng cửa phá xuống dưới dải dưới Bollinger Bands, lực bán có thể đang chiếm ưu thế.
Khi bật bộ lọc xu hướng SMA(200), script chỉ cho phép lệnh Mua khi SMA(200) dốc lên và chỉ cho phép lệnh Bán khi SMA(200) dốc xuống. Khi tắt bộ lọc SMA, chiến lược có thể giao dịch cả hai chiều chỉ dựa trên tín hiệu breakout của Bollinger Bands.
Người dùng có thể thêm chỉ báo Bollinger Bands có sẵn trên TradingView với tham số Length 20 và Multiplier 2.0 để quan sát tín hiệu trực quan trên biểu đồ giá.
Điều kiện vào và thoát lệnh:
Vào lệnh Mua:
Giá đóng cửa > dải trên Bollinger Bands
VÀ SMA(200) dốc lên, nếu bật bộ lọc SMA
VÀ tín hiệu xuất hiện trong khung giờ giao dịch
VÀ chiều giao dịch cho phép lệnh Mua
Thoát lệnh Mua:
Cắt lỗ: 10 điểm từ giá vào lệnh
Chốt lời: không dùng theo mặc định
Giá đóng cửa chạm hoặc phá xuống dải dưới Bollinger Bands
SMA(200) đảo chiều xuống, nếu bật bộ lọc SMA
Đảo chiều khi xuất hiện tín hiệu Bán hợp lệ
Tự động đóng lệnh khi hết khung giờ giao dịch
Vào lệnh Bán:
Giá đóng cửa < dải dưới Bollinger Bands
VÀ SMA(200) dốc xuống, nếu bật bộ lọc SMA
VÀ tín hiệu xuất hiện trong khung giờ giao dịch
VÀ chiều giao dịch cho phép lệnh Bán
Thoát lệnh Bán:
Cắt lỗ: 10 điểm từ giá vào lệnh
Chốt lời: không dùng theo mặc định
Giá đóng cửa chạm hoặc phá lên dải trên Bollinger Bands
SMA(200) đảo chiều lên, nếu bật bộ lọc SMA
Đảo chiều khi xuất hiện tín hiệu Mua hợp lệ
Tự động đóng lệnh khi hết khung giờ giao dịch
Tuyên bố rủi ro:
Giao dịch hợp đồng tương lai có mức độ rủi ro cao và giá có thể biến động mạnh. Script này chỉ phục vụ mục đích tham khảo, nghiên cứu và kiểm thử. Người dùng cần hiểu rõ giao dịch phái sinh, khẩu vị rủi ro cá nhân và logic của chiến lược trước khi áp dụng vào giao dịch thực tế.
Mọi quyết định đầu tư thuộc trách nhiệm của người dùng. phaisinh.online không chịu trách nhiệm cho bất kỳ khoản lỗ nào phát sinh từ việc sử dụng chiến lược này trong giao dịch thực tế. Hiệu quả trong quá khứ không đảm bảo kết quả trong tương lai.
استراتيجية

Mean Reversion Half-Life & Spread Tracker [OnlyFibonacci] v3.0Mean Reversion Half-Life & Spread Tracker v3.0
A statistical mean-reversion oscillator for spread analysis — Z-Score normalization, closure-time tracking, confirmed signals, target price projection, and a real-time dashboard. Built in Pine Script v6.
This indicator is for educational and analytical purposes only. It does not constitute investment advice, financial advice, or a trading recommendation. Past signal performance does not guarantee future results. Always do your own research and manage risk responsibly.
---
What does this indicator do?
Mean Reversion Half-Life & Spread Tracker measures how far a price or spread has deviated from its statistical mean using a Z-Score oscillator . Beyond simple overbought/oversold readings, it tracks how long extreme deviations typically take to revert to zero, whether the current deviation is lasting longer than average, where price may revert if Z-Score returns to 0, and the historical success rate of confirmed signals.
Default mode: Asset vs Single Moving Average (Mean Reversion) — the chart symbol is normalized against a configurable SMA.
---
Core Features
Two Operational Modes
Asset vs SMA (default): Analyzes Close / SMA ratio for single-asset mean reversion
Pair Trading : Analyzes chart symbol (Asset A) divided by a secondary symbol (Asset B)
Z-Score Engine
Spread Ratio = Close/SMA or Close/Asset B
Z-Score = (Ratio − Rolling Mean) / Rolling Standard Deviation
Default lookback: 200 bars
EMA(3) smoothing applied to raw Z-Score to reduce whipsaw noise
Threshold Levels
Upper threshold: +2.3 (statistical overbought zone)
Lower threshold: −2.3 (statistical oversold zone)
Center line: 0.0 (equilibrium / mean)
Mean Closure Time
Tracks the average number of bars required for Z-Score to return to 0 after breaching ±2.3
Displays active spread duration in real time
Triggers a Time-Stop WARNING when duration exceeds the historical average
Confirmed Signal Logic
BUY : Smoothed Z-Score crosses above −2.3 and holds beyond the threshold for at least 1 full confirmed bar close (bullish mean reversion)
SELL : Smoothed Z-Score crosses below +2.3 and holds beyond the threshold for at least 1 full confirmed bar close (bearish mean reversion)
EXIT : Z-Score reaches 0, time-stop is triggered, or duration exceeds 2× average closure time
Signal Win Rate (%)
Historical success rate of confirmed signals
Win: Z-Score returns to 0 before exceeding 2× average closure time
Loss: Timeout or time-stop triggered before mean reversion completes
Target Price Level
Estimated chart price where Z-Score would equal 0
MA mode: RatioMean × SMA
Pair mode: RatioMean × Asset B price
Optional dynamic dashed projection line on the main chart while a signal is active
Visual Design (v3.0)
Dynamic gradient Z-Score line (red above 0, green below 0, neon tones at extremes)
Gradient-filled area between Z-Score and the zero line
Soft background glow in extreme zones
Modern dark-theme dashboard table with live status indicators
Built-in Alerts
Upper / Lower Threshold Breach
Time-Stop Warning
Bullish Mean Reversion BUY
Bearish Mean Reversion SELL
Signal EXIT
---
Dashboard Table
Live metrics displayed in the top-right corner:
Pair / Mode — active analysis configuration
Current Z-Score — real-time smoothed reading
Target Price Level — estimated Z=0 price
Avg Closure Time — historical mean reversion duration (bars)
Spread Duration — active deviation duration
Time-Stop Status — Normal or Warning
Signal Win Rate (%) — historical confirmed signal success rate
Status indicators: Normal, Active Trade, Warning.
---
How to Use
Add the indicator to your chart (separate oscillator pane).
In default Asset vs SMA mode, set the SMA length (default: 50).
For pair analysis, switch to Pair Trading mode and select Asset B.
Monitor the Z-Score panel:
Z > +2.3 → spread is statistically extended above mean (potential bearish mean reversion)
Z < −2.3 → spread is statistically extended below mean (potential bullish mean reversion)
Z ≈ 0 → statistical equilibrium
Compare Spread Duration against Avg Closure Time in the dashboard.
If Time-Stop shows WARNING, the deviation may be persisting longer than historically normal — review risk management.
Set alerts for threshold breaches, confirmed signals, and exits.
---
How to Interpret
Mean reversion concept : When price or spread reaches statistical extremes, it tends to revert toward its rolling mean over time.
Z-Score : Measures deviation in standard deviation units. ±2.3 represents a strong statistical extreme.
Avg Closure Time : How long past extreme deviations took to revert to zero. If current duration exceeds this, caution is warranted.
Target Price : A dynamic estimate of where price may revert if Z-Score normalizes — a reference level, not a guaranteed target.
Win Rate : A summary of past confirmed signal outcomes. Not a promise of future performance.
Gradient fill : Visually emphasizes the magnitude and direction of deviation from equilibrium.
Horizontal dashed line on the main chart (if enabled): Projects the estimated price level where Z-Score = 0 while a BUY or SELL signal is active. It updates dynamically and disappears on EXIT or target reached. Disable via Show Target Price Projection Line .
---
Recommended Use Cases
Single-asset mean reversion analysis vs SMA
Crypto, forex, and equity pair spread monitoring
Multi-timeframe confluence checks
Alert-based watchlist monitoring
Time-stop and duration-based risk awareness
---
Customizable Inputs
Mode, Asset B Symbol, MA Length
Z-Score Lookback (200), EMA Smoothing (3)
Upper/Lower Threshold (±2.3)
Signal Confirmation Bars (1–5)
Gradient Area Fill, Background Glow, Target Line, Dashboard
---
Important Notes
Non-repainting security calls: gaps_off, lookahead_off
This is an analysis tool — it does not execute trades automatically
Parameters may require optimization across different markets and timeframes
Win rate and closure time are based on historical data and may differ in live conditions
Always use proper position sizing and risk management
---
Keywords
Mean Reversion, Z-Score, Half-Life, Spread Tracker, Pair Trading, Statistical Arbitrage, Oscillator, SMA, Closure Time, Time-Stop, Pine Script v6, OnlyFibonacci
---
Developed with Pine Script v6. For analysis and education only. مؤشر

مؤشر

EMA 25/68 BIST30 Futures# EMA 25/68 BIST30 Futures
I developed this strategy to test a straightforward and easy-to-understand moving average system on the 15-minute chart of the BIST30 futures contract.
The system monitors crossovers between EMA 25 and EMA 68. A crossover alone is not sufficient to open a position. For a long setup, the highest price of the crossover candle is recorded. For a short setup, the lowest price of the crossover candle is recorded. The signal is confirmed only if price breaks this level within the following four bars. If confirmation does not occur within four bars, the setup is cancelled.
EMA 160 is used solely as a directional filter. Long positions are opened above EMA 160, while short positions are opened below EMA 160. The purpose of this filter is to avoid taking short- and medium-term moving average crossovers against the broader market trend.
If a position has not been stopped out before the end of the session, it is closed at the close of the 17:45 bar, which corresponds to the 18:00 session price. A new position, including one in the opposite direction, cannot be opened on the same bar in which an existing position is closed.
The strategy has been designed so that different parameter settings can be tested for educational and research purposes. Users can change the EMA lengths, the number of confirmation bars, the directional filter and the trailing stop percentage to examine how these variables affect the number of trades, win rate, profit factor and maximum drawdown.
When evaluating parameter changes, users should not focus solely on the highest net profit. It is also important to examine whether neighbouring parameter values produce similar results and whether performance remains consistent across different market periods.
The code avoids calculation methods that could introduce look-ahead bias. The entire entry bar is not treated as price movement that occurred after the position was opened. The trailing stop is calculated using data from a completed bar and becomes active no earlier than the following bar.
Commission and tax on commission are displayed as separate settings. By default, the strategy assumes a commission rate of 0.020% per order leg and a 5% tax applied to the commission. Together, these produce an effective cost of 0.021% per order leg.
If the commission or tax settings are changed, the effective cost per order leg displayed in the table at the top-right corner of the chart must also be entered under Strategy Settings → Properties → Commission.
The strategy was developed for the XU030D1! symbol on a 15-minute chart. Similar results should not be expected on different markets or timeframes. The data source, continuous contract settings, commission, slippage and Bar Magnifier preferences may all affect backtest results.
This strategy is shared for educational and research purposes only. Past performance does not guarantee similar results in the future and should not be used as the sole basis for making investment decisions.
EMA 25/68 BİST30 VADELİ
Bu stratejiyi BIST30 vadeli kontratın 15 dakikalık grafiğinde, mümkün olduğunca sade ve anlaşılır bir hareketli ortalama sistemi denemek için hazırladım.
Sistem EMA 25 ile EMA 68’in kesişmesini takip ediyor. Kesişim tek başına işlem açmak için yeterli değil. Long tarafta cross mumunun en yüksek, short tarafta ise en düşük fiyatı kaydediliyor. Fiyatın bu seviyeyi sonraki dört bar içinde geçmesi halinde sinyal teyit edilmiş sayılıyor. Dört bar içinde teyit gelmezse aday iptal ediliyor.
EMA 160 yalnızca yön filtresi olarak kullanılıyor. Long işlemler EMA 160’ın üzerinde, short işlemler EMA 160’ın altında açılıyor. Amaç, kısa ve orta vadeli ortalama kesişimlerini daha geniş trendin tersine kullanmamak.
Pozisyon seans sonuna kadar stop olmadıysa 17:45 barının kapanışında, yani 18:00 seans fiyatında kapatılır. Pozisyonun kapandığı bar içinde ters yönde yeni pozisyon açılmaz.
Strateji, eğitim ve araştırma amacıyla farklı parametrelerin sonuçlar üzerindeki etkisini incelemeye uygun olacak şekilde ayarlanabilir hazırlanmıştır. EMA uzunlukları, teyit barı sayısı, yön filtresi ve trailing stop oranı değiştirilerek işlem sayısı, kazanma oranı, kâr faktörü ve maksimum düşüş gibi ölçümlerin nasıl değiştiği karşılaştırılabilir. Parametreler değerlendirilirken yalnızca en yüksek net kâra odaklanmak yerine, komşu değerlerde de benzer sonuçların oluşup oluşmadığı ve farklı dönemlerde performansın korunup korunmadığı ayrıca incelenmelidir.
Kodda geleceği görmeye yol açabilecek hesaplama seçenekleri kullanılmadı. Giriş barının tamamı, pozisyon açıldıktan sonra oluşmuş bir fiyat hareketi gibi kabul edilmez. Trail seviyesi tamamlanan barın verileriyle hesaplanır ve en erken sonraki barda çalışır.
Komisyon ve komisyon vergisi ayarlarda ayrı ayrı gösterilir. Varsayılan olarak bacak başına yüzde 0,020 komisyon ve komisyon üzerinden yüzde 5 vergi kabul edilmiştir. Bu ikisinin efektif bacak maliyeti yüzde 0,021’dir. TradingView’in yerleşik komisyon alanı Pine kodunda dinamik bir inputa bağlanamadığı için bu değer değiştirildiğinde, Strateji Ayarları > Özellikler bölümündeki komisyon oranının da tabloda gösterilen efektif oranla aynı yapılması gerekir.
Strateji XU030D1! üzerinde 15 dakikalık grafik için hazırlanmıştır. Farklı piyasalarda veya zaman aralıklarında aynı sonucu vermesi beklenmemelidir. Bar Magnifier kullanımı, veri kaynağı, sürekli vade ayarları, komisyon ve kayma tercihleri backtest sonuçlarını değiştirebilir.
Bu çalışma eğitim ve araştırma amacıyla paylaşılmıştır. Geçmiş performans gelecekte aynı sonucun alınacağını göstermez ve tek başına yatırım kararı için kullanılmamalıdır.
استراتيجية

DNSE VN301!, MACD Cross Strategy"MACD Trend Following with SMA Trend Filter" is a momentum-based trend-following strategy designed to capture directional market moves as momentum begins to strengthen. The strategy uses the MACD indicator, with its standard parameters of Fast EMA(12), Slow EMA(26), and Signal EMA(9), to identify bullish signals when the MACD line crosses above the signal line and bearish signals when it crosses below.
To improve signal quality, the strategy incorporates an optional SMA(200) trend filter, allowing Long trades only when the SMA is rising and Short trades only when it is falling. By combining MACD momentum crossovers with long-term trend confirmation, the strategy seeks to reduce false signals during sideways market conditions while participating in sustained intraday trends. It also includes configurable stop loss, take profit, trading session filters, and automatic end-of-day position closure for disciplined risk management.
Strategy settings and configuration:
Chart timeframe: recommended 5-minute chart
Position size: 3 contracts
MACD fast length: 12
MACD slow length: 26
MACD signal length: 9
SMA length: 200
Stop loss: 10 points
Take profit: 30 points
SMA trend filter: On / Off
Take profit: On / Off
Time filter: On / Off
Trading session: 09:00 – 14:30
Trade direction: Long / Short / Both
Default script settings:
The strategy uses MACD(12,26,9). The MACD line is calculated from the difference between EMA(12) and EMA(26). The Signal line is the EMA(9) of the MACD line.
When MACD crosses above the Signal line, bullish momentum may be taking control. When MACD crosses below the Signal line, bearish momentum may be taking control.
When the SMA(200) trend filter is enabled, the script only allows Long trades when SMA(200) is rising and only allows Short trades when SMA(200) is falling. When the SMA filter is disabled, the strategy can trade both directions based only on MACD crossover signals.
Users can add the built-in MACD indicator on TradingView with settings 12, 26, 9 and source close to visually monitor the signal below the price chart.
Entry and exit rules:
Long entry:
MACD(12,26,9) crosses above the Signal line
AND SMA(200) is rising, if the SMA filter is enabled
AND the signal appears during the trading session
AND trade direction allows Long entries
Long exit:
Stop loss: 10 points from entry price
Take profit: 30 points from entry price, if enabled
MACD crosses below the Signal line
Reversal when a valid Short signal appears
Automatic position close at the end of the trading session
Short entry:
MACD(12,26,9) crosses below the Signal line
AND SMA(200) is falling, if the SMA filter is enabled
AND the signal appears during the trading session
AND trade direction allows Short entries
Short exit:
Stop loss: 10 points from entry price
Take profit: 30 points from entry price, if enabled
MACD crosses above the Signal line
Reversal when a valid Long signal appears
Automatic position close at the end of the trading session
Risk disclaimer:
Futures trading involves a high level of risk and prices can move sharply. This script is provided for reference, research, and backtesting purposes only. Users should fully understand derivatives trading, their own risk tolerance, and the strategy logic before applying it to live trading.
All investment decisions are the responsibility of the user. phaisinh.online is not responsible for any losses arising from the use of this strategy in real trading. Past performance does not guarantee future results.
___________________________________________________________________
"MACD Trend Following với Bộ lọc Xu hướng SMA" là một chiến lược giao dịch theo xu hướng dựa trên động lượng, được thiết kế nhằm nắm bắt các biến động giá theo một hướng khi động lượng thị trường bắt đầu gia tăng. Chiến lược sử dụng chỉ báo MACD với các tham số tiêu chuẩn gồm Fast EMA(12), Slow EMA(26) và Signal EMA(9) để xác định tín hiệu mua khi đường MACD cắt lên trên đường tín hiệu, và tín hiệu bán khi đường MACD cắt xuống dưới đường tín hiệu.
Để nâng cao chất lượng tín hiệu, chiến lược tích hợp bộ lọc xu hướng SMA(200) (có thể bật hoặc tắt), chỉ cho phép mở vị thế Long khi SMA đang dốc lên và vị thế Short khi SMA đang dốc xuống. Bằng cách kết hợp tín hiệu giao cắt động lượng của MACD với xác nhận xu hướng dài hạn, chiến lược hướng tới việc giảm thiểu các tín hiệu nhiễu trong giai đoạn thị trường đi ngang, đồng thời tận dụng các xu hướng intraday kéo dài. Ngoài ra, chiến lược còn bao gồm các tùy chọn Stop Loss, Take Profit, bộ lọc khung thời gian giao dịch, và cơ chế tự động đóng toàn bộ vị thế khi kết thúc phiên, nhằm đảm bảo quản trị rủi ro một cách chặt chẽ và có kỷ luật.
Cài đặt & cấu hình chiến lược:
Biểu đồ: khuyến nghị khung 5 phút
Khối lượng giao dịch: 3 hợp đồng
Chu kỳ nhanh MACD: 12
Chu kỳ chậm MACD: 26
Chu kỳ tín hiệu MACD: 9
Chu kỳ SMA: 200
Cắt lỗ: 10 điểm
Chốt lời: 30 điểm
Bộ lọc xu hướng SMA: Bật / Tắt
Dùng chốt lời: Bật / Tắt
Bộ lọc giờ: Bật / Tắt
Khung giờ giao dịch: 09:00 – 14:30
Chiều giao dịch: Mua / Bán / Cả hai
Cài đặt mặc định của script:
Chiến lược sử dụng MACD(12,26,9), trong đó đường MACD được tính từ chênh lệch giữa EMA(12) và EMA(26). Đường Signal là EMA(9) của chính đường MACD.
Khi MACD cắt lên đường Signal, động lượng tăng có thể đang chiếm ưu thế. Khi MACD cắt xuống đường Signal, động lượng giảm có thể đang chiếm ưu thế.
Khi bật bộ lọc xu hướng SMA(200), script chỉ cho phép lệnh Mua khi SMA(200) dốc lên và chỉ cho phép lệnh Bán khi SMA(200) dốc xuống. Khi tắt bộ lọc SMA, chiến lược có thể giao dịch cả hai chiều chỉ dựa trên tín hiệu giao cắt MACD.
Người dùng có thể thêm chỉ báo MACD có sẵn trên TradingView với tham số 12, 26, 9 và nguồn close để quan sát tín hiệu trực quan bên dưới biểu đồ giá.
Điều kiện vào và thoát lệnh:
Vào lệnh Mua:
MACD(12,26,9) cắt lên đường Signal
VÀ SMA(200) dốc lên, nếu bật bộ lọc SMA
VÀ tín hiệu xuất hiện trong khung giờ giao dịch
VÀ chiều giao dịch cho phép lệnh Mua
Thoát lệnh Mua:
Cắt lỗ: 10 điểm từ giá vào lệnh
Chốt lời: 30 điểm từ giá vào lệnh, nếu bật
MACD cắt xuống đường Signal
Đảo chiều khi xuất hiện tín hiệu Bán hợp lệ
Tự động đóng lệnh khi hết khung giờ giao dịch
Vào lệnh Bán:
MACD(12,26,9) cắt xuống đường Signal
VÀ SMA(200) dốc xuống, nếu bật bộ lọc SMA
VÀ tín hiệu xuất hiện trong khung giờ giao dịch
VÀ chiều giao dịch cho phép lệnh Bán
Thoát lệnh Bán:
Cắt lỗ: 10 điểm từ giá vào lệnh
Chốt lời: 30 điểm từ giá vào lệnh, nếu bật
MACD cắt lên đường Signal
Đảo chiều khi xuất hiện tín hiệu Mua hợp lệ
Tự động đóng lệnh khi hết khung giờ giao dịch
Tuyên bố rủi ro:
Giao dịch hợp đồng tương lai có mức độ rủi ro cao và giá có thể biến động mạnh. Script này chỉ phục vụ mục đích tham khảo, nghiên cứu và kiểm thử. Người dùng cần hiểu rõ giao dịch phái sinh, khẩu vị rủi ro cá nhân và logic của chiến lược trước khi áp dụng vào giao dịch thực tế.
Mọi quyết định đầu tư thuộc trách nhiệm của người dùng. phaisinh.online không chịu trách nhiệm cho bất kỳ khoản lỗ nào phát sinh từ việc sử dụng chiến lược này trong giao dịch thực tế. Hiệu quả trong quá khứ không đảm bảo kết quả trong tương lai.
استراتيجية

DNSE VN301!, Keltner Break Out Strategy"Keltner Channel Breakout with SMA Trend Filter" is a trend-following breakout strategy designed to capture strong directional price movements after volatility expansions. The strategy uses the Keltner Channel, constructed from an EMA(20) and ATR(10), to identify bullish breakouts when price closes above the upper channel and bearish breakouts when price closes below the lower channel.
To improve signal quality, the strategy incorporates an optional SMA(200) trend filter, allowing Long trades only when the SMA is rising and Short trades only when it is falling. By combining volatility-based breakout detection with long-term trend confirmation, the strategy seeks to reduce false signals during ranging markets while participating in sustained intraday trends. It also includes configurable stop loss, take profit, trading session filters, and automatic end-of-day position closure for disciplined risk management.
Strategy settings and configuration:
Chart timeframe: recommended 1-minute chart
Position size: 3 contracts
Keltner EMA length: 20
ATR length: 10
ATR multiplier: 2.0
SMA length: 200
Stop loss: 10 points
Take profit: 20 points
SMA trend filter: On / Off
Take profit: On / Off
Time filter: On / Off
Trading session: 09:00 – 14:30
Trade direction: Long / Short / Both
Default script settings:
The strategy calculates the Keltner Channel using EMA(20) and ATR(10). The upper band is calculated by adding ATR multiplied by 2.0 to EMA(20). The lower band is calculated by subtracting ATR multiplied by 2.0 from EMA(20).
When the closing price breaks above the upper Keltner band, buying pressure may be taking control. When the closing price breaks below the lower Keltner band, selling pressure may be taking control.
When the SMA(200) trend filter is enabled, the script only allows Long trades when SMA(200) is rising and only allows Short trades when SMA(200) is falling. When the SMA filter is disabled, the strategy can trade both directions based only on Keltner Channel breakout signals.
Entry and exit rules:
Long entry:
Closing price > Upper Keltner Channel band
AND SMA(200) is rising, if the SMA filter is enabled
AND the signal appears during the trading session
AND trade direction allows Long entries
Long exit:
Stop loss: 10 points from entry price
Take profit: 20 points from entry price, if enabled
Opposite breakout signal appears
Reversal when a valid Short signal appears
Automatic position close at the end of the trading session
Short entry:
Closing price < Lower Keltner Channel band
AND SMA(200) is falling, if the SMA filter is enabled
AND the signal appears during the trading session
AND trade direction allows Short entries
Short exit:
Stop loss: 10 points from entry price
Take profit: 20 points from entry price, if enabled
Opposite breakout signal appears
Reversal when a valid Long signal appears
Automatic position close at the end of the trading session
Risk disclaimer:
Futures trading involves a high level of risk and prices can move sharply. This script is provided for reference, research, and backtesting purposes only. Users should fully understand derivatives trading, their own risk tolerance, and the strategy logic before applying it to live trading.
All investment decisions are the responsibility of the user. phaisinh.online is not responsible for any losses arising from the use of this strategy in real trading. Past performance does not guarantee future results.
_____________________________________________________________________
"Keltner Channel Breakout với Bộ lọc Xu hướng SMA" là chiến lược giao dịch theo xu hướng (trend-following) được thiết kế để nắm bắt các nhịp biến động mạnh của giá sau khi thị trường mở rộng biên độ dao động. Chiến lược sử dụng Keltner Channel, được xây dựng từ EMA(20) và ATR(10), để xác định tín hiệu bứt phá tăng khi giá đóng cửa vượt lên trên dải trên và tín hiệu bứt phá giảm khi giá đóng cửa xuống dưới dải dưới của kênh.
Để nâng cao chất lượng tín hiệu, chiến lược tích hợp bộ lọc xu hướng SMA(200) (có thể bật/tắt), chỉ cho phép mở vị thế Long khi SMA đang hướng lên và vị thế Short khi SMA đang hướng xuống. Bằng cách kết hợp tín hiệu breakout dựa trên biến động với xác nhận xu hướng dài hạn, chiến lược hướng tới việc giảm các tín hiệu nhiễu trong giai đoạn thị trường đi ngang, đồng thời tận dụng hiệu quả các xu hướng mạnh trong giao dịch trong ngày. Ngoài ra, chiến lược còn hỗ trợ các tính năng quản trị rủi ro như Stop Loss, Take Profit, bộ lọc thời gian giao dịch và tự động đóng vị thế trước khi kết thúc phiên để tránh rủi ro qua đêm.
Cài đặt & cấu hình chiến lược:
Biểu đồ: khuyến nghị khung 1 phút
Khối lượng giao dịch: 3 hợp đồng
Chu kỳ EMA Keltner: 20
Chu kỳ ATR: 10
Hệ số nhân ATR: 2.0
Chu kỳ SMA: 200
Cắt lỗ: 10 điểm
Chốt lời: 20 điểm
Bộ lọc xu hướng SMA: Bật / Tắt
Dùng chốt lời: Bật / Tắt
Bộ lọc giờ: Bật / Tắt
Khung giờ giao dịch: 09:00 – 14:30
Chiều giao dịch: Mua / Bán / Cả hai
Cài đặt mặc định của script:
Chiến lược tính toán Keltner Channel dựa trên đường EMA(20) và độ biến động ATR(10). Dải trên được tính bằng EMA(20) cộng ATR nhân hệ số 2.0. Dải dưới được tính bằng EMA(20) trừ ATR nhân hệ số 2.0.
Khi giá đóng cửa vượt lên trên dải trên Keltner, lực mua có thể đang chiếm ưu thế. Khi giá đóng cửa phá xuống dưới dải dưới Keltner, lực bán có thể đang chiếm ưu thế.
Khi bật bộ lọc xu hướng SMA(200), script chỉ cho phép lệnh Mua khi SMA(200) dốc lên và chỉ cho phép lệnh Bán khi SMA(200) dốc xuống. Khi tắt bộ lọc SMA, chiến lược có thể giao dịch cả hai chiều chỉ dựa trên tín hiệu breakout của Keltner Channel.
Điều kiện vào và thoát lệnh:
Vào lệnh Mua:
Giá đóng cửa > Dải trên Keltner Channel
VÀ SMA(200) dốc lên, nếu bật bộ lọc SMA
VÀ tín hiệu xuất hiện trong khung giờ giao dịch
VÀ chiều giao dịch cho phép lệnh Mua
Thoát lệnh Mua:
Cắt lỗ: 10 điểm từ giá vào lệnh
Chốt lời: 20 điểm từ giá vào lệnh, nếu bật
Có tín hiệu breakout ngược chiều
Đảo chiều khi xuất hiện tín hiệu Bán hợp lệ
Tự động đóng lệnh khi hết khung giờ giao dịch
Vào lệnh Bán:
Giá đóng cửa < Dải dưới Keltner Channel
VÀ SMA(200) dốc xuống, nếu bật bộ lọc SMA
VÀ tín hiệu xuất hiện trong khung giờ giao dịch
VÀ chiều giao dịch cho phép lệnh Bán
Thoát lệnh Bán:
Cắt lỗ: 10 điểm từ giá vào lệnh
Chốt lời: 20 điểm từ giá vào lệnh, nếu bật
Có tín hiệu breakout ngược chiều
Đảo chiều khi xuất hiện tín hiệu Mua hợp lệ
Tự động đóng lệnh khi hết khung giờ giao dịch
Tuyên bố rủi ro:
Giao dịch hợp đồng tương lai có mức độ rủi ro cao và giá có thể biến động mạnh. Script này chỉ phục vụ mục đích tham khảo, nghiên cứu và kiểm thử. Người dùng cần hiểu rõ giao dịch phái sinh, khẩu vị rủi ro cá nhân và logic của chiến lược trước khi áp dụng vào giao dịch thực tế.
Mọi quyết định đầu tư thuộc trách nhiệm của người dùng. phaisinh.online không chịu trách nhiệm cho bất kỳ khoản lỗ nào phát sinh từ việc sử dụng chiến lược này trong giao dịch thực tế. Hiệu quả trong quá khứ không đảm bảo kết quả trong tương lai.
استراتيجية

DNSE VN301!, Donchian Break Out Strategy"Donchian Channel Breakout with SMA Trend Filter" is a trend-following breakout strategy designed to capture sustained price movements while filtering out low-probability signals. The Donchian Channel identifies breakouts by tracking the highest high and lowest low over a specified lookback period, generating potential entry signals when price closes outside the recent trading range. Because breakouts during sideways or low-volatility markets often fail, the strategy incorporates a Simple Moving Average (SMA) as a trend filter.
Long signals are prioritized when the SMA is rising, while Short signals are prioritized when the SMA is falling, ensuring trades align with the prevailing market trend. By combining breakout detection with trend confirmation, the strategy aims to reduce false breakouts and improve overall signal quality.
*By default: each VN Futures contract requires VND 30,000,000 of initial margin. The strategy assumes an initial capital of VND 100,000,000, resulting in a fixed position size of 3 contracts for each trading signal.
To better reflect real-market trading conditions, the backtest incorporates a commission of VND 10,000 per contract and a minimum slippage assumption of 3 ticks on every executed trade.
Settings & Strategy Configuration:
Chart: recommended 15-minute timeframe
Donchian Channel Period: 20
SMA Period: 200
Stop Loss: 10 points
Take Profit: 20 points
SMA Trend Filter: On / Off
Use Take Profit: On / Off
Time Filter: On / Off
Trading Session: 09:00 – 14:30
Trade Direction: Long / Short / Both
Default Script Settings:
The strategy calculates the upper and lower bands of the Donchian Channel using the selected lookback period. A breakout above the upper band may indicate buying pressure, while a breakout below the lower band may indicate selling pressure.
When the SMA(200) trend filter is enabled, the script only allows Long entries when SMA(200) is rising and only allows Short entries when SMA(200) is falling. When the SMA filter is disabled, the strategy can trade both directions based only on Donchian Channel breakout signals.
Entry & Exit Conditions:
Entry Long:
Close Price > Upper Donchian Channel
AND SMA(200) is rising, if the SMA filter is enabled
AND the signal appears within the selected trading session
AND Long trading is allowed by the trade direction setting
Exit Long:
Stop Loss: 10 points from entry price
Take Profit: 20 points from entry price, if enabled
Opposite Donchian breakout signal
Position reversal when a valid Short signal appears
Automatic close at the end of the trading session
Entry Short:
Close Price < Lower Donchian Channel
AND SMA(200) is falling, if the SMA filter is enabled
AND the signal appears within the selected trading session
AND Short trading is allowed by the trade direction setting
Exit Short:
Stop Loss: 10 points from entry price
Take Profit: 20 points from entry price, if enabled
Opposite Donchian breakout signal
Position reversal when a valid Long signal appears
Automatic close at the end of the trading session
Disclaimers:
Trading futures contracts carries a high degree of risk, and price movements can be highly volatile. This script is intended as a reference and research tool only. It should be used by individuals who understand futures trading, have assessed their own risk tolerance, and are knowledgeable about the strategy’s logic.
All investment decisions are the sole responsibility of the user. DNSE bears no liability for any potential losses incurred from applying this strategy in real trading. Past performance does not guarantee future results.
______________________________________________________________________
"Chiến lược Breakout Donchian Channel kết hợp bộ lọc xu hướng SMA" là một chiến lược giao dịch theo xu hướng, được thiết kế nhằm tận dụng các đợt bứt phá giá mạnh đồng thời giảm thiểu các tín hiệu nhiễu. Donchian Channel xác định các điểm breakout bằng cách theo dõi mức giá cao nhất và thấp nhất trong một khoảng thời gian xác định, từ đó tạo tín hiệu khi giá đóng cửa vượt ra khỏi vùng dao động gần nhất. Do các tín hiệu breakout trong giai đoạn thị trường đi ngang hoặc biến động thấp thường có xác suất thất bại cao, chiến lược sử dụng thêm đường trung bình động đơn giản (SMA) làm bộ lọc xu hướng.
Khi đường SMA đang dốc lên, chiến lược ưu tiên các tín hiệu Long; ngược lại, khi SMA dốc xuống, chiến lược ưu tiên các tín hiệu Short, giúp các lệnh giao dịch đi cùng xu hướng chính của thị trường. Bằng cách kết hợp tín hiệu breakout với xác nhận xu hướng, chiến lược hướng tới việc giảm các tín hiệu phá vỡ giả và nâng cao chất lượng giao dịch.
*Theo mặc định, mỗi hợp đồng VN Futures yêu cầu ký quỹ ban đầu là 30.000.000 VNĐ. Chiến lược giả định vốn ban đầu là 100.000.000 VNĐ, tương ứng với quy mô vị thế cố định là 3 hợp đồng cho mỗi tín hiệu giao dịch được tạo ra.
Để phản ánh sát hơn điều kiện giao dịch thực tế, kết quả kiểm định (backtest) được giả định với phí giao dịch là 10.000 VNĐ cho mỗi hợp đồng và độ trượt giá (slippage) tối thiểu là 3 bước giá (ticks) đối với mỗi lệnh được khớp.
Cài đặt & cấu hình chiến lược:
Biểu đồ: khuyến nghị khung 15 phút
Chu kỳ Donchian Channel: 20
Chu kỳ SMA: 200
Cắt lỗ: 10 điểm
Chốt lời: 20 điểm
Bộ lọc xu hướng SMA: Bật / Tắt
Dùng chốt lời: Bật / Tắt
Bộ lọc giờ: Bật / Tắt
Khung giờ giao dịch: 09:00 – 14:30
Chiều giao dịch: Mua / Bán / Cả hai
Cài đặt mặc định của script:
Chiến lược tính toán biên trên và biên dưới của Donchian Channel dựa trên chu kỳ được chọn. Khi giá phá lên biên trên, lực mua có thể đang chiếm ưu thế. Khi giá phá xuống biên dưới, lực bán có thể đang chiếm ưu thế.
Khi bật bộ lọc xu hướng SMA(200), script chỉ cho phép lệnh Mua khi SMA(200) dốc lên và chỉ cho phép lệnh Bán khi SMA(200) dốc xuống. Khi tắt bộ lọc SMA, chiến lược có thể giao dịch cả hai chiều chỉ dựa trên tín hiệu breakout của Donchian Channel.
Điều kiện vào và thoát lệnh:
Vào lệnh Mua:
Giá đóng cửa > Biên trên Donchian Channel
VÀ SMA(200) dốc lên, nếu bật bộ lọc SMA
VÀ tín hiệu xuất hiện trong khung giờ giao dịch
VÀ chiều giao dịch cho phép lệnh Mua
Thoát lệnh Mua:
Cắt lỗ: 10 điểm từ giá vào lệnh
Chốt lời: 20 điểm từ giá vào lệnh, nếu bật
Có tín hiệu breakout ngược chiều
Đảo chiều khi xuất hiện tín hiệu Bán hợp lệ
Tự động đóng lệnh khi hết khung giờ giao dịch
Vào lệnh Bán:
Giá đóng cửa < Biên dưới Donchian Channel
VÀ SMA(200) dốc xuống, nếu bật bộ lọc SMA
VÀ tín hiệu xuất hiện trong khung giờ giao dịch
VÀ chiều giao dịch cho phép lệnh Bán
Thoát lệnh Bán:
Cắt lỗ: 10 điểm từ giá vào lệnh
Chốt lời: 20 điểm từ giá vào lệnh, nếu bật
Có tín hiệu breakout ngược chiều
Đảo chiều khi xuất hiện tín hiệu Mua hợp lệ
Tự động đóng lệnh khi hết khung giờ giao dịch
Tuyên bố rủi ro:
Giao dịch hợp đồng tương lai có mức độ rủi ro cao và giá có thể biến động mạnh. Script này chỉ phục vụ mục đích tham khảo, nghiên cứu và kiểm thử. Người dùng cần hiểu rõ giao dịch phái sinh, khẩu vị rủi ro cá nhân và logic của chiến lược trước khi áp dụng vào giao dịch thực tế.
Mọi quyết định đầu tư thuộc trách nhiệm của người dùng. DNSE không chịu trách nhiệm cho bất kỳ khoản lỗ nào phát sinh từ việc sử dụng chiến lược này trong giao dịch thực tế. Hiệu quả trong quá khứ không đảm bảo kết quả trong tương lai.
استراتيجية

مؤشر