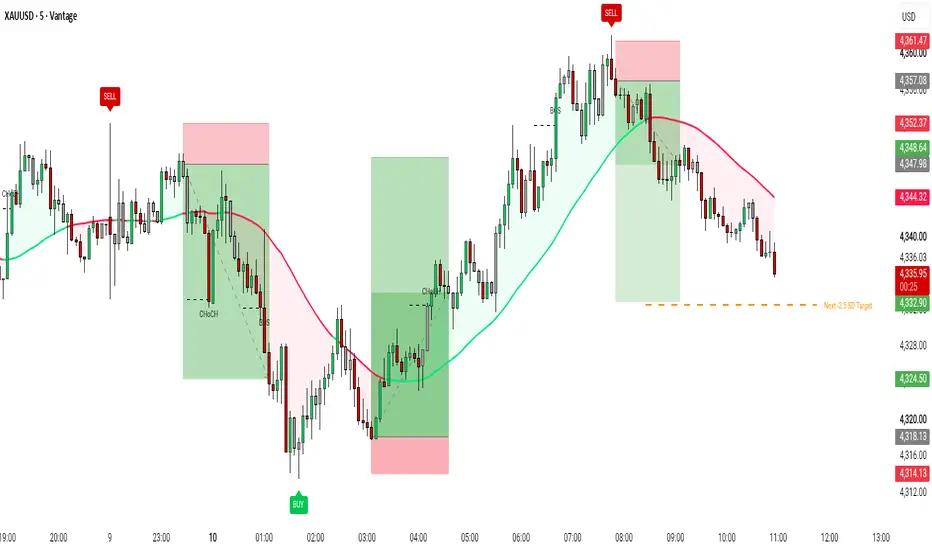
Triple Bottom/Top Patterns [The_lurker]╔═══════════════════════════════════════════════════════╗
Triple Bottom/Top Patterns
╚═══════════════════════════════════════════════════════╝
An indicator that detects Triple Bottom and Triple Top patterns and tracks every pattern from the moment its structure completes until its final resolution — with no repainting, and with symmetry limits that adapt to market volatility instead of fixed numbers.
The core idea: a pattern is not a shape you draw and abandon. It is an event with a beginning, a path, and an end — and this indicator tracks all three.
╔═══════════════════════════════════════════════════════╗
◆ WHAT SETS THIS INDICATOR APART
╚═══════════════════════════════════════════════════════╝
▌ 1 ─ No repainting, by structure rather than by promise
✕ Common: an "in progress" mode draws an unconfirmed third leg, so the shape shifts and is redrawn every time price moves. The pattern you see in history is not what was displayed at the time.
✓ Here: all seven points are confirmed price pivots, and every state change occurs on confirmed bar close. What you see today on an old bar is literally what was displayed when it appeared.
There is no "in progress" mode in this indicator — a deliberate choice, not a missing feature.
▌ 2 ─ Symmetry limits that adapt to volatility
✕ Common: a fixed percentage for the allowed difference between the ends.
The problem is that one percentage means radically different things:
▸ 1% on the 15-minute chart ≈ 3.6 volatility units ← far too loose
▸ 1% on the daily chart ≈ 0.26 volatility units ← far too strict
The same number delivers completely different precision depending on timeframe, while the user believes a single standard has been set.
✓ Here: the difference is measured in units of Average True Range at the moment of formation.
One number means the same thing on every timeframe, every instrument, and every market condition — from Bitcoin to low-priced altcoins, from the 1-minute to the weekly.
▌ 3 ─ A complete eight-state machine
✕ Common: the pattern is drawn, the breakout is announced, and its role ends.
✓ Here: every pattern travels a defined and declared path:
⏳ Awaiting breakout
✓ Pattern complete
🎯 Target reached
✕ Pattern failed
🔄 Reverse target reached
⌛ Waiting period expired
⌛ Complete, no target reached
⌛ Failed, no reverse target reached
▌ 4 ─ The two states you will not find elsewhere
✕ Common: the target line extends indefinitely. A pattern that broke out a year ago still has its line crawling across your chart today, with no answer to the question: was it reached or not?
✓ Here: every pattern has a defined time window to reach its target. If the window closes without a hit, the state is declared "Complete, no target" and the line freezes.
This prevents dead lines from accumulating, and gives an explicit answer instead of open silence.
▌ 5 ─ No resolution within the event bar itself
✕ Common: a pattern breaks out and the target is counted as reached in that same bar if price touched it.
The problem: the order of high, low, and close inside a single bar is unknown to any indicator. Price may have reached the target before closing above the neckline — that is, before the entry signal existed at all.
✓ Here: resolution is deferred by a full bar. A target can never be reached on the completion bar itself.
A small detail that separates honest tracking from optimistic tracking.
▌ 6 ─ Every point is a pivot, including the turning point and both mids
✕ Common: the intermediate points and the trend origin are taken as the raw highest or lowest value within a window.
The problem: a single stray wick can become a point in the pattern — and if it defines the neckline, the entire decisive level rests on noise.
✓ Here: all seven points are confirmed pivots. One wick cannot define a neckline.
▌ 7 ─ Tracking continues after failure
✕ Common: the pattern breaks down and is erased from the chart.
✓ Here: it breaks down and is fully recoloured — lines, fill, and labels — and a reverse target is computed and tracked with the same precision and the same time window.
Pattern failure is tradeable information, not the end of tracking.
▌ 8 ─ One pattern per zone
✕ Common: several overlapping patterns draw on top of one another, turning the chart into a tangled mesh.
✓ Here: when patterns overlap in time, only the one with the tightest symmetry remains. And a pattern that has completed or failed is never erased retroactively — it blocks a newcomer instead of being replaced by it.
The result: a clean chart, and a history that is not rewritten.
▌ 9 ─ Prior trend gate
A reversal pattern without a prior trend is not a reversal.
✓ The indicator requires the leg from the turning point to the first end to reach a defined multiple of the pattern's own height — and this requirement is what determines which pivot is selected as the turning point, so no arbitrary peak preceding the pattern gets picked up.
╔═══════════════════════════════════════════════════════╗
📐 PATTERN STRUCTURE: SEVEN POINTS
╚═══════════════════════════════════════════════════════╝
① Turning point ─ the last opposite pivot before the first end, where the prior trend reversed
②④⑥ The three ends ─ B1 · B2 · B3 or T1 · T2 · T3
confirmed pivots, aligned within a limit measured in volatility units
③⑤ The two mids ─ the separating highs in a Triple Bottom, or the separating lows in a Triple Top
▬▬ Neckline ─ the higher of the two mids in a Triple Bottom, the lower in a Triple Top
this is the level that defines pattern completion
⑦ Crossing point ─ where the final leg intersects the neckline on completion
Path: ① → ② → ③ → ④ → ⑤ → ⑥ → ⑦
╔═══════════════════════════════════════════════════════╗
🎯 TARGETS
╚═══════════════════════════════════════════════════════╝
The target is purely geometric: the pattern height — the distance between the neckline and the furthest end — projected from the breakout point.
▸ Conservative 0.618 of pattern height
▸ Balanced full pattern height
▸ Aggressive 1.618 of pattern height
An independent mode for each case: Bottom bullish target · Bottom bearish target on failure · Top bearish target · Top bullish target on failure.
The fill criterion is selectable:
▸ Touch ─ matches a limit order resting at the target
▸ Close ─ more conservative
╔═══════════════════════════════════════════════════════╗
⚙️ SETTINGS
╚═══════════════════════════════════════════════════════╝
▌ Pattern Detection
▸ Pivots left and right ─ pivot confirmation sensitivity
▸ Min arm length ─ minimum bars between each consecutive pair of points
▸ Ends symmetry ×ATR ─ the single most influential parameter
▸ Mids symmetry ×ATR ─ same unit, applied to the two intermediate points
▸ Min depth ×ATR ─ excludes shallow sideways chop
▸ Prior leg ×Pattern height ─ required strength of the preceding trend
▸ Trend length and lookback ─ search range for the turning point
▸ Extension multiplier ─ breakout waiting period, relative to pattern width
▌ Targets
▸ Target window ×Width ─ time allowed to reach the target. Zero = no expiry
▌ Visual
▸ Max live patterns per side ─ raise it on lower timeframes
▸ Independent colours per side: pattern · fill · text · label background
Transparency is set from the colour picker itself
╔═══════════════════════════════════════════════════════╗
🔔 ALERT
╚═══════════════════════════════════════════════════════╝
A single alert: Triple Pattern Complete.
▸ Fires when the neckline is broken on confirmed bar close
▸ Covers both bottoms and tops
▸ Once per pattern
▸ The message includes ticker, timeframe, and close price automatically
To create: alarm icon → select the indicator as source → choose the condition → set frequency to "Once Per Bar Close".
⚠ TradingView freezes the indicator settings at the moment the alert is created. If you change any setting afterwards, delete the alert and create it again.
╔═══════════════════════════════════════════════════════╗
📊 PRACTICAL USE
╚═══════════════════════════════════════════════════════╝
▸ The neckline is the decisive level. Before it is broken: a candidate structure. After: a completed event.
▸ The furthest end defines the invalidation point — a close below the lowest of the three bottoms, or above the highest of the three tops.
▸ The info table shows, for each side: target mode · target price · current state · pattern age in bars.
▸ The age field matters: a pattern fifty bars old is not the same as one five hundred bars old.
▸ Triple patterns are inherently rarer than double ones. If nothing appears on a higher timeframe, that is expected behaviour rather than a fault — raise the ends symmetry limit first, then review the prior trend gate.
╔═══════════════════════════════════════════════════════╗
⚠ DISCLOSURE AND LIMITATIONS
╚═══════════════════════════════════════════════════════╝
▸ This indicator is a visual analysis tool that organises how you read the market. It does not provide buy or sell recommendations, and it promises no results.
▸ Drawing correctness is one thing; pattern performance is another. The indicator draws patterns and tracks their events precisely, but the predictive ability of the pattern itself has not been tested statistically here and is not claimed.
▸ The search scope is limited to the last fifty pivots per side, so a very old pattern may not be detected.
▸ When the tracked-pattern budget fills, a live pattern may be replaced by a newer one. Raising "Max live patterns" reduces this.
▸ Use it within a complete trading approach that includes risk management, not as a sole source of decisions.
╔═══════════════════════════════════════════════════════╗
Triple Bottom/Top Patterns نماذج القيعان والقمم الثلاثية
╚═══════════════════════════════════════════════════════╝
مؤشر يكتشف نماذج القاع الثلاثي والقمة الثلاثية، ويتابع كل نموذج من لحظة اكتمال بنيته حتى حسمه النهائي — بلا إعادة رسم، وبحدود تماثل تتكيف مع تقلب السوق بدل أرقام ثابتة.
الفكرة المركزية: النموذج ليس شكلًا يُرسم ثم يُترك. هو حدث له بداية ومسار ونهاية، والمؤشر يتتبع الثلاثة.
╔═══════════════════════════════════════════════════════╗
◆ ما الذي يميز هذا المؤشر
╚═══════════════════════════════════════════════════════╝
▌ ١ ─ لا إعادة رسم، بضمانة بنيوية لا بوعد نصي
✕ الشائع: وضع "قيد التكوين" يرسم طرفًا ثالثًا غير مؤكد، فيتحرك الشكل ويُعاد رسمه كلما تحرك السعر. النموذج الذي تراه في التاريخ ليس ما كان معروضًا لحظتها.
✓ هنا: النقاط السبع كلها محاور سعرية مؤكدة، وكل تغييرات الحالة تقع تحت إغلاق الشمعة المؤكد. ما تراه اليوم على شمعة قديمة هو حرفيًا ما كان معروضًا وقت ظهوره.
لا يوجد وضع "قيد التكوين" في هذا المؤشر — وهذا اختيار مقصود، لا نقص.
▌ ٢ ─ حدود التماثل تتكيف مع التقلب
✕ الشائع: نسبة مئوية ثابتة للفارق المسموح بين الأطراف.
المشكلة أن النسبة الواحدة تعني أشياء مختلفة جذريًا:
▸ 1٪ على فريم 15 دقيقة ≈ 3.6 من وحدات التقلب ← متساهل جدًا
▸ 1٪ على الفريم اليومي ≈ 0.26 من وحدات التقلب ← صارم جدًا
أي أن نفس الرقم يعطي دقة مختلفة تمامًا حسب الفريم، والمستخدم يظن أنه ثبّت معيارًا واحدًا.
✓ هنا: الفارق يُقاس بوحدات المدى الحقيقي المتوسط عند لحظة التكوين.
الرقم الواحد يعني الشيء نفسه على كل فريم، وكل أصل، وكل حالة سوق — من البيتكوين إلى العملات منخفضة السعر، ومن الدقيقة إلى الأسبوعي.
▌ ٣ ─ آلة حالة كاملة من ثماني حالات
✕ الشائع: يرسم النموذج، يعلن الاختراق، وينتهي دوره.
✓ هنا: كل نموذج يمر بمسار محدد ومعلن:
⏳ انتظار الاختراق
✓ اكتمال النموذج
🎯 بلوغ الهدف
✕ فشل النموذج
🔄 بلوغ الهدف العكسي
⌛ انتهاء مدة الانتظار
⌛ اكتمال بلا بلوغ هدف
⌛ فشل بلا بلوغ هدف عكسي
▌ ٤ ─ الحالتان اللتان لا تجدهما في غيره
✕ الشائع: خط الهدف يمتد إلى ما لا نهاية. نموذج اخترق قبل سنة وما زال خطه يزحف على شارتك اليوم، بلا إجابة عن سؤال: هل وصل أم لا؟
✓ هنا: لكل نموذج نافذة زمنية محددة لبلوغ هدفه. إن انقضت بلا وصول، تُعلن الحالة "اكتمال بلا بلوغ هدف" ويتجمد الخط.
هذا يمنع تراكم خطوط ميتة، ويعطي إجابة صريحة بدل صمت مفتوح.
▌ ٥ ─ لا حسم في شمعة الحدث نفسها
✕ الشائع: النموذج يخترق ويُحسب الهدف متحققًا في نفس الشمعة إن لامسه السعر.
المشكلة: ترتيب الأعلى والأدنى والإغلاق داخل الشمعة الواحدة غير معلوم لأي مؤشر. ربما بلغ السعر الهدف قبل أن يغلق فوق العنق، أي قبل وجود إشارة الدخول أصلًا.
✓ هنا: الحسم يُؤجَّل شمعة كاملة. لا يمكن أن يتحقق هدف في شمعة الاكتمال نفسها.
تفصيل صغير يفصل بين متابعة صادقة وأخرى متفائلة.
▌ ٦ ─ كل النقاط محاور، بما فيها نقطة التحول والوسيطتان
✕ الشائع: النقاط الوسيطة ونقطة بداية الاتجاه تُؤخذ كأعلى أو أدنى قيمة خام في نافذة.
المشكلة: ذيل شمعة شارد قد يصبح نقطة في النموذج — وإن كان هو خط العنق، فالمستوى الحاسم كله مبني على ضجيج.
✓ هنا: النقاط السبع محاور مؤكدة. ذيل واحد لا يمكن أن يحدد خط عنق.
▌ ٧ ─ متابعة ما بعد الفشل
✕ الشائع: النموذج ينكسر فيُشطب من الشارت.
✓ هنا: ينكسر فيُعاد تلوينه بالكامل — الخطوط والتضليل والعلامات — ويُحسب له هدف عكسي يُتابع بنفس الدقة والنافذة الزمنية.
فشل النموذج معلومة تداولية، لا نهاية المتابعة.
▌ ٨ ─ نموذج واحد لكل منطقة
✕ الشائع: عدة نماذج متداخلة ترسم فوق بعضها فيتحول الشارت إلى شبكة متشابكة.
✓ هنا: عند تداخل زمني، يبقى الأدقّ تماثلًا فقط. والنموذج الذي اكتمل أو فشل لا يُمحى بأثر رجعي — يمنع ظهور نموذج جديد فوقه بدل أن يُستبدل به.
النتيجة: شارت نظيف، وتاريخ لا يُزوَّر.
▌ ٩ ─ بوابة الاتجاه السابق
النموذج الانعكاسي بلا اتجاه سابق ليس انعكاسًا.
✓ المؤشر يشترط أن يبلغ المسار من نقطة التحول إلى الطرف الأول مضاعفًا محددًا من ارتفاع النموذج نفسه — وهذا الشرط هو ما يحدد أي محور يُختار كنقطة تحول، فلا تُلتقط قمة عشوائية سبقت النموذج.
╔═══════════════════════════════════════════════════════╗
📐 بنية النموذج: سبع نقاط
╚═══════════════════════════════════════════════════════╝
① نقطة التحول ─ آخر محور مقابل قبل الطرف الأول، حيث انقلب الاتجاه السابق
②④⑥ الأطراف الثلاثة ─ B1 · B2 · B3 أو T1 · T2 · T3
محاور مؤكدة، متقاربة ضمن حد يُقاس بوحدات التقلب
③⑤ الوسيطتان ─ القمتان الفاصلتان في القاع الثلاثي، أو القاعان في القمة الثلاثية
▬▬ خط العنق ─ أعلى الوسيطتين في القاع الثلاثي، وأدناهما في القمة الثلاثية
هو المستوى الذي يحدد اكتمال النموذج
⑦ نقطة العبور ─ تقاطع الساق الأخيرة مع خط العنق عند الاكتمال
المسار: ① → ② → ③ → ④ → ⑤ → ⑥ → ⑦
╔═══════════════════════════════════════════════════════╗
🎯 الأهداف
╚═══════════════════════════════════════════════════════╝
الهدف هندسي بحت: ارتفاع النموذج — المسافة بين خط العنق وأبعد الأطراف — يُسقط من نقطة الاختراق.
▸ محافظ 0.618 من ارتفاع النموذج
▸ متوازن ارتفاع النموذج كاملًا
▸ عدواني 1.618 من ارتفاع النموذج
نمط مستقل لكل حالة: هدف القاع الصاعد · هدف القاع الهابط عند الفشل · هدف القمة الهابط · هدف القمة الصاعد عند الفشل.
معيار التحقق قابل للاختيار:
▸ لمسة السعر ─ يطابق تنفيذ أمر معلق عند الهدف
▸ إغلاق الشمعة ─ أكثر تحفظًا
╔═══════════════════════════════════════════════════════╗
⚙️ الإعدادات
╚═══════════════════════════════════════════════════════╝
▌ كشف النموذج
▸ شموع اليسار واليمين ─ حساسية تأكيد المحاور
▸ الحد الأدنى للذراع ─ أقل عدد شموع بين كل نقطتين متتاليتين
▸ تماثل الأطراف الثلاثة ×ATR ─ المعامل الأهم في المؤشر
▸ تماثل الوسيطين ×ATR ─ نفس الوحدة، للنقطتين الوسيطتين
▸ أدنى عمق للنموذج ×ATR ─ يستبعد التذبذبات الجانبية الضحلة
▸ ارتفاع الاتجاه ×ارتفاع النموذج ─ قوة المسار السابق المطلوبة
▸ طول المسار ومدى البحث ─ نطاق البحث عن نقطة التحول
▸ معامل التمدد ─ مدة انتظار الاختراق بدلالة عرض النموذج
▌ الأهداف
▸ نافذة الهدف ×العرض ─ المدة المسموحة لبلوغ الهدف. صفر = بلا انتهاء
▌ العرض
▸ أقصى نماذج متتبعة لكل جانب ─ ارفعه على الفريمات المنخفضة
▸ ألوان مستقلة لكل جانب: النموذج · التضليل · النص · خلفية العلامة
الشفافية تُضبط من منتقي اللون نفسه
╔═══════════════════════════════════════════════════════╗
🔔 التنبيه
╚═══════════════════════════════════════════════════════╝
تنبيه واحد فقط: اكتمال النموذج الثلاثي.
▸ يُطلق عند كسر خط العنق بإغلاق شمعة مؤكد
▸ للقاع والقمة معًا
▸ مرة واحدة لكل نموذج
▸ الرسالة تتضمن الرمز والفريم وسعر الإغلاق تلقائيًا
الإنشاء: أيقونة المنبه → المؤشر كمصدر → الشرط → التكرار "مرة عند إغلاق الشمعة".
⚠ TradingView يحفظ إعدادات المؤشر لحظة إنشاء التنبيه. إن غيّرت أي إعداد بعدها، احذف التنبيه وأنشئه من جديد.
╔═══════════════════════════════════════════════════════╗
📊 الاستخدام العملي
╚═══════════════════════════════════════════════════════╝
▸ خط العنق هو المستوى الحاسم. قبل اختراقه: بنية محتملة. بعده: حدث مكتمل.
▸ الطرف الأبعد يحدد نقطة إبطال النموذج — إغلاق تحت أدنى القيعان الثلاثة، أو فوق أعلى القمم الثلاث.
▸ جدول المعلومات يعرض لكل جانب: نمط الهدف · سعر الهدف · الحالة الراهنة · عمر النموذج بالشموع.
▸ حقل العمر مهم: نموذج عمره خمسون شمعة ليس كنموذج عمره خمسمئة.
▸ النماذج الثلاثية أندر بطبيعتها من الثنائية. إن لم يظهر شيء على فريم مرتفع فهذا سلوك متوقع لا خلل — ارفع حد تماثل الأطراف أولًا، ثم راجع بوابة ارتفاع الاتجاه.
╔═══════════════════════════════════════════════════════╗
⚠ الإفصاح والقيود
╚═══════════════════════════════════════════════════════╝
▸ هذا المؤشر أداة تحليل بصري وتنظيم لرؤية السوق. لا يقدم توصيات شراء أو بيع، ولا يَعِد بنتائج.
▸ صحة الرسم شيء وأداء النموذج شيء آخر. المؤشر يرسم النماذج ويتتبع أحداثها بدقة، لكن قدرة النموذج نفسه على التنبؤ لم تُختبر إحصائيًا هنا ولا يُدعى بها.
▸ نطاق البحث محدود بآخر خمسين محورًا لكل جانب، فقد لا يُكتشف نموذج قديم جدًا.
▸ عند امتلاء ميزانية النماذج المتتبعة، قد يُستبدل نموذج حي بآخر أحدث. رفع "أقصى نماذج متتبعة" يقلل ذلك.
▸ استخدمه ضمن منهج تداول متكامل يشمل إدارة المخاطر، لا كمصدر قرار وحيد.
─────────────────────────────────────────────
The_lurker — Fawaz Al-Enezi | فواز العنزي
───────────────────────────────────────────── مؤشر

Composite Liquidity Flow: five-asset weighted volume deltaWhat it does
One histogram that answers a single question: which way is the whole index complex leaning right now? It estimates buying and selling pressure across five instruments at once, weights them, smooths them, and prints the net as a z-scored delta with an agreement layer on top.
What is original here
Volume delta and RSI are both public methodology, and neither is mine. Three things here are not standard:
1. Pressure is attributed per bar from candle geometry, then priced in dollars rather than counted in shares. A 600-dollar instrument and a 60-dollar instrument therefore contribute on a comparable scale, which a raw share-count composite cannot do.
2. The five legs are not summed. Index futures, their tracking funds, and an inverse hedge fund are weighted separately, and the hedge leg has its logic inverted, so buying in the inverse product is counted as selling pressure on the complex. Hedging demand is treated as information rather than noise. This is the part I have not seen elsewhere.
3. The composite is z-scored against its own recent distribution, so the same scale reads correctly on a quiet session and on a high-volatility print.
The RSI layer is a display filter, not an input to the flow calculation. It gates when markers are allowed to print and never changes the histogram. That is the reason for the combination: flow describes who is pushing, RSI describes whether price has already travelled, and a marker is only allowed when the two agree. Without the filter the same flow model prints far more markers, most of them late.
How it works
Per-instrument pressure comes from candle structure. On an up bar, the body plus the lower wick is attributed to buyers and the upper wick to sellers; on a down bar the attribution reverses. That fraction multiplies the bar volume, then the closing price, producing a dollar figure per leg. Legs are weighted, summed, smoothed with an exponential average, then converted to a z-score against a rolling lookback. A session filter zeroes the fund legs outside regular hours, where their volume is unrepresentative of real positioning.
Divergences require three conditions at once: price at a lookback extreme, three consecutive bars of the composite moving the other way, and optional confirmation from the filter. A cooldown then suppresses repeats so the markers stay rare enough to mean something.
How to use it
Built for intraday index trading and tuned by default for 5-minute charts. Above the zero line and rising, with the filter supportive, means the composite tape agrees with a long. Below and falling is the mirror. The divergence markers are warnings about the move in progress, not entries. The dashboard reports each component separately so you can see which one is disagreeing before you act on the net.
What it cannot do
Markers are evaluated on the live bar, so a divergence or agreement arrow can appear and then disappear before the bar closes. Judge them on closed bars only. Nothing is drawn in the past and no confirmed marker moves once its bar has closed.
Everything here is estimated from open, high, low, close and volume. It is a structural proxy for order flow, not tick data, and it inherits every weakness a proxy has: it cannot see the order book, it cannot distinguish an aggressive buyer from a passive one, and on thin instruments the attribution is close to meaningless. It describes the index complex only and says nothing useful about an individual stock. It does not predict anything. It describes what the current bar and its neighbors have already printed.
Settings
Five symbols and their weights, smoothing length and z-score lookback, filter parameters, divergence strictness and cooldown, session handling, and a display toggle for each visual layer. مؤشر

Hunter DWM Control Pro• Overview
Hunter DWM Control Pro is a multi-timeframe technical analysis script built around a structural process evaluated across the Daily, Weekly, and Monthly timeframes.
The script combines structural breakout references, structural invalidation levels, sequential price targets, evolving support and resistance, an Advanced Radar Control Cloud, normalized directional momentum, and timeframe-based candle coloring.
These components operate within one analytical workflow. The structural engine identifies the price structure being monitored, the target engine follows how that structure develops after a breakout, while the Radar and momentum components provide additional information about the directional environment surrounding the structure.
The complete D/W/M structural display is intended primarily for use on a Daily chart.
________________________________________
• Structural Detection
The structural process begins by evaluating directional candle shapes.
A qualifying bullish candle requires:
• Close above Open.
• The candle body to be larger than the combined upper and lower wicks.
A qualifying bearish candle applies the opposite directional condition using the same body-versus-wicks relationship.
The script records the Low of the most recent qualifying bullish candle. It then monitors for a qualifying bearish candle that closes below that bullish Low.
When this bearish structure occurs, its High, Low, and time are stored.
A bullish structural breakout is detected when a later close moves above the stored High of that bearish structure.
The same process is calculated separately on the Daily, Weekly, and Monthly timeframes.
________________________________________
• Daily, Weekly and Monthly Structure
The main table organizes the current structural state of:
• Daily
• Weekly
• Monthly
For each timeframe, the table can display:
• Last High
• Breakout
• SL
• RS
• SUP
• SL Stat
• T1
• T2
• T3
The three-timeframe view shows how the same structural process is developing across different time horizons.
________________________________________
• Structural Invalidation
When a breakout cycle becomes active, the script stores the Low of the bearish structure associated with that breakout as its structural invalidation reference.
The SL status can display:
• ACTIVE — an active structural cycle remains above its stored invalidation level.
• BROKEN — the relevant timeframe has closed below the stored invalidation level.
• INACTIVE — no active structural cycle is currently associated with that stored level.
Before an active cycle exists, the SL column may display the Low of the currently identified structure as a reference level.
These values are structural references generated by the script. They do not determine position size, account exposure, or individual risk tolerance.
________________________________________
• Primary Target Calculation
When a structural breakout cycle is established, the High and Low associated with that structure are stored.
The structural range is calculated as:
Range = Structure High - Structure Low
The primary targets are then derived as:
• T1 = Structure High + 1 × Range
• T2 = Structure High + 2 × Range
• T3 = Structure High + 3 × Range
A target is recorded as reached when the relevant timeframe closes at or above that target level.
Before a confirmed breakout cycle exists, the table can display preview target values calculated from the currently identified structure.
These preview levels provide a structural map of the levels ahead, while actual target-hit tracking begins after a breakout cycle is established.
________________________________________
• Extension Targets
After T3 has been reached, the script can establish an additional target sequence.
An extension requires a qualifying bullish candle to close at or above T3.
The High and Low of that candle define a new range reference from which three additional targets are calculated:
• EXT1
• EXT2
• EXT3
Once created, the extension anchor and target levels remain fixed for that extension cycle.
This separates the original structural projection from a later expansion phase.
________________________________________
• Dynamic Support and Resistance
The RS and SUP fields change as price progresses through the structural sequence.
Before an active target cycle exists, the stored structural High acts as the next resistance reference.
After a breakout, the original breakout level becomes a support reference while T1 becomes the next resistance.
As T1, T2, T3, and extension targets are reached, the script advances the support and resistance references through the sequence.
RS and SUP therefore describe the current location within the script's structural path rather than fixed support and resistance levels.
________________________________________
• Action State
The Action field summarizes the current Daily trade-state logic.
Possible states are:
• WAIT — no active Daily trade-state cycle.
• BUY — a new confirmed Daily structural breakout event has activated the programmed state.
• HOLD — the Daily state remains active and price has not closed below the stored structural invalidation level.
• TP — a programmed Daily target has just been confirmed while the state is active.
• EXIT — the Daily close has moved below the stored structural invalidation level.
The script also prevents a new BUY state when the first Daily target has already been registered for the relevant sequence.
These terms describe programmed indicator states. They are not brokerage orders and do not constitute instructions to buy, hold, take profit, or exit a position.
________________________________________
• Multi-Timeframe Candle Coloring
On the Daily chart, candles can optionally be colored according to the highest active breakout timeframe.
The priority is:
Monthly → Weekly → Daily
Accordingly:
• Daily breakout state uses the Daily color.
• Weekly breakout state takes priority over Daily.
• Monthly breakout state takes priority over Weekly and Daily.
• When none of these breakout states is active, the script leaves the chart's normal candle colors unchanged.
The candle coloring provides a compact visual representation of the highest active structural timeframe without adding additional markers around each candle.
________________________________________
• Advanced Radar Control Cloud
The Advanced Radar Control Cloud provides directional context separately from the D/W/M structural engine.
The Radar identifies strong directional candles using the relationship between candle body size and the combined wick size.
A qualifying bullish candle contributes to the Bull Control feed.
A qualifying bearish candle contributes to the Bear Control feed.
When a new qualifying directional candle is not present, the previous feed value is carried forward.
The Bull and Bear feeds are then smoothed using EMA calculations.
The default Radar Control EMA length is 11.
The script also measures the distance between Bull Control and Bear Control relative to ATR(14).
The Radar classifies the current environment into four states:
• Bull Control
• Bear Control
• Compression
• Transition
Compression occurs when the normalized distance between the two control lines is below the selected threshold. The default compression reference is 0.18 ATR.
Bull Control requires price to be above the upper Radar boundary together with a non-declining Bull Control line.
Bear Control requires price to be below the lower Radar boundary together with a non-rising Bear Control line.
Other non-compression conditions are classified as Transition.
The colored area between Bull Control and Bear Control forms the Advanced Radar Control Cloud.
An optional Radar Slow Bias line applies additional EMA smoothing to the midpoint between the two control lines. Its default length is 33, and it is hidden by default.
The Radar describes current directional conditions. It does not predict the direction of the next candle.
________________________________________
• Strength and Acceleration
The script measures directional candle impulse relative to its recent baseline.
The current directional movement is calculated from:
Close - Open
Its absolute movement is compared with the recent average absolute candle movement over a default seven-bar calculation length.
The resulting Strength value describes the current directional impulse relative to that recent baseline.
Acceleration measures the change in normalized Strength from the previous bar.
The Note field converts the relationship between Strength and Acceleration into descriptive states such as:
• Explosive
• Strong
• Starting
• Fading
• Moderate
• Weak
• Reversing
• Dead
These labels describe programmed momentum conditions. They are not probability, confidence, win-rate, or accuracy measurements.
________________________________________
• Early Entry Alert
The script includes a separate Early Entry alert condition.
The programmed condition requires:
• A confirmed crossover above the Daily structural High.
• An active Weekly breakout condition.
• Bull Control from the Radar.
• Positive Acceleration.
• Strong or Explosive positive momentum according to the script's classification.
Early Entry operates as an alert condition only and does not replace or modify the main Action-state engine.
________________________________________
• Why These Components Are Combined
Hunter DWM Control Pro uses established technical-analysis calculations such as EMA, ATR, candle-body and wick measurements, price ranges, and multi-timeframe price data.
The individual calculations are supporting components rather than the purpose of the script.
The script coordinates one structural process across Daily, Weekly, and Monthly data and connects that structure with stored invalidation levels, sequential targets, extension targets, evolving support and resistance, Action states, Radar context, normalized directional momentum, and timeframe-based candle coloring.
The structural engine identifies the reference levels.
The target and support/resistance engines describe how those levels evolve after a breakout.
The Radar and momentum components provide additional context about the directional environment and current price movement.
This relationship between the components is the reason they are presented together.
________________________________________
• Intended Timeframe
The complete structural workflow is designed primarily for a Daily chart.
On the Daily timeframe, the script displays:
• D/W/M structural lines.
• Structural SL references.
• The full multi-timeframe table.
• Action states.
• Timeframe-based candle coloring.
Radar and momentum calculations use the chart's current timeframe, but the complete D/W/M workflow is intended to be interpreted from the Daily chart.
________________________________________
• Multi-Timeframe Data Behavior
Daily, Weekly, and Monthly calculations are evaluated inside their respective requested timeframes.
The script uses multi-timeframe requests with future-data lookahead disabled.
However, values associated with the current Weekly or Monthly candle can still change while that higher-timeframe candle remains open.
Users should therefore distinguish between a developing higher-timeframe condition and one based on a completed higher-timeframe candle.
Daily BUY and EXIT events additionally require a confirmed Daily chart bar.
________________________________________
• Main Table
The main table contains:
• TF — Timeframe.
• Last High — Current stored structural High.
• Breakout — Current structural breakout state.
• SL — Structural Low or invalidation reference.
• RS — Current resistance reference.
• SUP — Current support reference.
• SL Stat — ACTIVE, BROKEN, or INACTIVE.
• T1 / T2 / T3 — Preview, primary, or extension target sequence depending on the current structural state.
• Action — Current Daily trade-state label.
________________________________________
• Radar Table
The compact Radar table contains:
• Trend — UP, DOWN, COMPRESSION, or NEUTRAL.
• Accel — Change in normalized directional Strength.
• Strength — Current normalized directional candle impulse.
• Note — Current descriptive momentum state.
________________________________________
• Settings
Available settings include controls for:
• Daily, Weekly, and Monthly colors.
• Candle coloring by highest breakout timeframe.
• Structural line length, width, and style.
• SL line length, width, and style.
• Label size and transparency.
• Main table appearance and position.
• Radar Control EMA length.
• Radar Bias EMA length.
• Radar compression threshold.
• Radar cloud transparency.
• Bull and Bear Radar colors.
• Radar Cloud visibility.
• Radar Slow Bias visibility.
• Radar table text size.
________________________________________
• Alerts
The script includes alert conditions for:
• BUY
• TP
• EXIT
• Early Entry
An alert means that the corresponding programmed condition has occurred.
It does not place a market order and does not imply that price will subsequently move in a particular direction.
________________________________________
• Limitations
Hunter DWM Control Pro is based on price-derived technical calculations.
Structural breakouts can fail.
Price may not reach projected targets.
A previously active structural condition can later be invalidated.
Radar, Strength, and Acceleration states can change as new price data becomes available.
Weekly and Monthly values can change while their current candles are still developing.
Preview targets shown before a confirmed breakout are structural projections and are not active target-hit records.
The script does not account for brokerage execution, spread, slippage, commissions, liquidity, leverage, position sizing, or individual risk-management rules.
The indicator is not a backtesting strategy and does not calculate or report historical profitability, win rate, or signal accuracy.
________________________________________
• Disclaimer
Hunter DWM Control Pro is a technical-analysis tool provided for informational and educational purposes.
Its levels, states, targets, colors, tables, and alerts are outputs of programmed calculations applied to market data.
They do not constitute financial advice or a recommendation to buy, sell, hold, or exit any financial instrument.
Users remain responsible for their own analysis, risk management, and trading decisions.
________________________________________
• نظرة عامة
Hunter DWM Control Pro هو سكربت للتحليل الفني متعدد الأطر الزمنية، ويعتمد على تسلسل هيكلي يتم تقييمه على الإطار اليومي والأسبوعي والشهري.
يجمع المؤشر بين مراجع الاختراق الهيكلي، ومستويات الإبطال الهيكلي، والأهداف السعرية المتتابعة، والدعم والمقاومة المتغيرة، وسحابة Radar Control المتطورة، وقياس القوة الاتجاهية، وتلوين الشموع وفق حالة الأطر الزمنية.
تعمل هذه المكونات ضمن دورة تحليل واحدة؛ فالمحرك الهيكلي يحدد البنية السعرية التي تتم مراقبتها، ومحرك الأهداف يتابع كيفية تطور تلك البنية بعد الاختراق، بينما يقدم الرادار وقياسات القوة معلومات إضافية عن البيئة الاتجاهية المحيطة بها.
تم تصميم العرض الهيكلي الكامل D/W/M بصورة أساسية للاستخدام على الشارت اليومي.
________________________________________
• اكتشاف الهيكل
يبدأ التسلسل الهيكلي بتقييم شكل الشموع الاتجاهية.
تتطلب الشمعة الصاعدة المستوفية للشروط:
• أن يكون الإغلاق أعلى من الافتتاح.
• أن يكون جسم الشمعة أكبر من مجموع الظل العلوي والسفلي.
ويتم تطبيق الشرط الاتجاهي المقابل على الشمعة الهابطة باستخدام العلاقة نفسها بين الجسم والظلال.
يسجل المؤشر قاع آخر شمعة صاعدة مستوفية للشروط، ثم يبحث عن شمعة هابطة مستوفية للشروط تغلق أسفل ذلك القاع.
عند ظهور هذا الهيكل الهابط، يتم تسجيل قمته وقاعه ووقته.
يتم اكتشاف الاختراق الهيكلي الصاعد عندما يحدث لاحقًا إغلاق أعلى من القمة المسجلة لذلك الهيكل.
ويتم تنفيذ العملية نفسها بصورة مستقلة على Daily وWeekly وMonthly.
________________________________________
• هيكل Daily وWeekly وMonthly
ينظم الجدول الرئيسي الحالة الهيكلية لكل من:
• Daily
• Weekly
• Monthly
ويعرض لكل إطار معلومات مثل:
• Last High
• Breakout
• SL
• RS
• SUP
• SL Stat
• T1
• T2
• T3
والغرض من قراءة الأطر الثلاثة هو معرفة كيفية تطور التسلسل الهيكلي نفسه عبر أكثر من أفق زمني.
________________________________________
• الإبطال الهيكلي
عند تفعيل دورة اختراق، يقوم المؤشر بتخزين قاع الهيكل الهابط المرتبط بذلك الاختراق ليصبح مرجع الإبطال الهيكلي.
يمكن أن تظهر حالة SL كالتالي:
• ACTIVE — توجد دورة هيكلية نشطة وما زالت أعلى مستوى الإبطال المخزن.
• BROKEN — أغلق الإطار المعني أسفل مستوى الإبطال المخزن.
• INACTIVE — لا توجد حاليًا دورة هيكلية نشطة مرتبطة بذلك المستوى.
وقبل وجود دورة نشطة، يمكن أن تعرض خانة SL قاع الهيكل الحالي كمرجع سعري.
هذه المستويات مراجع هيكلية محسوبة بواسطة المؤشر، ولا تحدد حجم الصفقة أو مقدار التعرض في الحساب أو مستوى المخاطرة المناسب للمستخدم.
________________________________________
• حساب الأهداف الأساسية
عند إنشاء دورة اختراق هيكلي جديدة، يتم تخزين قمة وقاع الهيكل المرتبط بها.
يتم حساب المدى كالتالي:
المدى = قمة الهيكل - قاع الهيكل
ثم:
• T1 = قمة الهيكل + مرة واحدة من المدى
• T2 = قمة الهيكل + مرتين من المدى
• T3 = قمة الهيكل + ثلاث مرات من المدى
يسجل المؤشر تحقق الهدف عندما يغلق الإطار الزمني المعني عند مستوى الهدف أو أعلى منه.
وقبل وجود دورة اختراق مؤكدة، يمكن أن يعرض الجدول أهدافًا تقديرية محسوبة من الهيكل الحالي.
تستخدم هذه المستويات لتوضيح المسار الهيكلي أمام السعر، بينما تبدأ متابعة تحقق الأهداف الفعلية بعد تفعيل دورة الاختراق.
________________________________________
• الأهداف الامتدادية
بعد تحقق T3 يمكن للمؤشر إنشاء تسلسل أهداف إضافي.
يتطلب تفعيل الامتداد وجود شمعة صاعدة مستوفية لشروط القوة تغلق عند T3 أو أعلى منه.
يتم استخدام قمة وقاع تلك الشمعة لتحديد مدى جديد، ومنه يتم حساب:
• EXT1
• EXT2
• EXT3
بعد إنشاء الامتداد يتم تثبيت مرجعه وأهدافه لدورة الامتداد الحالية، ولا يعاد حسابها من كل شمعة صاعدة لاحقة.
وبذلك يتم الفصل بين أهداف الهيكل الأساسي ومرحلة التوسع السعري اللاحقة.
________________________________________
• الدعم والمقاومة الديناميكية
تتغير خانات RS وSUP مع تقدم السعر خلال التسلسل الهيكلي.
قبل وجود دورة أهداف نشطة، تعمل القمة الهيكلية المسجلة كمرجع للمقاومة التالية.
بعد الاختراق، يتحول مستوى الاختراق الأصلي إلى مرجع دعم، بينما يصبح T1 المقاومة التالية.
ومع تحقق T1 ثم T2 ثم T3 وأهداف الامتداد، يقوم المؤشر بنقل مراجع الدعم والمقاومة عبر التسلسل.
ولذلك فإن RS وSUP يصفان الموقع الحالي داخل المسار الهيكلي للمؤشر، وليسا مستويات دعم ومقاومة ثابتة.
________________________________________
• حالة Action
تلخص خانة Action حالة منطق الصفقة اليومية داخل المؤشر.
الحالات الممكنة هي:
• WAIT — لا توجد دورة صفقة يومية نشطة.
• BUY — حدث اختراق هيكلي يومي جديد ومؤكد وقام بتفعيل الحالة البرمجية.
• HOLD — ما زالت الحالة اليومية نشطة ولم يغلق السعر أسفل مستوى الإبطال المخزن.
• TP — تم تأكيد أحد الأهداف اليومية المبرمجة أثناء بقاء الحالة نشطة.
• EXIT — أغلق السعر اليومي أسفل مستوى الإبطال الهيكلي المخزن.
كما يمنع المحرك إنشاء حالة BUY جديدة إذا كان الهدف اليومي الأول قد تم تسجيله بالفعل ضمن التسلسل المعني.
هذه المصطلحات أسماء لحالات برمجية داخل المؤشر، وليست أوامر تنفيذ لدى وسيط ولا تعليمات للمستخدم بالشراء أو الاحتفاظ أو جني الربح أو الخروج.
________________________________________
• تلوين الشموع متعدد الأطر
على الشارت اليومي يمكن للمؤشر تلوين الشموع اختياريًا وفق أعلى إطار زمني توجد عليه حالة اختراق نشطة.
ترتيب الأولوية هو:
Monthly → Weekly → Daily
وبالتالي:
• إذا كان Daily نشطًا يظهر لون اليومي.
• إذا كان Weekly نشطًا يأخذ الأولوية على اليومي.
• إذا كان Monthly نشطًا يأخذ الأولوية على الأسبوعي واليومي.
• إذا لم تكن أي من الحالات الثلاث نشطة، لا يغير المؤشر ألوان الشموع الأصلية للشارت.
الغرض من التلوين هو إظهار أعلى إطار هيكلي نشط بصريًا دون إضافة إشارات متكررة حول كل شمعة.
________________________________________
• سحابة Advanced Radar Control
تقدم سحابة Radar Control المتطورة قراءة للسياق الاتجاهي بشكل منفصل عن محرك D/W/M.
يحدد الرادار الشموع الاتجاهية القوية باستخدام العلاقة بين حجم جسم الشمعة ومجموع الظلال.
تغذي الشمعة الصاعدة المستوفية للشروط Bull Control، بينما تغذي الشمعة الهابطة المستوفية للشروط Bear Control.
وعندما لا توجد شمعة اتجاهية جديدة مستوفية للشروط، يتم الاحتفاظ بآخر قيمة.
ثم يتم تنعيم Bull Control وBear Control باستخدام EMA.
القيمة الافتراضية لطول Radar Control هي 11.
كما يقيس المؤشر المسافة بين Bull Control وBear Control مقارنة بـ ATR(14).
ويصنف الرادار البيئة الحالية إلى:
• Bull Control
• Bear Control
• Compression
• Transition
تظهر حالة Compression عندما تصبح المسافة المعيارية بين خطي السيطرة أقل من الحد المحدد، والقيمة الافتراضية هي 0.18 ATR.
تتطلب Bull Control وجود السعر أعلى الحد العلوي للرادار مع عدم انخفاض Bull Control.
وتتطلب Bear Control وجود السعر أسفل الحد السفلي للرادار مع عدم ارتفاع Bear Control.
أما الحالات الأخرى غير المصنفة كـCompression فتظهر كـTransition.
المنطقة الملونة بين Bull Control وBear Control تمثل سحابة Advanced Radar Control.
كما يوجد خط اختياري باسم Radar Slow Bias يعتمد على تنعيم إضافي لمتوسط خطي السيطرة بواسطة EMA بطول افتراضي 33، وهو مخفي افتراضيًا.
الرادار يصف الحالة الاتجاهية الحالية ولا يتنبأ باتجاه الشمعة التالية.
________________________________________
• Strength وAcceleration
يقيس المؤشر قوة الحركة الاتجاهية الحالية مقارنة بخط أساس حديث.
الحركة الاتجاهية الحالية هي:
Close - Open
ثم تتم مقارنة الحركة بمتوسط القيمة المطلقة لحركة الشموع الأخيرة خلال فترة افتراضية قدرها سبع شموع.
تمثل Strength قوة الحركة الاتجاهية الحالية مقارنة بخط الأساس الحديث.
أما Acceleration فيقيس التغير في Strength المعيارية مقارنة بالشمعة السابقة.
وتحول خانة Note هذه القراءات إلى أوصاف مثل:
• Explosive
• Strong
• Starting
• Fading
• Moderate
• Weak
• Reversing
• Dead
هذه الحالات تصف الزخم المحسوب داخل المؤشر، ولا تمثل احتمال نجاح أو Confidence أو Win Rate أو نسبة دقة.
________________________________________
• تنبيه Early Entry
يتضمن المؤشر شرط تنبيه مستقل باسم Early Entry.
ويتطلب:
• تقاطعًا مؤكدًا أعلى المستوى الهيكلي اليومي.
• وجود حالة اختراق أسبوعية نشطة.
• حالة Bull Control في الرادار.
• Acceleration إيجابي.
• وجود Strong أو Explosive ضمن تصنيف الزخم الإيجابي.
Early Entry هو شرط للتنبيه فقط، ولا يغير أو يستبدل محرك Action الرئيسي.
________________________________________
• لماذا تم جمع هذه المكونات؟
يستخدم Hunter DWM Control Pro حسابات معروفة في التحليل الفني مثل EMA وATR وقياسات أجسام وظلال الشموع ومدى السعر وبيانات الأطر الزمنية المتعددة.
ولا يتم تقديم هذه الحسابات الفردية باعتبارها أساليب جديدة بحد ذاتها.
يقوم السكربت بتنسيق تسلسل هيكلي واحد عبر Daily وWeekly وMonthly وربطه بمستويات الإبطال المخزنة، والأهداف المتتابعة، وأهداف الامتداد، والدعم والمقاومة المتغيرة، وحالات Action، وسياق الرادار، والقوة الاتجاهية المعيارية، وتلوين الشموع متعدد الأطر.
يحدد المحرك الهيكلي المستويات المرجعية، وتوضح محركات الأهداف والدعم والمقاومة كيفية تطور تلك المستويات بعد الاختراق، بينما يضيف الرادار وقياسات القوة سياقًا إضافيًا للحالة الاتجاهية والحركة الحالية.
وهذا الترابط هو سبب استخدام هذه المكونات معًا داخل السكربت.
________________________________________
• الإطار الزمني المقصود
تم تصميم دورة العمل الهيكلية الكاملة بصورة أساسية للشارت اليومي.
على الإطار اليومي يعرض المؤشر:
• خطوط D/W/M الهيكلية.
• مراجع SL.
• جدول الأطر الزمنية الكامل.
• حالات Action.
• تلوين الشموع وفق الأطر الزمنية.
أما حسابات الرادار والزخم فتستخدم بيانات الإطار الموجود على الشارت، لكن قراءة دورة D/W/M الكاملة مخصصة أساسًا للشارت اليومي.
________________________________________
• سلوك بيانات الأطر الزمنية
يتم تنفيذ حسابات Daily وWeekly وMonthly داخل الإطار الزمني الخاص بكل منها.
ويستخدم السكربت طلبات Multi-Timeframe مع تعطيل الوصول إلى بيانات مستقبلية.
مع ذلك، يمكن لقيم Weekly أو Monthly الحالية أن تتغير أثناء استمرار تكون شمعة الإطار الأعلى.
ولذلك يجب التمييز بين حالة إطار زمني أعلى ما زالت شمعتها قيد التكوين وبين حالة مبنية على شمعة مكتملة.
كما تتطلب أحداث BUY وEXIT اليومية تأكيد الشمعة الحالية.
________________________________________
• الجدول الرئيسي
يتضمن الجدول:
• TF — الإطار الزمني.
• Last High — القمة الهيكلية الحالية المسجلة.
• Breakout — حالة الاختراق الحالية.
• SL — مرجع القاع أو الإبطال الهيكلي.
• RS — المقاومة الحالية.
• SUP — الدعم الحالي.
• SL Stat — ACTIVE أو BROKEN أو INACTIVE.
• T1 / T2 / T3 — الأهداف التقديرية أو الأساسية أو الامتدادية حسب الحالة الحالية.
• Action — حالة الصفقة اليومية البرمجية الحالية.
________________________________________
• جدول الرادار
يتضمن جدول الرادار:
• Trend — UP أو DOWN أو COMPRESSION أو NEUTRAL.
• Accel — تغير القوة الاتجاهية المعيارية.
• Strength — القوة الاتجاهية الحالية مقارنة بخطها الأساسي.
• Note — الوصف البرمجي الحالي للزخم.
________________________________________
• الإعدادات
تشمل الإعدادات خيارات للتحكم في:
• ألوان Daily وWeekly وMonthly.
• تلوين الشموع حسب أعلى إطار اختراق.
• طول وعرض ونمط الخطوط الهيكلية.
• طول وعرض ونمط خطوط SL.
• حجم وشفافية التسميات.
• شكل وموقع الجدول الرئيسي.
• Radar Control EMA Length.
• Radar Bias EMA Length.
• Radar Compression Threshold.
• شفافية سحابة الرادار.
• ألوان Bull وBear Radar.
• إظهار أو إخفاء Radar Cloud.
• إظهار أو إخفاء Radar Slow Bias.
• حجم النص في جدول الرادار.
________________________________________
• التنبيهات
يتضمن السكربت شروط تنبيه لـ:
• BUY
• TP
• EXIT
• Early Entry
يعني التنبيه أن الشرط البرمجي المرتبط به قد تحقق.
ولا يقوم بتنفيذ أمر في السوق ولا يعني أن السعر سيتحرك لاحقًا في اتجاه معين.
________________________________________
• القيود
يعتمد Hunter DWM Control Pro على حسابات تحليل فني مشتقة من بيانات السعر.
قد يفشل الاختراق الهيكلي.
وقد لا يصل السعر إلى الأهداف المتوقعة.
وقد يتم إبطال حالة هيكلية كانت نشطة سابقًا.
كما يمكن أن تتغير حالات Radar وStrength وAcceleration مع وصول بيانات سعرية جديدة.
ويمكن أن تتغير قيم Weekly وMonthly أثناء استمرار تكون شموعها الحالية.
الأهداف التقديرية التي تظهر قبل الاختراق المؤكد هي إسقاطات هيكلية وليست سجلات لأهداف نشطة تم تحقيقها.
لا يأخذ السكربت في الاعتبار تنفيذ الوسيط أو السبريد أو الانزلاق السعري أو العمولات أو السيولة أو الرافعة المالية أو حجم الصفقة أو قواعد إدارة المخاطر الخاصة بالمستخدم.
المؤشر ليس Strategy للاختبار التاريخي ولا يحسب أو يعرض الربحية التاريخية أو Win Rate أو نسبة دقة للإشارات.
________________________________________
• إخلاء المسؤولية
Hunter DWM Control Pro هو أداة للتحليل الفني مقدمة لأغراض معلوماتية وتعليمية.
المستويات والحالات والأهداف والألوان والجداول والتنبيهات التي يعرضها هي نواتج لحسابات برمجية مطبقة على بيانات السوق.
ولا تمثل نصيحة مالية أو توصية بشراء أو بيع أو الاحتفاظ أو الخروج من أي أداة مالية.
يبقى المستخدم مسؤولًا عن تحليله وإدارة مخاطره وقراراته.
مؤشر

Sessions - New York, London & AsiaOVERVIEW
This indicator draws price range boxes for the main trading sessions (Asia, London/Europe, and New York) and an optional full-day box with daily high/low labels and open/close lines. It is a chart-context tool: it shows where price traded during each session window, not buy/sell signals.
PURPOSE / WHY THIS EXISTS
Many traders need a clear visual of:
1) which session produced the day’s high or low,
2) how large the session range was,
3) how sessions overlap (for example London–New York),
4) and where the daily open sits relative to those ranges.
This script combines three session range boxes with a daily structure layer (00:00–24:00 in a fixed timezone). The components are meant to work together so you can read session behavior against the same day’s overall range without stacking several separate scripts.
WHAT IT DOES
• Asia session box — tracks high/low while the Asia window is open; freezes the box when the session ends.
• London (Europe) session box — same logic for the London window.
• New York session box — same logic for the RTH-style New York window.
• Daily box — full calendar day high/low in the same timezone.
• Daily high/low labels — marks the bar time of the daily high and low.
• Optional daily open and close/last lines with labels.
Sessions are only drawn on intraday charts. On daily and higher timeframes, session boxes are disabled (the daily layer can still apply depending on your settings).
DEFAULT SESSION TIMES
All times use the America/New_York timezone (TradingView handles daylight saving for that zone). Defaults can be edited in the inputs:
• Asia: 20:00–05:00
• London (Europe): 03:00–12:00
• New York: 09:30–16:00
Overlaps are intentional. For example, Asia and London can share a morning window, and London and New York share a large mid-day window. The boxes stack so you can see concurrency visually.
HOW IT WORKS (CONCEPT)
1) Session membership
For each session, the script checks whether the current bar’s time falls inside the configured session string, evaluated in America/New_York.
2) Session start / end
• Session start: first bar that is inside the session after being outside.
• Session end: first bar that is outside the session after being inside.
3) Range tracking
While inside a session, the script updates running high and low from bar high/low. The live box left edge is the session start bar; the right edge follows the current bar. When the session ends, the box is fixed for that day/session instance and kept in an optional history list.
4) Daily layer
The daily open is taken from the 1D open of the symbol. Daily high/low are tracked from bar values until the New York calendar day changes, then the previous day is finalized as a historical daily box (if enabled).
5) Object limits
History depth is capped by internal safety limits so the chart does not exceed TradingView drawing object limits on low timeframes.
HOW TO USE IT
Typical workflow on a 1m–15m chart:
1) Load the symbol you trade (indices, FX, metals, etc.).
2) Keep default session times if your process is U.S.-anchored; otherwise edit the three session inputs.
3) Use GLOBAL visibility toggles if you only need one or two sessions on screen.
4) Compare the current New York (or London) box size to recent historical boxes of the same color — this is visual context for range expansion/contraction, not a trade rule by itself.
5) Use daily high/low labels to see whether extremes printed in Asia, London, or New York.
6) Use open/close lines if you track acceptance above/below the daily open as part of your own rules.
Suggested reading order on any day:
Daily structure first (open, D Hi, D Lo) → then session boxes → then your own entry method (structure, levels, etc.). This script does not define entries, stop-loss, or take-profit.
INPUTS (MAIN GROUPS)
• Session time strings and colors for Asia / London / New York.
• Per-session show historical vs current boxes; outline-only options.
• GLOBAL toggles for each session.
• Daily box: historical and current day display.
• Daily high/low labels and colors.
• Daily open/close lines and their labels.
COLORS (DEFAULT IDEA)
• Asia — yellow tones
• London — blue tones
• New York — red tones
• Daily — lime tones
Colors are customizable so you can match your chart theme.
WHAT THIS SCRIPT IS NOT
• Not a strategy and not a signal generator.
• Not a guarantee of profitable trades or future price direction.
• Not a replacement for risk management or a complete trading plan.
• Session times are conventions (liquidity-focused windows), not a claim that one session is inherently “better” to trade.
TIPS FOR A CLEAN CHART
• Publish/use with this script alone on the chart for clarity.
• Prefer outline-only if fills feel heavy.
• Reduce historical session display if the chart becomes crowded.
LIMITATIONS
• Session logic depends on the bar timeframe: on higher intraday TFs, box edges align to those bars, not tick-perfect open/close of the clock window.
• Some symbols have thin overnight liquidity; box size then reflects that microstructure, not “quality” of a setup.
• Past session ranges do not predict the next session’s range.
DISCLAIMER
This tool Sessions - New York, London & Asia is for educational charting and visual analysis only. Markets involve risk. Past behavior on a chart does not guarantee future results. Always validate any idea on your own charts and risk parameters. مؤشر

Session Sentinel [JOAT]A round-the-clock session watchtower — Asia, London and New York, each tracked live with its own range, rails and color.
◆ WHAT IT IS
Where price sits relative to the session ranges is core context for intraday trading — Asia builds the range, London and New York tend to expand it. Session Sentinel tracks all three sessions simultaneously, each with a live box, high/low rails and midline, in its own signature color. It is a pure context tool and prints no buy/sell signals.
This is 100% original code, written from scratch. It does not copy any other session script.
◆ HOW IT WORKS
1. Three independent watches. Each session (Asia, London, New York) has its own fully adjustable window and a shared timezone selector. As a session runs, the tool records its running high and low into a live box and draws:
• Session high/low rails — the levels other traders watch
• A midline — the session's equilibrium
• A name tag on the box
2. Session lifecycle. When a session ends, its box is finalized and archived. Only a configurable number of recent sessions are kept per watch, so history stays readable across all timeframes.
3. Day-open reference. A neutral daily open line provides a permanent intraday reference — price above or below the day's open is a simple, powerful bias filter.
◆ WHAT YOU SEE
• Live, color-coded session boxes — Asia, London, New York — with high/low rails and midlines
• A daily open reference line
• A resizable dashboard showing which watch is on duty, each session's high/low and range size, live/closed status, and the day open with price's distance above or below it
◆ HOW TO USE IT
• Use the Asia range as the reference other sessions break out of; London and New York frequently sweep or expand it.
• Session high/low rails act as intraday support/resistance and as breakout levels.
• The day open is a clean bias line — trading above or below it frames your directional lean.
• Adjust each session window to your instrument and exchange. Designed for intraday timeframes .
◆ NOTES & LIMITATIONS
Sessions are evaluated in the timezone you select — set it to match your market. On daily and higher timeframes the intraday session concept does not apply. This is a context tool, not financial advice; session levels are references, not predictions. Combine with your own method and risk management.
— made with passion by officialjackofalltrade
مؤشر

Range MTF LinesRange MTF Lines shows the direction of the current price range across four timeframes at once, as a compact strip in its own pane at the bottom of the chart.
How the range is defined
The first candle sets the initial range — its high and its low. The range stays alive for as long as candles keep closing inside it. The first candle that closes outside the range ends it, and that same candle's high and low immediately become the new range. Then it repeats.
Because every range is created by a close outside the previous one, each range is born with a direction:
Up (green) — it was created by a close above the old range
Down (red) — it was created by a close below the old range
Neutral (grey) — the very first range on the chart, which has no parent to break
What you see
Four rows, one per timeframe slot, at fixed heights: slot 1 on top, slot 4 at the bottom (defaults 5 / 15 / 30 / 60 minutes). Each row is coloured bar by bar with that timeframe's current range direction and is labelled with its timeframe at the right-hand end.
Because the rows live in their own pane at a fixed height, they never drift with price — you can zoom or scroll anywhere and the strip stays put and readable. Drag the pane divider to set how tall it is.
Reading it top to bottom tells you at a glance whether the short and long timeframes agree: all four green is broad one-way pressure, alternating colours means the lower timeframes are chopping inside a higher-timeframe range.
Settings
Row thickness — how chunky the rows are drawn
Tag rows with their timeframe — the label at the right end of each row
Per slot — show/hide, the timeframe, and separate colours for up, down and first range
Alert on break — per slot, fires on bar close when that timeframe forms a new range, and reports the new high and low
Each slot runs on its own timeframe independently of the chart's. A slot set to the chart timeframe is evaluated natively with no lag; higher timeframes are pulled in and track the live higher-timeframe bar.
Notes
This is a structure-reading tool, not a signal generator — it describes where price is relative to the ranges it keeps building, and nothing about the strip is predictive on its own. Ranges are decided on closes, so a wick outside the range does not end it. Companion script: Range Break Levels (MTF), which draws these same ranges on the candles themselves. مؤشر

TEWMA Trend Strength - [JTCAPITAL]TEWMA Trend Strength - is a modified way to use Triple Exponentially Weighted Moving Averages (TEMA), Weighted Moving Averages (WMA), Average True Range (ATR), and EMA smoothing to measure the strength and direction of a trend.
Instead of simply determining whether price is above or below a single moving average, the indicator measures how far the current closing price is positioned from a composite trend baseline and normalizes that distance by market volatility using ATR. This produces a dimensionless trend-strength value that can be compared across different volatility environments.
The indicator combines two independently calculated TEWMA structures using different lengths. The first TEWMA is built from the selected source using the primary length, while the second uses a longer dynamically calculated length. These two TEWMA values are then averaged into one composite baseline.
The resulting distance between price and this composite baseline is divided by ATR. This normalization is important because a fixed price distance does not have the same meaning in every market or volatility regime. A move of 500 points can be extremely significant during a quiet market while being relatively insignificant during a highly volatile market. By measuring the distance relative to ATR, the indicator expresses the displacement in terms of the market's recent typical movement range.
A second, EMA-smoothed version of this strength measurement is also calculated. This provides a slower representation of the underlying trend-strength state while the raw strength value remains more responsive to current price movement.
The result is an oscillator designed to show both trend direction and relative trend strength in a single framework.
The indicator works by calculating in the following steps:
Selecting the Price Source
The script begins with a user-selectable source, which defaults to the closing price.
This source is used as the foundation for the entire trend calculation. Because the source is configurable, the underlying calculation does not have to be restricted to the close. The selected source can be changed to other available price series depending on how the user wants the trend baseline to respond to market data.
Using a configurable source makes the underlying TEWMA calculation adaptable without changing the mathematical structure of the indicator.
Defining the Primary TEWMA Length
The user specifies the primary moving-average length through the Length parameter.
This length controls the first trend component of the indicator. A shorter length makes the underlying moving averages react more quickly to price changes, while a longer length produces a slower and more stable representation of the underlying trend.
The default value is 50.
Creating the Second TEWMA Length
The script then creates a second length by multiplying the primary length by the Multiplier parameter.
The calculation is:
Second Length = Primary Length × Multiplier
The resulting value is rounded to the nearest whole number because the moving-average functions require an integer length.
With the default settings:
50 × 2 = 100
Therefore, the first TEWMA uses a length of 50 while the second TEWMA uses a length of 100.
This creates two different trend perspectives: one more responsive and one slower.
Calculating the First Weighted Moving Average
The selected source is first processed through a Weighted Moving Average using the primary length.
A WMA assigns progressively different weights to the observations within its calculation window, giving more importance to more recent observations than older ones.
This means the WMA can react to recent price changes more quickly than a traditional SMA while still providing a smoother representation of price than using raw closing prices.
The first WMA therefore acts as the input into the first TEMA calculation.
Calculating the Second Weighted Moving Average
The same process is repeated using the dynamically calculated second length.
Because this length is normally larger than the primary length, the second WMA represents a slower-moving version of the underlying price structure.
With the default settings, the first WMA uses 50 periods while the second uses 100 periods.
This creates two different smoothing horizons before the data reaches the TEMA calculations.
Applying Triple Exponential Moving Average to the First WMA
The first WMA is passed through a Triple Exponential Moving Average (TEMA).
TEMA uses multiple stages of exponential smoothing to reduce the lag associated with conventional moving averages.
Conceptually, TEMA can be represented as:
TEMA = 3 × EMA1 - 3 × EMA2 + EMA3
Where:
EMA1 is the first EMA of the input.
EMA2 is an EMA of EMA1.
EMA3 is an EMA of EMA2.
The combination of these three stages is designed to reduce lag while retaining smoothing characteristics.
In this indicator, however, TEMA is not applied directly to raw price. It is applied to the already weighted price series produced by the WMA.
This creates a two-stage structure:
Price Source → WMA → TEMA
The resulting value is the first TEWMA component.
Applying Triple Exponential Moving Average to the Second WMA
The second WMA is independently passed through another TEMA calculation using the longer second length.
This produces the second TEWMA component.
The second component reacts more slowly because its underlying WMA uses a longer period. Consequently, it provides a broader representation of the market's trend structure.
The two components therefore serve different purposes within the same baseline:
* The shorter TEWMA provides a more responsive representation of the current trend.
* The longer TEWMA provides a slower representation of the broader trend structure.
Combining the Two TEWMA Components
The two TEWMA values are then averaged together.
The calculation is:
TEWMA = (TEWMA1 + TEWMA2) / 2
This creates a composite trend baseline rather than relying on only one moving-average length.
The benefit of averaging two different smoothing horizons is that the resulting baseline incorporates both a faster and a slower view of price structure.
The shorter component helps keep the baseline responsive, while the longer component provides additional stability.
This combination can reduce the dependence on a single arbitrary moving-average period and creates a more balanced representation of the underlying trend.
Calculating Average True Range
The script independently calculates Average True Range (ATR) using the user-defined ATR Length .
The default ATR length is 40.
ATR measures the recent trading range of the market while accounting for gaps between consecutive bars through the concept of True Range.
True Range is based on the greatest of:
* Current High minus Current Low
* Absolute value of Current High minus Previous Close
* Absolute value of Current Low minus Previous Close
ATR then smooths these True Range values over the selected period.
In this indicator, ATR is not being used as a traditional stop-loss or entry mechanism. Instead, it is used as a volatility normalization factor.
Calculating the Raw Trend Strength
The script measures the distance between the current closing price and the composite TEWMA.
The calculation is:
Strength = (Close - TEWMA) / ATR
This is one of the most important calculations in the indicator.
First, the script calculates:
Close - TEWMA
This determines whether price is above or below the composite trend baseline and by how much.
If the result is positive, the closing price is above the TEWMA.
If the result is negative, the closing price is below the TEWMA.
The difference is then divided by ATR.
This converts the raw price distance into a volatility-adjusted measurement.
For example, a distance of 100 price units does not have the same significance in a market with an ATR of 20 as it does in a market with an ATR of 200.
When ATR is 20:
100 / 20 = 5
When ATR is 200:
100 / 200 = 0.5
The same absolute price distance therefore produces very different strength readings depending on the market's volatility.
This is the primary reason for incorporating ATR into the strength calculation.
Interpreting the Zero Line
Because the strength calculation is based on Close - TEWMA , the zero line has a direct mathematical meaning.
When:
Strength > 0
the closing price is above the composite TEWMA.
When:
Strength < 0
the closing price is below the composite TEWMA.
Therefore, the zero line represents the point where price and the composite TEWMA are equal.
This makes the zero line the central directional reference of the oscillator.
Smoothing the Strength Measurement
The raw strength value is then passed through an Exponential Moving Average.
The smoothing period is controlled by Smoothing Length , which defaults to 50.
The calculation can therefore be represented as:
Smoothed Strength = EMA(Strength, Smoothing Length)
Unlike the raw strength measurement, which reacts directly to changes in the current price-to-TEWMA relationship, the smoothed line incorporates previous strength values.
Because EMA gives greater weight to more recent observations, it remains responsive while filtering out some of the shorter-term fluctuations in the raw oscillator.
This creates two complementary views:
* Raw Strength shows the more immediate price displacement from the TEWMA.
* Smoothed Strength shows a slower representation of the underlying strength condition.
Assigning the Raw Strength Trend Color
The raw strength line changes color according to whether its value is above or below zero.
When strength is positive, the line uses the bullish color.
When strength is negative, the line uses the bearish color.
The color therefore directly corresponds to the mathematical relationship between price and the composite TEWMA.
It does not represent a separate calculation or additional signal filter.
Assigning the Smoothed Strength Trend Color
The same directional concept is applied to the smoothed strength line.
When the smoothed strength is above zero, it receives the bullish color.
When the smoothed strength is below zero, it receives the bearish color.
This makes it possible to visually distinguish the current normalized strength state from the slower smoothed state.
Plotting the Raw Strength
The raw strength value is plotted as the primary oscillator.
Because the indicator is declared with overlay = false , the oscillator is displayed in its own pane rather than directly over the price chart.
The raw strength plot uses a thicker line to emphasize the more responsive component of the calculation.
Filling Between Raw Strength and Zero
The script also creates an invisible zero reference plot and fills the area between the raw strength line and zero.
The fill follows the same bullish or bearish color assignment as the raw strength line.
This makes positive and negative deviations visually easier to identify.
When the oscillator is above zero, the area between the strength line and zero represents positive displacement from the TEWMA.
When it is below zero, the corresponding area represents negative displacement.
Plotting the Smoothed Strength
The smoothed strength is plotted separately using a thinner line.
Because this line is an EMA of the raw strength, it reacts more gradually to changes.
This makes it useful for visually separating short-term fluctuations in normalized trend strength from the broader strength condition represented by the smoothed value.
Filling Between Smoothed Strength and Zero
The indicator also fills the area between the smoothed strength line and zero.
The fill color follows whether the smoothed strength is positive or negative.
Consequently, the oscillator visually contains two layers of information:
* The raw strength component.
* The smoothed strength component.
Defining the Upper Strength Threshold
The Upper parameter defines a positive threshold for the background strength condition.
Its default value is 1.
The script checks whether the raw strength exceeds this threshold:
Strength > Upper
When that condition is true, the chart background receives a bullish background highlight.
The same upper threshold is also applied to the smoothed strength:
Smoothed Strength > Upper
This means the background can identify situations where normalized strength has moved beyond the selected positive threshold.
Defining the Lower Strength Threshold
The Lower parameter defines the negative threshold.
Its default value is -1.
The raw strength is checked against:
Strength < Lower
and the smoothed strength is checked against:
Smoothed Strength < Lower
When either respective condition is met, the corresponding bearish background condition is applied.
The default range therefore places the main strength thresholds at approximately +1 and -1 ATR of normalized displacement from the composite TEWMA.
Background Regime Visualization
The script uses the threshold calculations to create background highlights on the chart.
The raw strength produces a bullish background condition when it exceeds the upper threshold and a bearish background condition when it falls below the lower threshold.
The smoothed strength uses the same threshold framework.
Values between the upper and lower thresholds do not receive the bullish or bearish threshold highlight.
This creates a visual distinction between ordinary positive/negative displacement and stronger normalized displacement.
Buy and Sell Conditions:
This indicator does not contain explicit buy or sell conditions, entries, exits, alerts, or trade execution logic.
Instead, it is designed as a trend-strength oscillator .
The primary directional interpretation comes from the zero line:
* When the raw strength is above 0, price is above the composite TEWMA.
* When the raw strength is below 0, price is below the composite TEWMA.
* When the smoothed strength is above 0, the smoothed trend-strength state is positive.
* When the smoothed strength is below 0, the smoothed trend-strength state is negative.
The upper and lower thresholds provide an additional measurement of the magnitude of the normalized displacement:
* Strength above the upper threshold indicates that price is positioned more than the selected positive ATR multiple above the composite TEWMA.
* Strength below the lower threshold indicates that price is positioned more than the selected negative ATR multiple below the composite TEWMA.
The smoothed line can be used to observe whether the broader strength condition agrees with the raw strength measurement.
For example, a user may choose to interpret a positive raw strength together with positive smoothed strength as stronger directional alignment than a positive raw strength value occurring while the smoothed measurement remains negative.
However, these are interpretations of the indicator's measurements rather than coded buy or sell rules. The script itself does not automatically define a trade entry simply because one of these conditions occurs.
This distinction is important because the indicator measures market structure and normalized trend strength rather than providing a complete trading strategy.
Features and Parameters:
* Source - Selects the price series used as the input for the WMA calculations. The default source is Close.
* Length - Defines the primary length used for the first WMA and TEMA calculation. The default value is 50.
* Multiplier - Multiplies the primary length to determine the second TEWMA length. The default value is 2. With a Length of 50, this produces a second length of 100.
* ATR Length - Determines the period used to calculate ATR for volatility normalization. The default value is 40.
* Smoothing Length - Determines the EMA period used to smooth the raw strength measurement. The default value is 50.
* Upper - Defines the positive normalized-strength threshold used for the bullish background condition. The default value is 1.
* Lower - Defines the negative normalized-strength threshold used for the bearish background condition. The default value is -1.
* Raw Strength - Displays the current ATR-normalized distance between closing price and the composite TEWMA.
* Smoothed Strength - Displays an EMA-smoothed version of the raw strength measurement.
* Zero Line - Represents the point where closing price is equal to the composite TEWMA.
* Threshold Backgrounds - Visually highlights situations where raw or smoothed strength exceeds the configured upper or lower thresholds.
Specifications:
Weighted Moving Average (WMA)
The Weighted Moving Average is a moving average that assigns different weights to the observations within its calculation period.
More recent values receive greater influence than older values.
Compared with a Simple Moving Average, which gives every observation the same weight, WMA emphasizes the more recent portion of the selected price history.
In this indicator, WMA is used as the first smoothing stage before the data enters the TEMA calculation.
This creates a smoother input for TEMA while retaining greater responsiveness to recent price changes than an equally weighted average.
Triple Exponential Moving Average (TEMA)
Triple Exponential Moving Average is a multi-stage exponential smoothing method designed to reduce the lag that can occur with conventional moving averages.
The underlying calculation uses three consecutive EMA stages:
EMA1 = EMA(Input)
EMA2 = EMA(EMA1)
EMA3 = EMA(EMA2)
These are combined approximately as:
TEMA = 3 × EMA1 - 3 × EMA2 + EMA3
The mathematical combination attempts to compensate for some of the lag introduced by repeated exponential smoothing.
In this indicator, TEMA is applied after WMA rather than directly to price.
This creates the specific structure:
Selected Source → WMA → TEMA
That combination is the basis of the indicator's TEWMA concept.
TEWMA
TEWMA in this script refers to the combination of a Weighted Moving Average and a Triple Exponential Moving Average.
Each TEWMA component is therefore produced through a WMA followed by TEMA.
The script creates two separate TEWMA values using different lengths.
The first uses the primary length.
The second uses the primary length multiplied by the user-defined multiplier.
The two resulting values are then averaged.
This gives the final baseline a combination of a faster and slower trend perspective.
Dual-Length TEWMA Structure
The indicator does not rely on a single TEWMA.
Instead, it calculates:
TEWMA1 = TEMA(WMA(Source, Length), Length)
and:
TEWMA2 = TEMA(WMA(Source, Length2), Length2)
where:
Length2 = round(Length × Multiplier)
The two values are then averaged.
This is important because a single moving-average length represents only one smoothing horizon.
The dual-length structure allows the composite baseline to incorporate both a more responsive trend component and a slower trend component.
The averaging process creates a single reference value from those two perspectives.
Composite TEWMA
The final TEWMA is calculated as:
TEWMA = average(TEWMA1, TEWMA2)
or mathematically:
TEWMA = (TEWMA1 + TEWMA2) / 2
This composite value acts as the central trend baseline of the entire indicator.
Every raw strength value is calculated relative to this baseline.
Therefore, the TEWMA is not simply plotted as a moving average for visual reference; it directly determines the numerator of the strength calculation.
Average True Range (ATR)
Average True Range is a volatility measurement that estimates the typical trading range of the market over a selected period.
It is based on True Range, which accounts for both the current candle's high-low range and gaps relative to the previous closing price.
The ATR is used here as a normalization factor .
This is a critical part of the indicator because the raw distance between price and TEWMA is not directly comparable across different volatility conditions.
Dividing the price displacement by ATR expresses the distance in volatility-adjusted terms.
The resulting value can therefore be interpreted as the approximate number of ATR units that price is positioned above or below the composite TEWMA.
ATR Normalization
The core normalization is:
(Close - TEWMA) / ATR
The numerator determines direction and absolute displacement.
The denominator determines the scale of the market's recent volatility.
This combination allows the indicator to transform a raw price difference into a normalized strength measurement.
A positive result means price is above the TEWMA.
A negative result means price is below the TEWMA.
The magnitude indicates how large that displacement is relative to ATR.
Strength
Strength is the primary oscillator produced by the script.
Its exact calculation is:
Strength = (Close - TEWMA) / ATR
This value combines three important concepts:
* Price direction relative to the trend baseline.
* Distance from the trend baseline.
* Current market volatility.
The result is a normalized oscillator rather than a value expressed directly in price units.
Zero Line
The zero line is mathematically significant because it represents the point where:
Close = TEWMA
If the closing price moves above the TEWMA, strength becomes positive.
If the closing price moves below the TEWMA, strength becomes negative.
The zero line therefore separates positive and negative trend displacement.
EMA
The Exponential Moving Average assigns more weight to recent observations while retaining information from previous values.
In this script, EMA is used to smooth the calculated strength rather than the original price.
This distinction is important.
The indicator first calculates the complete ATR-normalized strength measurement and only then applies EMA smoothing.
The structure is therefore:
Price → TEWMA → ATR Normalized Strength → EMA
This allows the smoothing process to operate directly on the final trend-strength measurement.
Smoothed Strength
Smoothed strength is calculated as:
EMA(Strength, Smooth Length)
Because the input to the EMA is already normalized by ATR, the smoothed line represents the smoothed evolution of volatility-adjusted distance from the composite TEWMA.
This can help distinguish persistent strength from shorter-lived fluctuations in the raw oscillator.
The smoothing length determines how quickly the line responds.
A shorter smoothing length causes the smoothed measurement to react more quickly, while a longer smoothing length makes it more gradual.
Upper Threshold
The upper threshold determines when the strength measurement is considered sufficiently positive to trigger the bullish background condition.
With the default value of 1, the condition is:
Strength > 1
Because strength is normalized by ATR, this means the closing price is more than approximately one ATR above the composite TEWMA according to the current ATR calculation.
The same threshold is applied independently to the smoothed strength.
The threshold itself does not create a buy signal.
Lower Threshold
The lower threshold determines when the strength measurement enters the corresponding negative threshold region.
With the default value of -1, the condition is:
Strength < -1
This means the closing price is positioned more than approximately one ATR below the composite TEWMA.
The same concept is applied to the smoothed strength.
The lower threshold therefore acts as a normalized downside-strength boundary rather than a coded sell signal.
Volatility Normalization
Volatility normalization is one of the key concepts behind the indicator.
Without ATR normalization, the calculation would simply measure:
Close - TEWMA
That value is expressed in absolute price units.
By dividing it by ATR, the script asks a different question:
"How large is the price displacement relative to the market's recent typical range?"
This makes the strength value dependent on both price displacement and volatility.
That combination is particularly relevant when comparing periods in which the market's volatility changes substantially.
Trend Direction
The directional component of the indicator comes directly from the sign of the normalized strength.
Positive values indicate that price is above the composite TEWMA.
Negative values indicate that price is below the composite TEWMA.
The indicator therefore does not require a separate bullish/bearish calculation. Direction is inherently contained within the numerator of the strength formula.
Trend Strength
Trend strength is represented by the magnitude of the normalized value.
A value close to zero indicates that price is relatively close to the composite TEWMA when measured against ATR.
A larger positive value indicates greater positive displacement relative to ATR.
A larger negative value indicates greater negative displacement relative to ATR.
It is therefore important to distinguish direction from magnitude :
* The sign indicates which side of the TEWMA price is on.
* The magnitude indicates how far price is displaced relative to ATR.
Raw Strength vs. Smoothed Strength
The two oscillator components provide different information.
The raw strength responds directly to the latest relationship between closing price, TEWMA, and ATR.
The smoothed strength incorporates previous strength values through EMA smoothing.
This creates a useful distinction between immediate and persistent conditions.
A rapidly changing raw strength can reveal a developing change in the price-to-trend relationship, while the smoothed value can provide a slower representation of whether that change is becoming established.
The script therefore combines responsiveness and stability without requiring a second independent indicator.
Why Combine WMA and TEMA?
WMA and TEMA perform different roles in the calculation.
WMA provides weighted smoothing that places greater emphasis on recent observations.
TEMA then applies a multi-stage exponential smoothing structure intended to reduce lag compared with conventional moving averages.
Using them sequentially creates a trend baseline that is smoothed while still designed to remain responsive to changes in price.
The purpose is not simply to combine two moving-average names, but to create a specific transformation of the selected source before it is used in the strength calculation.
Why Use Two TEWMA Lengths?
A single moving-average length forces the indicator to represent trend using one specific time horizon.
The dual-length structure provides two different perspectives.
The shorter TEWMA can respond more quickly to changes in price structure.
The longer TEWMA changes more gradually and represents a broader trend component.
Averaging them produces the composite TEWMA used by the strength calculation.
This makes the baseline less dependent on a single smoothing horizon and combines faster and slower trend information into one reference value.
Why Combine TEWMA With ATR?
The TEWMA establishes the trend reference.
ATR establishes the volatility scale.
These measurements answer different questions.
The TEWMA asks:
"Where is the smoothed trend baseline?"
ATR asks:
"How large are the market's typical recent price movements?"
The strength calculation combines those two concepts by measuring the distance between price and trend baseline in ATR units.
This is what transforms the indicator from a simple moving-average distance oscillator into a volatility-adjusted trend-strength measurement.
Why Add EMA Smoothing to the Strength Measurement?
The raw strength calculation can fluctuate as price moves around the composite TEWMA.
Applying an EMA after normalization provides a second representation of that strength.
Importantly, the EMA is not smoothing the original price before the TEWMA calculation. It is smoothing the completed strength measurement.
This means the smoothed line represents the recent history of the normalized trend-strength state itself.
The combination therefore creates two layers:
Raw Strength = current normalized displacement
Smoothed Strength = smoothed normalized displacement
How the Components Work Together
The complete calculation can be simplified into the following chain:
Selected Source
↓
WMA using Primary Length
↓
TEMA using Primary Length
↓
TEWMA 1
And simultaneously:
Selected Source
↓
WMA using Primary Length × Multiplier
↓
TEMA using the Longer Length
↓
TEWMA 2
The two are then combined:
TEWMA 1 + TEWMA 2
↓
Average
↓
Composite TEWMA
At the same time:
High, Low and Close
↓
True Range
↓
ATR
The final strength calculation then becomes:
(Close - Composite TEWMA) / ATR
The resulting strength value is finally passed through:
EMA(Strength, Smoothing Length)
to create the smoothed strength measurement.
The entire indicator can therefore be summarized as:
Weighted price smoothing → TEMA lag reduction → dual-length trend baseline → ATR volatility normalization → strength oscillator → EMA strength smoothing
Visual Interpretation
The indicator uses several visual elements to make the calculations easier to interpret.
The raw strength line changes color according to whether it is above or below zero.
The smoothed strength line independently changes color according to its own relationship with zero.
The areas between each oscillator and the zero line are filled using the corresponding directional color.
The background highlights are reserved for conditions where the selected upper or lower threshold is exceeded.
This creates a visual hierarchy:
* Zero line = directional reference.
* Raw strength = immediate normalized displacement.
* Smoothed strength = slower strength state.
* Upper/lower thresholds = stronger normalized displacement regions.
* Background highlights = visual identification of threshold conditions.
Using the Indicator
The indicator can be used as a contextual trend-strength tool rather than as a standalone automated trading system.
The zero line can be used to identify whether price is currently above or below the composite TEWMA.
The raw strength can be observed when a trader wants a more responsive measurement of changes in the price-to-trend relationship.
The smoothed strength can be observed when a trader wants a slower representation of that same relationship.
The upper and lower thresholds can be adjusted to change how extreme a normalized displacement must become before the background highlights the condition.
Increasing the absolute threshold values makes the highlighted conditions more selective because a larger normalized displacement is required.
Reducing the absolute threshold values makes the threshold conditions easier to reach.
Similarly, changing the TEWMA lengths changes the responsiveness of the underlying trend baseline, while changing the ATR length changes the volatility reference used for normalization.
The smoothing length controls how quickly the smoothed strength responds to changes in the raw strength.
These parameters therefore influence different parts of the calculation rather than simply changing the same signal in different ways.
Important Considerations
This indicator measures the relationship between price, a composite TEWMA trend baseline, and ATR-based volatility.
It does not predict future prices and does not guarantee that a trend will continue after a strength condition appears.
A strong positive strength value means that price is currently positioned substantially above the composite TEWMA relative to the calculated ATR. It does not mathematically guarantee that price will continue higher.
Likewise, a strong negative value means that price is substantially below the composite TEWMA relative to ATR, but it does not guarantee continued downside movement.
The indicator also does not contain position sizing, stop-loss, take-profit, trade execution, or backtesting logic.
It should therefore be understood as a trend-strength and market-context tool , rather than a complete trading strategy.
Default Calculation Structure
With the default parameters, the indicator uses:
* Source: Close
* Primary Length: 50
* Multiplier: 2
* Secondary Length: 100
* ATR Length: 40
* Smoothing Length: 50
* Upper Threshold: 1
* Lower Threshold: -1
This results in a composite trend baseline constructed from 50-period and 100-period WMA-to-TEMA structures, followed by ATR normalization using a 40-period ATR and EMA smoothing of the resulting strength value using a 50-period EMA.
The default +1 and -1 thresholds represent positive and negative normalized displacement levels around the composite TEWMA.
Summary
TEWMA Trend Strength combines multiple calculations into one normalized trend-strength framework.
Rather than using a single moving average and simply checking whether price is above or below it, the script first constructs two TEWMA components using different lengths, averages them into a composite trend baseline, measures the distance between closing price and that baseline, and then normalizes that distance by ATR.
The result is a strength value where both direction and magnitude are meaningful.
The zero line identifies the side of the composite TEWMA on which price is currently positioned.
The magnitude of the value expresses that displacement relative to recent volatility.
The additional EMA smoothing provides a slower view of the strength condition, while the configurable upper and lower thresholds provide a visual way to identify larger normalized deviations.
The combination of WMA + TEMA creates the underlying trend representation, the dual-length structure combines faster and slower trend information, ATR converts the price displacement into a volatility-adjusted measurement, and EMA smoothing provides a second, slower representation of the resulting strength.
Together, these components form a single oscillator designed to help visualize trend direction, normalized trend strength, and the persistence of that strength within one calculation framework.
Enjoy!
مؤشر

Hybrid Breakout | VCP-Inspired TrendTrend Squeeze Breakout
Trend Squeeze Breakout is a trend-following momentum strategy designed to identify stocks in strong established uptrends that are consolidating into relatively tight trading ranges before attempting a breakout.
The strategy combines a simplified Minervini-style trend template, volatility contraction, volume confirmation, and stop-entry breakout execution. It is designed primarily for swing trading and is intended to participate in strong upward price expansions while filtering out many breakouts occurring in weak or declining trends.
Strategy Explanation
The strategy follows a simple sequence:
Identify a strong uptrend
A long setup requires:
Price above the 50-period SMA
50 SMA above the 150 SMA
150 SMA above the 200 SMA
200 SMA rising
200 SMA continuing to rise over the selected lookback period
50 SMA not declining
This establishes that the stock is already in a structurally bullish environment before considering an entry.
Identify a volatility contraction
The strategy looks for periods where recent price movement has become unusually tight.
It evaluates both:
Recent high-low range
Recent closing-price range
The high-low range is also compared with its historical percentile over the selected lookback period. This allows the strategy to identify relatively quiet consolidation periods rather than relying on a fixed volatility threshold alone.
Confirm volume
When the volume filter is enabled, breakout volume must exceed the moving-average volume baseline by the selected multiplier.
The default requirement is:
Volume > 20-period average volume × 1.2
This is intended to provide additional confirmation that the breakout is supported by meaningful participation.
Enter on a breakout
When the trend, contraction, and volume conditions are satisfied, the strategy places a stop-entry order above the recent high.
The default breakout lookback is 3 bars, allowing the strategy to attempt to enter as price moves through the recent consolidation high rather than simply buying while the stock remains inside the range.
Manage the position
Positions use tiered profit-taking:
25% closed at +10%
50% closed at +20%
Remaining position closed at +30%
Default stop loss at -8%
This allows the strategy to realize some profits during the initial move while maintaining exposure to larger momentum extensions.
Features
Trend Filter — 50/150/200 SMA bullish alignment
Long-Term Trend Confirmation — Requires the 200 SMA to be rising
Volatility Squeeze Detection — Identifies unusually tight recent ranges
Range Percentile Filter — Compares current volatility with historical volatility
Close-Range Filter — Detects tight price consolidation
Volume Confirmation — Optional volume expansion requirement
Stop-Entry Breakout — Enters only when price breaks the recent high
Tiered Profit Taking — Three configurable profit targets
Percentage-Based Stop Loss — Adjustable downside protection
Date Filter — Allows users to restrict backtests to a specific period
Configurable Parameters — Trend, volatility, volume, breakout, and risk settings can all be adjusted
Tips for Use
Use on liquid stocks
The strategy is generally better suited to liquid stocks and ETFs with sufficient trading volume. Extremely illiquid securities can produce unrealistic backtest results because of spreads and execution differences.
Start with daily charts
The strategy is particularly suited to identifying multi-day or multi-week momentum breakouts. Daily charts are a good starting point when evaluating the strategy.
Avoid optimizing every parameter
The many adjustable parameters make it possible to overfit the strategy to a particular stock or historical period. Test parameter changes across multiple securities and different market environments rather than optimizing exclusively for one chart.
Treat the volume filter as confirmation, not a guarantee
High volume can strengthen a breakout signal, but it does not guarantee that the breakout will succeed.
Test across different market conditions
Trend-following breakout systems typically perform differently during strong bull markets, corrections, sideways markets, and high-volatility periods. Evaluate results across multiple market regimes before relying on the strategy.
Pay attention to execution
The strategy uses stop-entry orders above recent highs. In live trading, gaps, slippage, spreads, and intrabar price movement can cause actual execution prices to differ from backtested results.
Important Note
This strategy is inspired by trend-template and volatility-contraction concepts, but it is not a complete implementation of a textbook VCP. It uses a simplified statistical contraction model rather than explicitly identifying multiple successive contractions, contraction depths, and their associated volume characteristics.
Backtest results are hypothetical and do not guarantee future performance. Always consider commissions, slippage, liquidity, position sizing, and market conditions when evaluating a strategy.
Recommended starting configuration: Daily timeframe, liquid stocks, default trend filter, volume confirmation enabled, and the default tiered risk-management settings.
استراتيجية

Positioning Flow Index by DGTPositioning Flow Index (PFI) - Price & Open Interest Positioning Analysis
Positioning Flow Index (PFI) is a positioning-analysis framework designed to evaluate how price movement and Open Interest interact to reveal changes in market participation and positioning.
Rather than interpreting price direction alone, PFI combines normalized Price and Open Interest changes to identify four distinct positioning regimes:
Long Buildup - Short Buildup - Short Covering - Long Unwinding
The indicator evaluates the magnitude and direction of both Price and Open Interest through Z-score normalization , allowing unusually strong changes to be distinguished from ordinary market fluctuations.
In addition to the Positioning Flow Index itself, PFI provides a Flow State , Signal Strength , Price Sentiment , and an optional State Ribbon to help traders interpret the underlying positioning environment.
The objective is not to produce a simple Buy or Sell signal, but to provide a structured view of whether price movement is being accompanied by increasing or decreasing market participation and how strongly those two dimensions are aligned.
The Positioning Flow Model
Price + Open Interest
Price and Open Interest provide two different perspectives on market behavior.
Price describes the direction and relative strength of the current price movement.
Open Interest describes the change in outstanding derivative positions and provides an additional dimension for evaluating whether market participation is expanding or contracting.
PFI normalizes both dimensions using Z-scores , measuring how unusual the current Price and Open Interest changes are relative to their recent history.
A positive Z-score indicates a move above its recent average, while a negative Z-score indicates a move below its recent average.
This allows the indicator to distinguish between ordinary price/OI fluctuations and more statistically unusual changes in positioning.
Flow State
The Flow State classifies the relationship between Price and Open Interest into four positioning regimes.
LONG BUILDUP (LB)
Price is rising while Open Interest is increasing.
This combination indicates upward price pressure accompanied by expanding participation, a condition commonly associated with new long positioning.
SHORT BUILDUP (SB)
Price is falling while Open Interest is increasing.
This indicates downward price pressure accompanied by expanding participation, commonly associated with new short positioning.
SHORT COVERING (SC)
Price is rising while Open Interest is decreasing.
Price is moving upward while outstanding positions contract, a condition commonly associated with short positions being closed.
LONG UNWINDING (LU)
Price is falling while Open Interest is decreasing.
Price is moving downward while outstanding positions contract, a condition commonly associated with long positions being closed.
When Price and Open Interest do not both exceed the required activity threshold, the market is classified as NEUTRAL .
Neutral does not mean that the market is inactive. It means there is insufficient synchronized Price + Open Interest evidence to assign one of the four directional positioning states.
Positioning Flow Index
The Positioning Flow Index provides a bounded -100 to +100 representation of positioning flow.
Its calculation combines the normalized Open Interest and Price changes through a selectable Flow Model.
Model A — OI × sign(Price)
Open Interest determines the magnitude of the flow while Price determines its direction.
This model emphasizes participation strength and can produce a strong reading even when the price movement itself is relatively small.
Model B — OI × Price
The Open Interest and Price Z-scores are multiplied directly.
This captures the interaction between both dimensions, but unusually large Price Z-scores can have a greater influence on the resulting flow.
Model C — Price Direction × OI Magnitude × Price Confirmation
Price determines directional pressure, Open Interest determines participation magnitude, and the absolute Price Z-score contribution is capped to reduce the influence of extreme price moves.
This model separates the directional role of Price from the participation role of Open Interest and is the default model.
The three models are intentionally provided as different ways of interpreting the same underlying Price/OI relationship rather than as competing signals.
Signal Strength
Not every Flow State carries the same level of evidence.
PFI therefore calculates a Signal Strength based on two independent components:
Participation — derived from the magnitude of the Open Interest Z-score.
Confirmation — derived from the magnitude of the Price Z-score.
Both components are capped at 2σ and combined using their geometric mean:
Signal Strength = √(Participation × Confirmation)
The result is expressed as a percentage and provides a measure of how strongly Price and Open Interest are moving together.
Higher values indicate stronger synchronized evidence.
Importantly, Signal Strength is not a probability that the current move will continue. It measures the strength of the evidence supporting the current Flow State.
Early Flow Warning & Confirmed Signals
PFI separates early developing conditions from confirmed state transitions .
Early Flow Warning uses the live, still-forming candle to identify a potential transition before the candle closes. These warnings are intentionally provisional and may change or disappear as Price or Open Interest changes during the candle.
Confirmed Flow Signals are evaluated only when the candle closes.
Once confirmed, the LB / SB / SC / LU marker is based on the completed candle and does not change afterward.
This distinction allows traders to see developing positioning changes early while maintaining a clearly defined, non-repainting confirmation layer.
The indicator therefore does not attempt to hide the natural evolution of live Price and Open Interest data. Instead, it explicitly separates early information from confirmed information .
Price Sentiment
The optional Price Sentiment component provides an independent view of price behavior.
Price movement is smoothed and normalized over its recent range, then expressed on the same -100 to +100 scale as the Positioning Flow Index.
This allows Price Sentiment and PFI to be compared directly:
Price Sentiment describes the current character of price movement.
PFI incorporates both Price direction and Open Interest positioning.
The two therefore answer different questions and can provide additional context when interpreted together.
Flow State Ribbon
The optional State Ribbon provides a continuous visual representation of the current Flow State directly on the main price chart.
Teal represents Long Buildup.
Red represents Short Buildup.
Yellow represents Short Covering.
Orange represents Long Unwinding.
Gray represents Neutral conditions.
The intensity of the ribbon is influenced by Signal Strength, allowing stronger positioning conditions to stand out visually without requiring additional labels on every bar.
Flow Dashboard
The optional Flow Dashboard summarizes the current positioning environment through five key readings:
• Flow State — the current Price/OI positioning regime.
• Signal Strength — the strength of synchronized Price + OI evidence.
• PFI — the bounded Positioning Flow Index.
• Price Z-Score — how unusual the current price movement is relative to its recent history.
• OI Z-Score — how unusual the current Open Interest change is relative to its recent history.
Together, these readings provide both the classification and the underlying measurements used to interpret it.
How to Read PFI
PFI is best used as a contextual positioning tool rather than a standalone entry system.
A strong Long Buildup suggests rising price accompanied by expanding Open Interest.
A strong Short Buildup suggests falling price accompanied by expanding Open Interest.
A strong Short Covering condition suggests rising price while Open Interest contracts.
A strong Long Unwinding condition suggests falling price while Open Interest contracts.
The Signal Strength helps distinguish stronger synchronized conditions from weaker ones, while the PFI provides a continuous measure of directional positioning flow.
As with all market-structure and positioning analysis, these states describe the current relationship between Price and Open Interest—they do not guarantee future price direction.
Important Notes
PFI is designed for markets where Open Interest data is available.
The Flow State is based on the relationship between Price and Open Interest and should not be interpreted as a direct measure of individual trader intent.
Early Flow Warnings are intentionally repaintable during the active candle because they use live, developing Price and Open Interest data.
Confirmed Flow markers are non-repainting because they are generated only after the candle has closed.
The selected Flow Model affects the PFI calculation, while the Flow State and Signal Strength provide separate measurements of the underlying Price/OI relationship.
Summary
Positioning Flow Index brings Price and Open Interest together into a structured framework for analyzing market positioning.
Rather than asking only "Is price going up or down?" , PFI asks a broader question:
"What is happening to market positioning as price moves?"
By combining Flow State , Signal Strength , Positioning Flow Index , Price Sentiment , and confirmed versus early signals , PFI provides a multi-dimensional view of positioning that can be incorporated into discretionary market analysis and existing trading frameworks.
DISCLAIMER
This script is intended for informational and educational purposes only. It does not constitute financial, investment, or trading advice. All trading decisions made based on its output are solely the responsibility of the user.
مؤشر

PDH/PDL + Absorption ("Iceberg" Proxy)Plots prior-day high/low and flags potential absorption (iceberg-style) activity at those levels: bars with abnormally high volume but abnormally tight range, occurring near a key level. High volume with little price movement suggests large resting orders are absorbing aggression without letting the level break — a classic footprint ahead of either a rejection or an eventual breakout once the absorbed side gives up.
What it plots
- Prior Day High (red line) / Prior Day Low (green line)
- Optional Premarket High/Low (orange/blue circles, 4:00–9:30 ET, off by default)
- Fuchsia triangle + "ABS" label with volume printed, on any bar flagged as absorption
Signal logic
A bar is flagged when all conditions are met:
1. Volume > user-defined multiple of its N-bar average (default 1.8x over 20 bars)
2. Range (high−low) < user-defined multiple of its N-bar average (default 0.6x over 20 bars)
3. (Optional, on by default) Close is within a user-defined tolerance of PDH or PDL
Inputs
- Show Prior Day High/Low — toggle
- Show Premarket High/Low — toggle
- Level Proximity Tolerance (points) — how close price must be to PDH/PDL to qualify; scale this to your instrument's typical range (tighter for MES/M2K, wider for ES/RTY)
- Volume Lookback / Range Lookback (bars) — averaging windows
- Volume Threshold (x average) — higher = rarer, stronger signals
- Range Threshold (x average) — lower = requires tighter compression
- Only Flag Near PDH/PDL — restrict signal to key levels vs. anywhere on chart
How to use it
This is a confirmation tool, not an entry trigger. An ABS flag at PDH/PDL means volume is being absorbed at that level without a clean break — treat it as "this level is being defended right now." Wait for the next bar(s) to resolve:
- Close pushes through the level on continued volume → likely real break, absorption failed
- Price rejects back away from the level → absorption held, fade back into range
An alert condition ("Absorption/Iceberg Detected") is included — right-click the indicator on the chart → Add Alert to get notified instead of watching manually.
Notes
- PDH/PDL are computed via request.security on the daily timeframe with lookahead_off, so they won't repaint.
- Defaults are a reasonable starting point, not calibrated to any specific instrument — backtest/observe before trusting the thresholds on a new symbol.
- Not a "true" iceberg indicator because it infers absorption from OHLCV (high volume + tight range) rather than reading the actual order book, so it can't confirm a hidden order exists — but it's a useful free proxy for spotting "high effort, low result" zones worth watching, especially layered with PDH/PDL, VWAP, or GEX levels. مؤشر

Consolidation Ranges & Breakout Map [MQLSoftware]Consolidation Ranges & Breakout Map reads the market's sideways regime as a measurable object. It detects compression with an authored Range Compression Index, fixes the consolidation box only after enough confirmed evidence, tracks how the box resolves — breakout, measured-move projection reached, false break, or expiry — and reports the measured base rates of those outcomes counted on the chart's own history.
This is a visual analytical tool for chart study. It does not execute trades and does not provide financial advice.
Key Features
Consolidation boxes fixed on confirmed evidence only: a candidate must hold the compression threshold for a minimum number of confirmed bars before it becomes a live range — borders never move backwards once fixed
Amber forming frame while compression is still building, so you see the candidate before it commits
Breakouts by confirmed CLOSE beyond the border plus an ATR buffer — wicks and gaps alone never trigger a breakout
Measured-move projections (1× and 1.618× the range height by default) drawn from the broken border — a geometric reference derived from the range's own size
Outcome tracking on confirmed bars: ✓ printed when the 1× projection is reached, ✕ false break when price closes back inside within the fakeout window, quiet expiry when the resolution window runs out
Range invalidation discipline: a box that "breathes" beyond its edge-update budget or outgrows the maximum width is annulled and excluded from the statistics, so pseudo-ranges never contaminate the base rates
Measured base rates in the panel: share of upside breakouts, share that reached the 1× projection, share of false breaks, median bars to 1×, median range length — each with its sample size
Higher-timeframe context band (rolling HTF high/low), optional volume-expansion quality gate, four panel modes, five confirmed-bar alerts plus one dynamic JSON alert
Core Concept — what is original here
TradingView has many box-drawing and Darvas-style tools; most fix a rectangle from a simple highest/lowest lookback and leave the interpretation to the reader. This script makes the detector itself measurable and then closes the loop by counting what actually happened. Three specific algorithmic elements:
1. The Range Compression Index (RCI). A 0–100 composite authored for this script: RCI = 100 · (0.40 · ineff + 0.35 · vc + 0.25 · cont), where ineff = 1 − min(ER, 1) is movement inefficiency (the inverse Kaufman efficiency ratio — net displacement over the evaluation window divided by the bar-to-bar path traveled), vc is volatility compression (short ATR against a 4× longer ATR window, rescaled to 0..1), and cont is containment — the share of closes inside the central 90% of the candidate box. Each component measures a different facet of "sideways": no net progress, contracting volatility, clustering closes. A candidate also has to pass a geometry gate — its width may not exceed a configurable multiple of ATR. The sensitivity presets set the RCI threshold (Low 70, Normal 62, High 55).
2. The consolidation → breakout state machine. SEEKING → FORMING → LIVE → BREAK UP / BREAK DOWN → RESOLVED / FALSE BREAK / EXPIRED, with every transition on confirmed bars only. The box is fixed only after the minimum number of confirmed compression bars. A fixed border may be widened by a wick within the edge tolerance a limited number of times — each update on a confirmed bar and counted; beyond the budget the box is invalidated and never enters the statistics. A breakout requires a confirmed close beyond the border plus the ATR buffer; a bar that pierces both borders resolves by its close; a close back inside within the fakeout window is classified as a false break (checked before the projection within the same bar, deliberately conservative). The resolution window defaults to three times the range's own duration, capped at 200 bars.
3. Measured base rates. The panel reports observed frequencies counted on this chart's loaded history: how often ranges broke upward, how often the breakout reached the 1× measured-move projection, how often the break turned out false, the median bars to 1× and the median range length — each with its sample size. Below a minimum sample the panel prints the sample gate instead of a percentage, so small-sample noise is never dressed up as a statistic. Observed frequencies, not assumptions, and no claims attached to them.
Anatomy of the Display
Live range box — steel border with a faint fill, header with the range's duration and height in ATR; midline optional
Amber dashed frame — a FORMING candidate: compression is building but the box is not yet committed
▲ / ▼ breakout markers on the confirmed breakout bar (Descriptive or Compact style)
Dashed projection lines from the broken border with 1× and 1.618× labels at the right edge
✓ 1× printed where the projection is reached, ✕ false break where price closed back inside
Translucent higher-timeframe band with the rolling HTF high/low and a timeframe tag
Panel (Off / Minimal / Normal / Large): state in plain words (SEEKING / COMPRESSING n/m / RANGE LIVE / BROKE UP / BROKE DOWN / FALSE BREAK), the live Range Compression Index with a five-block meter, range height and duration, position inside the range, and in Large mode the measured base-rate section
Notes on Repainting
All state transitions, breakout/outcome markers, statistics counters and alerts fire on confirmed bars only and never move once printed
Box borders are fixed on the confirming bar and never move backwards; the only permitted change is a forward widening within the edge tolerance, on a confirmed bar, a limited number of times
The live box's right edge, the FORMING candidate frame and the panel's live rows update intrabar — visual context, not signals
The higher-timeframe band uses one request.security call with lookahead off and reads the previous confirmed HTF value — no future data anywhere
Display inputs only gate drawing; they never change the state machine, the counters or the alerts
Typical Analysis Workflow
Watch the panel's Compression row: a rising RCI with an amber forming frame means a candidate is building
When RANGE LIVE prints, read the box header — a 40-bar range 1.2 ATR tall is a different regime than an 8-bar pause
Treat the breakout marker as a measured event, not an invitation: the base rates tell you how often breakouts on this chart reached the projection versus failed back into the box
Use the false-break share as regime context — some markets punish breakout chasing far more often than others, and the panel will say so with a sample size
Check the higher-timeframe band: a local range at the edge of the senior range is a different situation than one in the middle of it
Configuration
Range Detection — compression sensitivity preset (RCI threshold), evaluation window, minimum confirmed bars to fix a box, maximum width in ATR, containment threshold, edge tolerance and the edge-update budget
Breakout — ATR buffer for the confirmed close, fakeout window, both projection multiples, resolution window (auto = 3× range duration), optional volume-expansion gate with its multiple
Higher-Timeframe Context — band on/off, HTF (empty = auto: 4× chart timeframe capped at 1W), HTF range length
Statistics — base-rate section on/off, minimum sample to display a percentage
Visual — panel size and position, marker style (Descriptive / Compact), projections, midline, how many past ranges to keep, and the four identity colors (all inputs; dark-theme defaults)
Markets and Timeframes
Any symbol and timeframe. All thresholds are expressed in ATR and percentiles of the chart's own behavior, so the detector self-calibrates per instrument. On symbols without volume data the volume gate is ignored automatically and the panel says so. On slow timeframes (1D/1W) the sample gate will hide the percentages until enough ranges have resolved — that is the honesty rule, not a defect.
Alerts
Range confirmed · Range breakout up · Range breakout down · False break · 1× projection reached — all evaluated on confirmed bars from the same event flags that draw the markers, plus one dynamic alert() with a JSON payload (event, symbol, timeframe, box borders, break level, height in ATR). مؤشر

SMC Swing Structure + Order Blocks + CHoCH VolumeOrderBlock Radar — SMC Swing & Volume CHoCH
A Smart Money Concepts (SMC) toolkit that maps market structure and order blocks the way institutional order flow is typically read — without drowning your chart in noise from minor pivots.
What it does:
📊 Swing Structure (BOS / CHoCH) — Tracks the market's real trend using major swing highs and lows, not every small wiggle. A break with the trend is marked BOS (Break of Structure); a break against the trend is marked CHoCH (Change of Character) — the earliest, most reliable signal that momentum may be shifting.
📦 Order Blocks — Automatically plots the last opposing candle before each structural break — the classic "footprint" of where smart money likely entered before the move. Boxes extend forward and auto-delete once price mitigates them, so your chart only shows blocks that are still relevant.
🔊 Volume-Confirmed CHoCH — Not all character changes are equal. This indicator checks volume against its recent average at the moment of a CHoCH — when a break comes with a volume spike, it's tagged separately ("CHoCH ⚡Vol") and fires its own dedicated alert, helping you filter high-conviction reversals from low-volume fakeouts.
🔔 Built-in Alerts — Six alert conditions ready to go: bullish/bearish CHoCH, bullish/bearish CHoCH with volume confirmation, and bullish/bearish BOS. Set them once and get pinged the moment structure shifts.
Customizable settings:
Swing pivot sensitivity (how "major" a swing needs to be to count)
Optional internal (minor) structure overlay for extra context
Order block count limits, lookback range, and mitigation method (wick vs. close)
Volume average length and spike threshold
Full color and label control
How to use it: Best used as a structural context tool — combine CHoCH signals with your own entry confirmation (order block retest, FVG fill, liquidity sweep, etc.) rather than trading the label in isolation. Works on any timeframe and asset class; higher timeframes and liquid instruments tend to give the cleanest structure.
This is a technical analysis tool, not financial advice — always manage risk and confirm signals with your own strategy. مؤشر

QD Session Range BoxesThis indicator draws boxes around the price range of the Asia, London, and New York sessions, automatically calculated with no manual setup required.
How to use it
The boxes let you visually track each session's movement and trend at a glance. Instead of manually marking session highs and lows, you get an instant, clear picture of where price moved during each session — useful for spotting range expansion, session momentum, and how one session's range relates to the next.
Session times (NY time):
* Asia: 20:00 – 00:00
* London: 02:00 – 07:00
* New York: 09:30 – 12:00
Features
* Toggle each session (Asia, London, NY) on/off independently
* Toggle historical boxes on/off, or limit how many days back are shown
* Adjustable label offset lets you position session names exactly where you want above the boxes
* Style controls let you individually show/hide boxes and labels, and choose whether inputs (like Days to Show and Label Offset) appear on the status line, for a cleaner chart
Notes
Colors are fixed (purple, blue, green) for a clean, consistent chart display. مؤشر

Elite Hybrid ORB [Artillery]Elite Hybrid ORB is a session opening-range breakout (ORB) strategy with a session-anchored VWAP, an EMA trend ribbon and a live status dashboard. This publication consolidates the previous per-market "MNQ Elite Hybrid" and "NKD Elite Hybrid" scripts into one configurable engine: the trading logic was identical in both, so instead of separate market-specific publications there is now a single script with a session preset input (US Open, Asia/Nikkei hours, or a fully custom window). Pick the preset that matches your market and session - nothing else about the engine changes.
WHAT IT DOES
1) Opening range - at the start of the selected session, the script records the high and low of the first N minutes (default 30). That range becomes the day's decision zone.
2) Breakout entries - after the range completes, a close above the range high plus a buffer (a percentage of the range width) signals a long; a close below the range low minus the buffer signals a short. A long-only mode is included for markets or sessions where you do not want to fade strength.
3) Bracket exits - every entry ships with a stop at the opposite side of the range and a take-profit at a multiple of the range width (default 1x). Positions are force-flattened 15 minutes before the session ends, so nothing is held past the window.
4) Guard rails - a maximum number of trades per session, a sanity cap on the opening-range width in ticks (abnormally wide ranges are skipped), and one position at a time.
The session VWAP and the 9/21 EMA ribbon are context layers: they do not gate entries, they show at a glance whether the breakout is travelling with or against the session's volume-weighted mean and the short-term trend.
WHY ONE SCRIPT INSTEAD OF TWO
The old MNQ and NKD versions shared this exact engine and differed only in the hard-coded session window and the long-only default. That is configuration, not logic, so it belongs in an input. The preset selects only the time window (all times anchored to New York): US Open covers 9:30-13:00 ET, Asia covers 19:00-23:00 ET (the Tokyo morning), and Custom exposes the window directly for any other market.
BACKTEST PROPERTIES (documented so you can judge the report)
The report uses realistic properties for one micro futures contract: 50,000 initial capital, fixed size of 1 contract, commission of 4.00 per contract per side, 2 ticks of slippage, 10% margin. Risk per trade is defined by the opening-range width (stop at the far side of the range), which on a micro contract is a small fraction of capital. The defaults shown were run on MNQ, 5-minute bars, US Open preset. Other symbols, sessions or timeframes need their own settings - especially the max-range-width cap, which should be set relative to the symbol's tick size. Backtest results are historical, vary with the tested window, and do not predict future performance.
WHAT YOU SEE ON THE CHART
- The opening range as a shaded zone with high/low lines, midpoint crosses and dotted buffer levels
- The session VWAP (gold) and the EMA 9/21 ribbon tinted by trend direction
- Entry labels with the exact entry, stop and target prices, plus the strategy's own trade markers
- Background tints for the range-building phase, the active trading window and the pre-close flatten warning
- A dashboard with the range status and width, VWAP bias, trend state, ATR, fill count, position and the active session preset
Each visual layer has its own on/off input.
BEHAVIOUR NOTES
Entries are evaluated on closed bars only (no intrabar order generation, no higher-timeframe requests, no lookahead). The opening range only becomes tradable after its build window has fully elapsed, so the zone does not repaint. Strategies in Pine v6 alert through their order fills - create an alert on the strategy and select order-fill events.
This is an educational and analytical tool for studying session breakout behaviour. It is not financial advice. استراتيجية

Volatility Regime Trend Ribbon [Pineify]Volatility Regime Trend Ribbon
Overview
This overlay adapts smoothing as markets change. It ranks ATR, selects a regime, and adjusts trend speed and ribbon width.
Key Features
Three ATR percentile regimes.
Regime-specific trend lengths and band scales.
Optional colors, confirmed markers, and alerts.
How It Works
ATR is ranked over a rolling window. Low ranks select low volatility, high ranks select high volatility, and middle ranks select normal volatility. Warm-up uses the normal state.
The selected length drives a recursive EMA-style center. Ribbon edges equal the center plus or minus ATR times the base multiplier and regime scale. This is a price boundary, not a statistical confidence interval. Direction turns bullish after a confirmed close above the upper edge, bearish below the lower edge, and otherwise retains its prior state.
Trading Ideas and Insights
Colors separate quiet, ordinary, and elevated ranges. A band exit can frame a direction change; movement inside stays unresolved. Gaps or thin trading can add lag and false transitions. No output is an automatic trade.
How Multiple Indicators Work Together
ATR measures range, percentile rank adds context, adaptive smoothing changes speed, and the band supplies the direction threshold. They form one engine without external data.
Unique Aspects
The original design links volatility to smoothing speed and band scale, not just color. Retained direction inside the band adds hysteresis; alerts distinguish regime and direction changes.
How to Use
Apply it to a liquid market and let the percentile window warm up.
Tune lengths and band scales for the symbol and timeframe.
Read center color as direction and ribbon color as regime.
Use confirmed alerts with independent risk controls.
Customization
ATR Length controls range sensitivity; Percentile Lookback controls context. Thresholds define states, lengths set speed, and band inputs set transition distance. Display layers are optional. Current values can change intrabar; markers and alerts require a confirmed close.
Conclusion
This ribbon organizes volatility regime and ATR percentile context for 15-minute to daily charts. It uses past and present data, remains lagging and parameter-sensitive, and makes no performance claim.
مؤشر

ZENKO Session FVG# ZENKO FVG — Session-Based Fair Value Gap
ZENKO FVG is a clean Fair Value Gap (FVG) indicator designed to help traders identify price imbalances within selected trading sessions while keeping the chart simple and easy to read.
The indicator was developed around the ZENKO trading approach, where Fair Value Gaps are used as potential areas of interest rather than standalone entry signals.
## Core Concept
A Fair Value Gap represents an imbalance created during strong price displacement. These areas may become relevant when price later revisits them as the market searches for liquidity or rebalances inefficient price delivery.
ZENKO FVG automatically detects these imbalances and displays them directly on the chart.
## Key Features
• Automatic Bullish & Bearish FVG Detection
Identifies three-candle Fair Value Gap structures automatically.
• Session-Based Filtering
Allows traders to focus on FVGs formed during selected trading sessions such as Asia and London, reducing unnecessary zones from outside the intended trading period.
• Clean FVG Zones
Bullish and bearish FVGs are displayed as clear zones without overcrowding the chart.
• FVG Midpoint
Each FVG can display its 50% equilibrium level, providing an additional reference point when price returns to the imbalance.
• Customizable Display
Users can adjust FVG colors, zone appearance, session settings and other visual parameters according to their chart preference.
• Multiple Timeframe Application
The indicator can be applied across different chart timeframes depending on the trader's execution model.
## ZENKO Trading Approach
ZENKO FVG is primarily designed to help locate higher-quality areas of interest.
A typical ZENKO workflow may involve:
Higher-Timeframe FVG → Price returns into the area → Liquidity reaction or sweep → Lower-timeframe imbalance / IFVG confirmation → Execution.
For example, a trader may identify an important FVG on M15 and then move to lower timeframes such as M1–M4 to look for additional confirmation.
The indicator itself does not determine whether a trade should be taken. Market structure, liquidity, displacement, session context and risk management should still be considered.
## Purpose
The main objective of ZENKO FVG is simple:
**Reduce chart noise and make relevant Fair Value Gaps easier to identify.**
Instead of manually marking every imbalance, traders can use the indicator to quickly visualize FVG locations and focus their attention on price action around those areas.
## Important
ZENKO FVG is an analytical tool and should not be treated as an automated buy or sell system.
Fair Value Gaps do not guarantee that price will react, reverse or continue from a specific level. Traders should combine the indicator with their own market analysis, confirmation criteria and risk-management rules.
Past market behavior does not guarantee future results.
**ZENKO — Find the imbalance. Wait for confirmation. Execute with discipline.** مؤشر

Volume Liquidity Trend [ChartPrime]Volume Liquidity Trend
🔶 OVERVIEW
Standard trend indicators track price direction but completely ignore the volume profile structural footprints left behind during the trend's development. The Volume Liquidity Trend indicator solves this by combining advanced mathematical smoothing with a dynamic, trend-isolated Volume Node Mapping Engine .
This script filters price streams through a stabilization algorithm to establish a core trend, tracks the exact duration of that trend lifecycle, and continuously projects significant historical volume anchors into the future as active liquidity levels until price completely invalidates or "mitigates" them.
🔶 HOW IT WORKS
The indicator executes its calculations through a multi-tiered pipeline:
Kalman-Based Trend Filter: The indicator filters a user-defined price source using an adaptive stabilization equation. It calculates volatility bands relative to this smoothed average (using a 2 x ATR boundary). A close above the upper band establishes a Bullish Trend , while a close below the lower band triggers a Bearish Trend .
Trend-Isolated Volume Mapping: When a trend changes, a clean data sweep resets the history array. The script tracks every single candle inside the active trend and identifies the absolute highest transaction point (the 100% Peak Volume Anchor).
Normalized Liquidity Vectors: Every candle within the trend has its volume calculated relative to that peak volume anchor (0% to 100%). If a historical level passes your volume cutoff threshold, the script maps a horizontal liquidity line from that candle's average price (HLC3) out into the future margin space.
Automated Mitigation Tracking: The script continuously tests these horizontal volume tracks against historical price action. If subsequent candle bodies cross through an established volume line, that line is marked as "mitigated" (crossed) and automatically stripped from the screen to keep your chart uncluttered.
🔶 KEY FEATURES
Adaptive Vector Widths & Gradients: Unmitigated volume lines feature a dynamic visual profile. Lines are automatically thicker and more heavily saturated based on their relative volume strength. Furthermore, lines dynamically shift color depending on whether price is trading above (Bullish Support) or below (Bearish Resistance) the volume node.
Anomalous 100% Peak Tracker: Includes a specialized alert line that forces the historical 100% transaction anchor to remain visible as a bright dashed line only after price has broken through it, signaling a breached institutional base.
Real-Time Trend Analytics Panel: A sleek UI dashboard positioned at the top right tracking:
• Current Trend Status: Active market direction matching the volatility bands.
• Trend Duration: Exact bar runtime age since the initial structural breakout.
• 100% Vol Level: The exact price coordinate where the heaviest volume anomaly occurred during the current sequence.
🔶 TRADING APPLICATIONS
High-Volume Pullback Entries: During a strong trend, look for pullback entries directly into unmitigated lines that have high volume percentages (75% - 95%). These thick vector nodes represent massive resting buy/sell block clusters where institutions are likely to defend their positions.
Breakout Confirmation Diamonds: The trend reversal points are highlighted on your chart with sharp diamond markers. A breakout accompanied by an immediate generation of high-percentage liquidity trails suggests an institutional backed expansion.
Support & Resistance Confluence Trim: When multiple volume lines cluster closely together at a specific price zone, it builds a structural wall of institutional liquidity, marking a prime zone for target take-profits or reversal entries.
🔶 SETTINGS
Stabilization Coefficient: Controls the responsiveness of the underlying filtering mechanism. Lower values yield exceptionally smooth lines that are highly tolerant of short-term volatility spikes.
Volume Cutoff Threshold: The sensitivity slider for plotting liquidity vectors (0.0 to 1.0). A higher setting like 0.50 filters out quiet trading periods and only draws lines for bars with significant volume footprints.
Extend Lines Into Future: Determines the number of bars to project active unmitigated volume tracks into the right-hand margin blank space.
🔶 CONCLUSION
The Volume Liquidity Trend indicator offers an institutional perspective by integrating volume data directly into a trailing trend model. By isolating volume profile nodes specifically to the lifetime of the current trend and introducing adaptive coloring based on price positioning, it ensures your support and resistance targets perfectly match real-time market participant behavior. مؤشر

Support & Resistance Zones [HexaTrades]
This indicator automatically finds the price levels where the market has turned around before the places where buyers stepped in (support) and where sellers took over (resistance) and draws them as clean rectangular zones on your chart.
Instead of a thin line, each level is drawn as a zone with real thickness, because support and resistance are never one exact price; they are areas where price reacts. The zones update live, extend forward as long as they are valid, and turn into light "ghost" boxes once price finally breaks through them, so you always keep the full picture of the market's history.
Bitcoin 4h: the indicator marking support and resistance zones
How it works
- Finds swing points. A swing high is a candle whose high is higher than the 10 candles on each side of it (the "Swing Length" setting). A swing low is the same idea upside down. These are the exact spots where the market turned.
- Builds a zone from the candle. The zone covers the candle's wick from the extreme tip to the candle body. That wick is where orders actually pushed price back, so it becomes the zone.
- Keeps zone size sensible. Very small wicks get padded to a minimum height, and no zone can grow taller than a maximum height (both measured in ATR, so they adapt automatically to each market's volatility).
- Merges duplicate levels. If a new swing forms at a level that already has a zone, the two are combined into one box instead of stacking clutter on your chart.
- Watches for breaks. When a candle closes beyond a zone, the zone is "broken." what happens next is up to you (see below).
What happens after a zone breaks?
The indicator provides three different zone-management options.
Keep As Past Zone: The broken zone stops extending and remains visible as a faded historical zone. This makes it easier to review how price behaved around previous levels.
Flip Support/Resistance: A broken resistance zone becomes support, while a broken support zone becomes resistance.
This is useful for studying the common market concept of role reversal, where old resistance may act as new support and old support may act as new resistance.
Delete Zone: The zone is completely removed after it breaks. This option is useful for traders who prefer a cleaner chart showing only active zones.
Optional volume filter:
Volume-Confirmed Zones Only can be enabled to filter out lower-volume swing points.
When enabled, the volume of the swing candle must be higher than: Average Volume × Volume Multiplier
For example, with a Volume Multiplier of 1.2, the swing candle’s volume must be greater than 120% of its average volume.
The volume filter is automatically ignored when volume data is unavailable. Volume quality can vary between markets, exchanges and brokers.
Indicator settings
- Swing Length: Controls how significant a swing must be. Lower values create more zones, while higher values create fewer but potentially more significant zones.
- Maximum Zones: Limits the number of active zones displayed. When the limit is exceeded, the oldest active zone is removed.
- ATR Length: Sets the calculation period used to measure volatility.
- Minimum Zone Height: Sets the minimum zone thickness as a multiple of ATR.
- Maximum Zone Height: Prevents zones from becoming excessively wide.
- Merge Overlapping Zones: Combines overlapping or nearby active zones.
- Merge Distance: Controls the ATR-based distance used when deciding whether zones should be merged.
- Maximum Past Zones: Limits how many broken historical zones remain on the chart.
- Past Zone Transparency: Controls how clearly broken zones are displayed.
Alerts
- Built-in alerts
- Zone Touched — price entered a support or resistance zone.
- Resistance Broken — a candle broke above a resistance zone.
- Support Broken — a candle broke a support zone below.
- Set them up from TradingView's alert dialog: Create Alert → Condition → S/R Zones.
How to use it in trading
🔶Bounce trades: when price falls into a support zone and prints a rejection candle, that's a long setup with a stop just below the zone.
A blue support zone represents an area where buyers previously entered the market.
When price returns to support:
- Wait for price to enter or test the zone.
- Look for evidence that buyers are responding.
- Consider an entry only after confirmation.
- Place the stop beyond the opposite side of the zone, with an appropriate buffer.
- Use the next resistance zone as a possible target.
Possible bullish confirmation includes:
- A candle rejecting the lower part of the zone.
- A long lower wick followed by a bullish close.
- A bullish engulfing candle.
- Price closing back above the support zone.
- Increasing volume during the reaction.
- A higher low forming near the zone.
A support touch by itself is not a long signal. Price can move directly through the zone, especially during a strong downtrend.
Example image below:
🔶Rejection from resistance
A pink resistance zone represents an area where sellers previously entered the market.
When price reaches resistance:
- Wait for price to test the zone.
- Look for signs of selling pressure.
- Consider an entry only after bearish confirmation.
- Place the stop beyond the upper edge of the zone, with a suitable buffer.
- Use the next support zone below as a possible target.
Possible bearish confirmation includes:
- A long upper wick inside the resistance zone.
- A bearish engulfing candle.
- Price entering the zone and closing back below it.
- A lower high forming near resistance.
- Increasing selling volume during the rejection.
A resistance touch alone is not a short signal. Strong bullish momentum can break through resistance without producing a meaningful reversal.
Example image:
🔶Trading a breakout
A breakout occurs when price moves beyond an active zone.
- A break above resistance may indicate increasing bullish strength.
- A break below support may indicate increasing bearish strength.
For more conservative confirmation, select Close under Break Confirmation. In this mode, a resistance zone breaks only after a candle closes above it, while a support zone breaks only after a candle closes below it.
The Wick option reacts as soon as price trades beyond the zone. It responds faster but is more sensitive to temporary spikes and false breakouts.
Before considering a breakout trade, traders may look for:
- A strong candle closing beyond the zone.
- A candle body that closes clearly outside the zone.
- Higher-than-average volume.
- Momentum in the breakout direction.
- Alignment with the broader market trend.
- A successful retest of the broken zone.
🔶Trading a role reversal
Support and resistance can sometimes exchange roles after a breakout.
-Broken resistance may later act as support.
- Broken support may later act as resistance.
Select Flip Support/Resistance under the When Broken setting to display this behaviour automatically.
For example, after price closes above a pink resistance zone, the indicator converts that area into a blue support zone. If price later returns to it, traders can watch for a bullish reaction.
Similarly, when price breaks below blue support, the indicator converts the zone into pink resistance. A later retest may provide an area to watch for bearish confirmation.
Role reversal is a commonly observed price-action concept, but it does not occur successfully after every breakout. Wait for confirmation instead of entering only because price has returned to a flipped zone.
🔶Using zones for targets and stops
Zones can also help organise trade management.
For a long setup:
- A stop may be placed below the support zone.
- The next resistance zone may be used as an initial target.
- A higher resistance zone may be considered as a secondary target if momentum remains strong.
For a short setup:
- A stop may be placed above the resistance zone.
- The next support zone may be used as an initial target.
- A lower support zone may be considered as a secondary target.
Avoid placing the stop exactly on the edge of a zone. Price may briefly move beyond the boundary before reacting. The appropriate buffer depends on the symbol, timeframe, volatility and the trader’s risk plan.
Always calculate the potential risk and reward before entering a trade. A visible zone does not automatically make a setup worth taking.
🔶 Using multiple timeframes
Higher-timeframe zones can provide broader market context, while lower timeframes can help refine entries.
A simple process is:
- Identify important support and resistance on a higher timeframe.
- Determine whether the broader structure is bullish, bearish or ranging.
- Move to the preferred trading timeframe.
- Wait for price to reach a relevant zone.
- Use candle structure, volume or momentum for confirmation.
Higher timeframes generally produce fewer but more widely watched zones. Lower timeframes produce more zones and may contain more market noise.
Support and Resistance Zones help traders identify and manage important price areas with less chart clutter. Its volatility-based sizing, zone merging, break confirmation, role reversal, and alerts make it suitable for different markets and timeframes. Use the zones as areas to watch—not automatic trade signals and always combine them with price confirmation, broader market structure and proper risk management.
We would love to hear your suggestions. If you have ideas for new features, indicators, analytics, or improvements, please share your feedback. Your input helps guide future updates and improve the indicator for all traders.
Wedge pattern detector indicator is for educational and analytical purposes only. It is not financial advice. Trading involves risk. Always use proper risk management and combine this indicator with your own analysis before taking any trade.
مؤشر

SMC Liquidity Sweep Swing High/Low [JPT]🔷 OVERVIEW
Liquidity Sweep Reversal Engine is a price-action indicator designed to identify potential reversal setups after price sweeps confirmed swing highs or swing lows and rejects the liquidity level.
The indicator combines swing structure, liquidity sweep detection, rejection candles, trend confirmation, displacement, and optional volume analysis to filter potential LONG and SHORT setups.
After a confirmed signal, the indicator automatically provides a trade plan with:
• Entry level
• Stop Loss
• TP1 / TP2 / TP3
• Risk-Reward levels
• Signal score
🔷 CONCEPTS
Liquidity Sweep Detection
The indicator tracks confirmed swing highs and lows as potential liquidity areas.
• Buy-side liquidity sweep → price takes a previous swing high and rejects below it → SHORT bias.
• Sell-side liquidity sweep → price takes a previous swing low and rejects above it → LONG bias.
Rejection Confirmation
A sweep can be filtered using:
• Close back through the liquidity level
• Rejection wick
• Minimum wick percentage
• Candle direction
Trend Confirmation
An optional EMA filter helps align signals with the current market direction.
Displacement
The indicator can require a minimum candle-body size relative to ATR to help filter weak price movements.
Volume Filter
Optional relative-volume confirmation can be enabled to identify sweeps occurring with increased market participation.
🔷 FEATURES
1. Swing Liquidity Detection
• Automatic swing high/low detection
• Buy-side and sell-side liquidity levels
2. Liquidity Sweeps
• High sweep detection
• Low sweep detection
• Rejection confirmation
3. Signal Filtering
• EMA trend filter
• Displacement filter
• Optional volume filter
• Signal score from 1–5
4. Trade Management
• Automatic Entry
• ATR-based Stop Loss
• TP1 / TP2 / TP3
• Custom Risk-Reward ratios
5. Visuals
• Liquidity lines
• Swing labels
• LONG / SHORT labels
• Entry / SL / TP levels
6. Alerts
• LONG signal
• SHORT signal
• TP1 / TP2 / TP3
• Stop Loss
🔷 APPLICATIONS
1. Liquidity Sweep Reversals
Identify potential reversal opportunities after price takes liquidity above a swing high or below a swing low.
2. Market Structure Mapping
Use confirmed swing levels to visualize important liquidity areas and potential reaction zones.
3. Signal Filtering
The optional trend, displacement, volume, and score filters can help reduce weaker setups.
4. Trade Planning
The built-in Entry, Stop Loss, and multiple Take Profit levels provide a structured framework for evaluating trades.
🔷 NOTES
• Lower pivot settings generate more signals and may produce more noise.
• Higher pivot settings identify larger structural liquidity levels.
• Liquidity sweeps do not guarantee reversals.
• Signal confirmation occurs on the closed candle.
• Always evaluate signals within the broader market structure and apply appropriate risk management. مؤشر

Multi-Period VWAP (7D / 30D / 90D)This indicator plots three rolling Volume-Weighted Average Price (VWAP) lines calculated over trailing 7-day, 30-day, and 90-day windows, giving you a read on where price sits relative to volume-weighted "fair value" across short, medium, and long-term horizons.
Unlike a standard anchored VWAP that resets to zero at a fixed point (session, week, month), these lines are true rolling averages — they continuously reflect the most recent N days of trading and shift smoothly bar to bar, making them useful for spotting mean-reversion zones, confluence with order blocks/key levels, and gauging trend strength when the shorter VWAP is stacked above or below the longer ones.
Features:
- Adjustable lookback lengths for all three periods (defaults: 7 / 30 / 90 days)
- Toggle each VWAP on/off independently
- Customizable colors per line
- Choice of price source (HLC3, Close, or OHLC4)
- Optional "confirmed bars only" mode to prevent the lines from repainting as the current day's volume accumulates
- Live value labels on the last bar for each active VWAP
Built with crypto's 24/7 markets in mind, so the daily boundaries used for the rolling calculation aren't disrupted by traditional session gaps. مؤشر

Supply & Demand Zones - Zone Forge [AFD]
Two zones on your chart. One came from a four-bar coil that price left in a single decisive candle. The other took twenty bars to go nowhere and slid out the bottom. Your indicator drew them identically.
That difference is measurable at the moment each zone forms - how tight the base was, how hard price left it - and it is measurable from the same two numbers the tool already had to compute in order to find the zone at all. Almost every zone tool computes them on the way past and throws them away.
Zone Forge keeps them. Every zone is scored on how it was constructed, and the score is painted rather than printed: a well-built zone carries more glow and deeper fill, a marginal one recedes into the background. No letter, no number, nothing to decode. The chart sorts itself.
Why it matters
A supply or demand zone is a fussy construction pretending to be a simple one. It needs a short, tight cluster of bars - the base - that price then left decisively in one direction. Both halves are measurable, and the ratio between them separates a coil that broke from a range that drifted. This describes how an area formed, and says nothing about what price does next.
At a glance
Four patterns, each switchable - rally-base-drop and drop-base-drop become supply; drop-base-rally and rally-base-rally become demand. Turn off the ones you do not trade.
A grade on every zone - built from two ratios the engine already computes, tiered Strong, Standard and Weak, and shown as vividness rather than as a label.
A one-way lifecycle - Fresh, Tested, Broken. A broken zone never returns to fresh, and a tested zone steps further back with each additional test.
Detection in one click - Scalp, Intraday or Swing set base length, tightness and departure strength together. Custom exposes all three.
Measured against your chart's own volatility - base height and departure distance are both in ATR(14) units, so one setting means the same thing on a $4 stock and a $400 one.
Nine colour themes - Signature, Neon, Muted, Mono, Terminal, Midnight, Ocean, Ember, and Paper for light charts, plus Custom. Three appearance presets over the top - Signature, Clean and Minimal - plus a Custom that leaves every control acting on its own.
Four alert conditions - new demand zone, new supply zone, zone tested, zone broken, as four separate entries in the alert dialog rather than one.
Three Data Window values for screening - distance to the nearest demand zone, distance to the nearest supply zone, and whether price is inside one.
How a zone is built
A base is a run of bars whose whole height fits inside Base tightness x ATR(14). A departure is a bar that CLOSES beyond that base by at least Departure strength x ATR(14) - the close, never the high or the low, so a spike that closes back inside draws nothing.
Both halves must be complete. A zone is created from a finished base and a finished departure, and appears on the bar that closes the departure, not before.
Two rules that change what you see:
A tight run LONGER than Base max length is rejected as a range. It is not trimmed to its last few bars and admitted anyway.
The departure is measured against the PREVIOUS bar's ATR, so the departure bar's own range cannot inflate the threshold it has to clear.
The grade, stated plainly
grade score = (departure distance / required distance) / max(base height / height limit, 0.50)
A zone that cleared the departure requirement by 3x off a base using half its allowed height scores well above one that cleared it by 1.1x off a base that used all of it. Only just qualifying on both counts scores 1.0x.
Weak, Standard and Strong are fixed thresholds on that score, and the tier is decided on the bar that creates the zone.
The score is computed once and is never recomputed. A zone already on your chart does not restyle itself later.
Grade emphasis sets how far apart the three tiers LOOK, from nearly identical to a wide visual split. It changes appearance only, never which tier a zone is in.
The tiers describe construction. They are not a ranking of what is likely to happen at a zone, and no tier is presented as the one to trade.
The lifecycle
Fresh - price has not come back yet. Brightest.
Tested - price traded into the zone and it held. The fill and glow step back, and each further test steps them back again up to a fixed limit, so an area that has been worked repeatedly recedes on its own rather than vanishing.
Broken - price closed through it. Hidden by default, because showing them roughly triples what is on the chart.
You choose what counts as each. Break rule is close-through or wick-through; Test rule is wick-touch or close-inside. Break beats test on the same bar, and the lifecycle only ever runs one way - a broken zone never becomes fresh again.
Flip broken zones, off by default, draws a fresh zone of the OPPOSITE type at the same levels when a zone breaks. The broken zone stays broken - this creates a new zone rather than reversing an old one, so nothing already on your chart changes what it claims to be. One generation only.
How it differs from a standard zone tool
The grade is a consequence of the construction, not a bolt-on - a swing-pivot band inflated by a fixed ATR width has no tightness to measure, and a fair-value gap has no base at all. Only something that finds a consolidation and THEN measures the move away from it has the two numbers to divide.
Strength is the visual language - the ranking is carried by glow and fill depth, so the chart is read at a glance instead of decoded. No letter appears on the box unless you ask for one.
The chart is kept bounded on purpose - a cap per side, a maximum age, broken zones hidden, and an overlap rule that will not admit a new zone sitting on top of a live one.
A theme system, not a colour picker - nine curated palettes, one of them built for a light chart, and three appearance presets over the top.
Nothing about the grade is hidden - the score is one division, the two thresholds it divides are the same ones detection already applied, and every constant is a named value in source you can read. A trust signal, not the pitch: what you are here for is the zones.
The visuals
Layered glow, not a flat rectangle - concentric halo boxes off a single Glow intensity control, with a floor so no layer is ever invisible. Glow spread sets how far the halo reaches.
Fill, border and edges are independent - each carries its own colour, width and style, and each can be switched off. Border off leaves the fill and the glow; fill off leaves an outline.
Emphasise nearest zone - thickens the border of the zone closest to price on each side.
50% line - the midpoint mitigation level, off by default, with its own colour and style.
Labels - Type, Type + age, Type + grade, Type + touches or Age; four positions, four sizes, a bar offset; worded Supply/Demand, the full pattern name or the trade shorthand. Every label carries a hover breakdown: pattern, span, state, age and grade.
Zone count table - a small optional panel counting what is on the chart.
Master opacity - fades every colour together in one control, without touching any individual setting.
Alerts
New demand zone
New supply zone
Zone tested
Zone broken
Create these from TradingView's alert dialog. How often an alert re-fires while its condition holds is set in that dialog, not in the script. A running alert keeps the inputs, symbol and timeframe it was created with - recreate it after changing any of them.
How to use it
Pick a detection style first - Scalp, Intraday or Swing. It is the only setting that changes WHAT gets found; everything else changes how what was found looks.
Works best on a 5-minute chart or lower - a zone needs a completed base and a completed departure to print, and that pattern completes far more often per session on a fast chart than a slow one, so a 5-minute-or-lower timeframe gives you more zones to read.
Read the fresh zones first - they are the brightest, and they are the areas price has not returned to.
Read the grade as build quality - a Strong zone came from a tight base and a decisive departure, a Weak one only just cleared both tests. Both are drawn, because knowing which is which is the point.
Watch a zone dim - each test steps it further back. A zone tested three times looks like what it is.
Set the look once - Preset gives you the vivid default, a clean one and a minimal one in a click, or Custom to set everything yourself; Colour theme gives nine palettes; Master opacity fades the lot. Then leave it alone.
Hover anything unclear - all 63 inputs carry a tooltip, and every zone label carries a breakdown.
What it deliberately does not do
It reads the open, high, low, close and volume of the chart you have open, and nothing else. There are no request.security() calls, no other symbol, no higher-timeframe import, and no options or order-book data of any kind.
So it does not know about order flow, dealer positioning, or where anyone's orders actually are. Supply and demand here name where a price move ORIGINATED. They do not name a measured book, and the words that would imply otherwise are kept out of every string this script ships.
It draws no entries, exits, targets or arrows, and makes no accuracy, reliability, profitability, probability or future-result claim of any kind. The grade describes an area built from bars that have already printed: a construction score establishes neither future direction nor the quality of any trade. Educational chart context only - not financial advice.
Data, timeframes and what to check yourself
Zones are created from confirmed bars only - a completed base and a completed departure. Once created, a zone's geometry does not move: its top, bottom and left edge are fixed, and only its lifecycle state changes, one way, on closed bars. Confirm it with the bar-replay tool on your own symbol and timeframe before relying on it - a description of mechanism is not that check, and nothing here claims to be.
The three Data Window values read the live close - the two distances and the inside-zone flag. They create, test, break and prune nothing.
The zone count is bounded by Pine's drawing limits - the source declares budgets of 500 boxes, 500 lines and 100 labels, and every glow layer, edge line and label spends from them. Max zones per side and Max zone age are the controls that keep you inside.
Standard time-based candles - on Heikin Ashi, Renko or Range the engine measures those synthetic values rather than traded prices, so the bases it finds are not the bases on your price chart.
Base tightness is not a strictness dial - the zone count peaks in the middle of its range and falls away at both ends, which is why the range stops where it does. Loosening it past the peak draws FEWER zones, not more.
Detection needs history - ATR(14) must exist before anything can be measured against it, so the opening bars of a chart produce nothing.
Originality and credit
Supply and demand zones are old ground. What is new is that the construction is measured, and the measurement is what you see: base tightness and departure distance resolved into one score, that score frozen on the bar that creates the zone, and the ranking expressed as glow and fill depth rather than as a label to decode.
Open source under the Mozilla Public License 2.0. (c) Auction Foundry.
مؤشر

SMC Institutional Clean Wave & Structure PROSMC Institutional Clean Wave & Structure PRO
SMC Institutional Clean Wave & Structure PRO is a refined technical analysis indicator engineered to provide institutional order flow insights, precise market structure tracking, and uncluttered visual clarity on both light and dark trading themes. It replaces unnecessary chart noise with clean dynamic trend wave fills, smart consolidation candle color detection, and confirmed structure shifts.
Key Features Overview
1. Dynamic Single Trend Wave & Background Fill
Provides a smooth continuous structural trend wave. Renders vibrant green during bullish expansion phases and solid red during bearish contraction phases with a soft, unobtrusive background fill.
2. Smart Consolidation Candle Engine
Automatically highlights price action state. Bullish candles render in bright green, bearish candles in red, while tight consolidation or inside bar candles dynamically shift to a distinct grayish-white color to quickly highlight market compression.
3. Clean Market Structure Shifts (BOS & CHoCH)
Tracks key market structure breakouts. Identifies initial trend reversals as Change of Character (CHoCH) and structural extensions as Break of Structure (BOS), rendered with centered non-overlapping labels.
4. Confirmed Major Swing BUY & SELL Badges
Highlights major institutional high and low pivots with confirmed BUY and SELL badges. Pivot sensitivity and badge styling can be customized independently.
5. Target Standard Deviation Level (-2.5 SD)
Calculates real-time structural volatility and projects a dynamic -2.5 Standard Deviation Target line to help anticipate key potential market reaction levels.
Settings Overview
Trend Wave Settings
- Show Trend Wave Line: Toggle wave line and fill display.
- Colors & Opacity: Adjust trend line colors and background opacity.
Candle Engine Settings
- Enable Smart Candle Color Engine: Toggle adaptive candle colors.
- Custom Colors: Define unique colors for bullish, bearish, and inside bars.
Structure Settings
- Show BOS & CHoCH Shifts: Toggle structure labels.
- Structure Sensitivity: Fine-tune pivot detection rules for cleaner charts.
Signal Badges
- Show Confirmed BUY / SELL Badges: Toggle buy and sell markers.
- Signal Swing Sensitivity: Adjust lookback periods for pivot signals.
Standard Deviation Settings
- Show -2.5 SD Target Line: Toggle volatility target line.
- Custom Style: Adjust line thickness, color, and line style options.
Disclaimer
This script is built strictly for educational, analytical, and charting enhancement purposes. It does not offer financial advice or guaranteed trading results. Practice strict risk management.
مؤشر

HTF Candle & Key LevelsHTF Candle & Key Levels Overlay
A clean, clear TradingView indicator for analyzing Higher Timeframe (HTF) market structure and price action. It projects key percentage levels and Fibonacci ratios from the higher timeframe candle directly across your chart background, while displaying the active HTF candle neatly on the right margin—keeping your main chart completely unobstructed.
Key Features:
Flexible HTF Selection: Track Daily, 4-Hour, 1-Hour, or other timeframe candles on your lower-timeframe execution charts (e.g., 1m, 5m, 15m) to maintain full context of the broader price range.
Selectable Key & Fibonacci Levels: Easily toggle crucial range points and Fibonacci retracements—such as 0% (Low), 40%, 50% (Midpoint), 60%, 61.8%, 78.6%, and 100% (High)—complete with optional real-time price and percentage labels.
Right Candle: Renders the body and wicks of the current HTF candle off to the right side of active price action, ensuring your execution chart remains clean.
Full Customization: Adjust line styles (Solid, Dashed, Dotted), line thickness, colors, and candle parameters to fit your visual preference. مؤشر