VWAP Rejection + CISD AlertVWAP Rejection + CISD Alert — Full Backtest Table + Entry Time Window
This powerful intraday ICT-style indicator automatically detects high-probability VWAP Rejection + CISD setups and gives you everything you need to trade them with precise risk management.
Strategy Rules (all must align):
VWAP Rejection: Candle body fully above VWAP (bullish) or below VWAP (bearish) with a wick touching VWAP.
CISD Confirmation: Strong reversal candle after minimum consecutive opposite candles (default 2), breaking the prior high/low, and occurring within max bars after rejection (default 2).
Extra Filters:
CISD candle must open above VWAP (longs) or below VWAP (shorts).
CISD candle must close above/below your chosen Moving Average (SMA/EMA/WMA/VWMA – fully adjustable).
Entry: At the open of the very next candle after CISD confirmation.
Stop Loss: Choose between:
Open of the CISD candle (original)
Extreme wick of the VWAP rejection candle (low for longs / high for shorts)
Take Profit: User-defined multiplier (default 2R) from entry.
Visuals & Tools:
Small REJ↑ / REJ↓ labels on rejection candles
Large lime/fuchsia CISD↑ / CISD↓ triangles on confirmation
Detailed ENTRY LONG/SHORT labels showing exact Open, SL, and TP prices
Horizontal lines (Entry dashed blue, SL red, TP green) starting at the CISD candle and automatically stopping when price hits SL or TP
Yellow TP and Blue SL hit triangles marking exact exit candles
Live Performance Table (top-right) showing:
Total Trades
Wins / Losses
Win Rate %
Current TP Multiplier
Key Inputs:
CISD Settings: Min consecutive candles, Max bars after rejection
Risk Management: TP Multiplier, SL Placement (2 options)
Moving Average Filter: Length + Type (SMA/EMA/WMA/VWMA)
Time Filter: Entry Time Window (default 8:00–11:00 AM EST)
Visual toggles for labels, lines, and CISD shapes
Alerts:
Set alerts on “CISD Confirmed → LONG Setup” or “SHORT Setup”.
Alerts fire the moment the CISD candle closes — perfect timing to enter at the next open.
Ideal for 1m–15m charts on indices, forex, and futures. Combines classic VWAP rejection with ICT CISD concepts plus strict filters for cleaner, higher-probability trades. مؤشر

مؤشر

استراتيجية

مؤشر

مؤشر

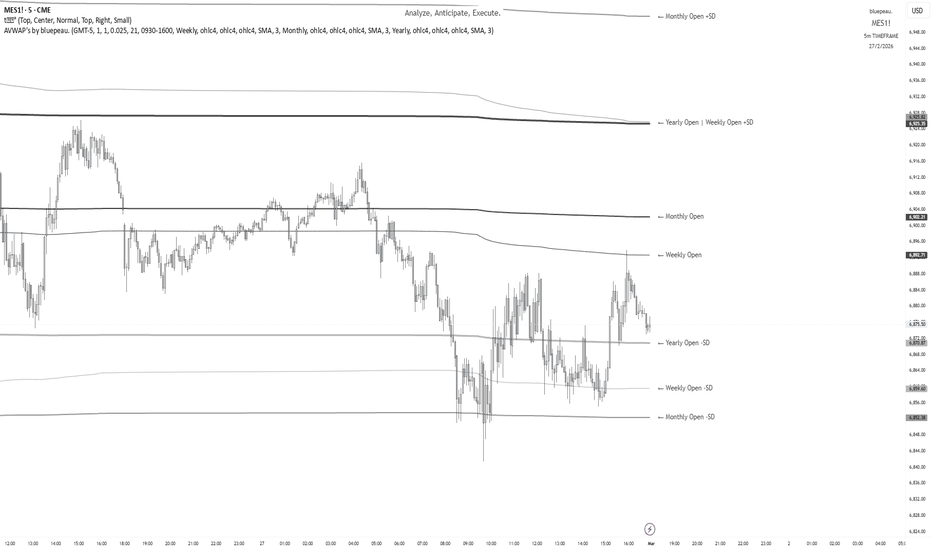
EOL Labs - Paragon HUD v2.2 Heads-Up Display for Trade Readiness─────────────────────────────────────────────────────────────
🧪 EOL Labs • Paragon HUD v2.2 — Heads-Up Display for Trade Readiness
─────────────────────────────────────────────────────────────
A three-stage trade readiness system that walks you through
the setup process — PREP, ARM, FIRE — so you never jump the
gun on a trade that hasn't fully confirmed.
▸ HOW IT WORKS
PREP — Conditions are aligning. Bias, slope, and filters
agree that a move may be developing near VWAP.
ARM — Price has crossed VWAP in the expected direction.
Setup is loaded. Wait for the trigger.
FIRE — EMA crossover confirms entry. Execute.
▸ KEY FEATURES
• Three-stage state machine (PREP → ARM → FIRE)
• VWAP proximity band for entries near fair value
• T3-smoothed slope confirmation with configurable lookback
• Higher-timeframe T3 directional gate (longs require HTF
upslope, shorts require HTF downslope — symmetric logic)
• OBV momentum filter with optional dynamic volume gate
• ATR-based stop loss and risk-multiple take profit levels
• Live SL/TP lines on chart (active side only, not spammed)
• Floating HUD panel: state, side, entry, SL, TP, R:R, timer
• Bar countdown timer shows seconds until current bar closes
• Static alertcondition() for TradingView alert dialogs
• Dynamic alert() with price levels for webhook automation
▸ RECOMMENDED SETTINGS
Works on any instrument and timeframe. Designed for intraday
trading on 1m–15m charts with a 60m HTF confirmation gate.
Default parameters are tuned for general use — adjust the
Bias Gate and ATR Stop multiplier for your instrument's
volatility profile.
▸ NON-REPAINTING
The HTF security call uses the close + lookahead_on
pattern to ensure confirmed-only higher-timeframe data.
Dynamic alerts fire only on barstate.isconfirmed. مؤشر

مؤشر
مؤشر

مؤشر

مؤشر

استراتيجية
مؤشر

مؤشر

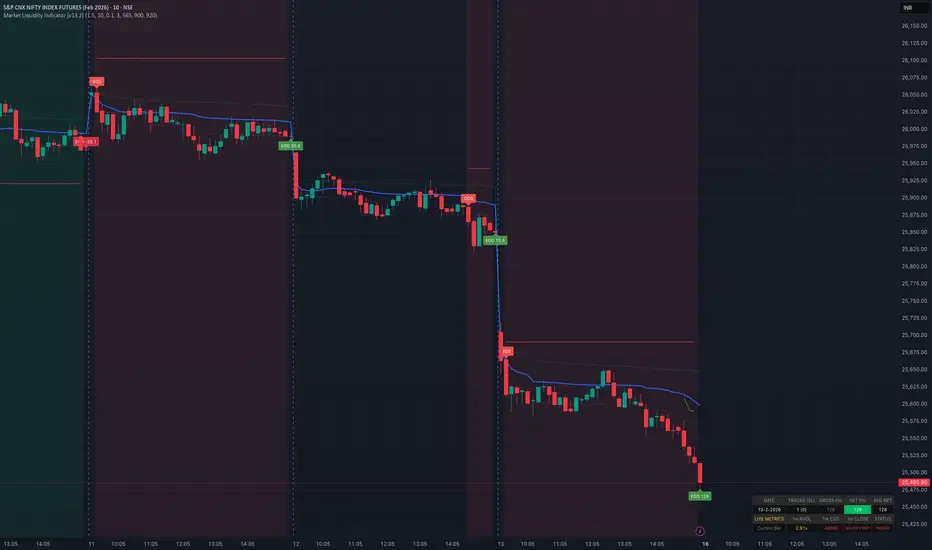
Advanced Engine: RVOL and Price ActionThis is an Enhanced version of SuperTrend and Volume Oscillator, utilising the Relative Volume and ZScore to give precise signals. This works well with Indicies and most stocks. Chose Chart TF as 10 mins
1. System Overview
The v6.12 Engine is a dual-timeframe algorithmic system. It utilizes the Chart Timeframe (CTF) to establish macro trend, mean-reversion boundaries, and structural momentum. Simultaneously, it runs a background 1-Minute Timeframe (1m TF) engine to analyze absolute volume expansion and micro-order flow delta.
The system features dynamic toggles allowing it to act as a strict trend-follower, a VWAP mean-reversion scalper, or a high-velocity volume breakout catcher.
2. Core Mathematical Components
A. Chart Timeframe (CTF) Indicators
SuperTrend (Macro Bias): ATR-based trailing envelope. (ATR: 10, Multiplier: 3.0).
Toggle:Ignore SuperTrend forces the internal state to true to allow pure VWAP mean-reversion trades.
VWAP (Intraday Baseline): Session-anchored Volume Weighted Average Price based on Typical Price (hlc3).
Volume Oscillator (Structural Momentum): Measures acceleration of trading volume.
VolOsc = 100 \times \frac{EMA(Volume, 5) - EMA(Volume, 10)}{EMA(Volume, 10)}
Requirement: Must be rising/falling over 2 consecutive bars.
Stochastic RSI (Price Velocity): Averaged %K and %D lines.
Requirement: Must be rising/falling over 2 consecutive bars, unless "Stuck" at extremities (< 1 or > 99).
B.1-Minute (1m TF) Indicators
Calculated independently of the chart timeframe using exact 1-minute tick data.
Relative Volume (RVOL): Compares the current 1m volume against the historical average volume for that exact same minute over the last N days (Default: 10 days).
Trigger (isHighRVOL): RVOL > 1.5.
Smoothed Delta Z-Score: Calculates the difference between buying volume and selling volume within the 1-minute candle, normalizes it into a Z-Score, and applies a 3-period Simple Moving Average.
Trigger (isZBull): Smoothed Z-Score is rising AND 1m Price is Bullish (Close > Open).
Trigger (isZBear): Smoothed Z-Score is rising AND 1m Price is Bearish (Close < Open).
3. Strict Entry Criteria
The engine evaluates signals via logical OR gates between sub-routines. If any of the following sub-routines return true, a trade is executed.
A. Long (BUY) Triggers
All Long entries strictly require the execution candle to be Green (Close > Open). If the 1m Sniper Filter is enabled, all Standard, Stuck, and Override entries must also have a Bullish 1m Z-Score (isZBull).
Standard Buy: SuperTrend Green + Price > VWAP + VolOsc Rising + StochRSI Rising.
Stuck Buy: StochRSI < 1 (bypassing slope) + SuperTrend Green + Price > VWAP + VolOsc Rising.
Oversold Override Buy: StochRSI < 20 + StochRSI Rising + VolOsc Rising + Price > VWAP (Overrides Red SuperTrend).
RVOL Breakout (If Enabled): Price > VWAP + SuperTrend Green + isHighRVOL + isZBull (Bypasses CTF VolOsc and StochRSI).
B. Short (SELL) Triggers
All Short entries strictly require the execution candle to be Red (Close < Open). If the 1m Sniper Filter is enabled, all Standard, Stuck, and Override entries must also have a Bearish 1m Z-Score (isZBear).
Standard Sell: SuperTrend Red + Price < VWAP + VolOsc Falling + StochRSI Falling.
Stuck Sell: StochRSI > 99 (bypassing slope) + SuperTrend Red + Price < VWAP + VolOsc Falling.
Overbought Override Sell: StochRSI > 80 + StochRSI Falling + VolOsc Falling + Price < VWAP (Overrides Green SuperTrend).
RVOL Breakout (If Enabled): Price < VWAP + SuperTrend Red + isHighRVOL + isZBear (Bypasses CTF VolOsc and StochRSI).
4. Strict Exit Criteria
The engine manages risk and flattens positions based on the following autonomous triggers:
Stop-and-Reverse (Standard): If an opposing valid entry signal fires while a position is open, the engine simultaneously calculates realized PnL, flips the state directly to the opposite direction, and updates the entry price.
VWAP Early Exit (If Enabled): Exits a trade prior to a full momentum reversal if the entire body of the candle closes across the VWAP line against the trade direction.
Long Exit: max(open, close) < VWAP
Short Exit: min(open, close) > VWAP
1m Micro-Divergence Exit (If Enabled): Exits a trade immediately if micro-order flow violently shifts against the position, regardless of the chart timeframe structure.
Long Exit: isHighRVOL AND isZBear.
Short Exit: isHighRVOL AND isZBull.
Cutoff Exit (Smart No-Entry): If a standard reversal signal fires after the No Entry Hour (Default: 14:45), the engine uses it to EXIT the current trade but strictly blocks the new entry leg.
EOD Square-Off (If Enabled): Hard flattens any remaining open positions at the exact close of the designated EOD candle (Default: 15:10) to secure intraday margins.
5. System Accounting & Webhook Outputs
Continuous Open PnL: The tradeState (-1, 0, 1) and entryPrice lock on execution. If swing trading (EOD Close disabled), floating PnL carries over across sessions.
Daily Realized PnL: Hard-resets to 0.0 at the first bar of a new calendar day. The previous day's total realized points are stamped to the Pine Logs.
Webhook Payload: The system fires strictly validated JSON strings to the configured endpoint at alert.freq_once_per_bar_close:
{"action": "BUY", "ticker": "...", "price": 0.00, "exchange": "..."}
{"action": "SELL", "ticker": "...", "price": 0.00, "exchange": "..."}
{"action": "EXIT", "ticker": "...", "price": 0.00, "exchange": "..."}
{"action": "SQUARE_OFF", "ticker": "...", "price": 0.00, "exchange": "..."}
مؤشر

Fair Value ZonesSee where today's true fair price is — and exactly how far the market has stretched from it.
Every trading session produces a single price that reflects where the majority of money actually changed hands. Large institutional traders — funds, banks, and market makers — reference this level constantly. When price drifts too far above or below it, it has a strong tendency to snap back. This indicator draws that fair value line and the stretch zones around it, reset fresh at the start of each session.
──── What You're Looking At ────
Gold line (centre) — the fair value line . This is the volume-weighted average price for the period. It represents the price that the most money was transacted at — the level large participants regard as "fair" on this day.
Blue bands (Band 1) — price is one standard move away from fair value. Normal pullbacks commonly find support or resistance in this zone.
Purple bands (Band 2) — price is significantly stretched. Reversions toward the fair value line are common from here.
Red bands (Band 3, optional) — price is extremely extended. These are rare but high-probability mean-reversion zones.
──── How to Read It ────
When price is above the fair value line , buyers are in control for the session. On dips, the fair value line tends to act as support — a level where buying interest resumes.
When price is below the fair value line , sellers are in control. On rallies, the fair value line tends to act as resistance — a ceiling where selling pressure reappears.
When price reaches Band 2 or Band 3 , it has moved far from where most of the day's volume was transacted. These levels mark potential exhaustion zones — especially when paired with a reversal candle.
Price returning to the fair value line from an outer band is called a mean reversion . On low-trend, range-bound days, this is one of the most reliable patterns available.
──── Settings ────
VWAP Settings
Source — the price input for the calculation. Default: average of high, low, and close (HLC3), which is the standard convention.
Reset Period — when to start a fresh calculation from zero:
Session — resets at the open of each trading day. Best for intraday timeframes (1-minute to 1-hour).
Week — resets every Monday. Best for swing traders holding multi-day positions.
Month — resets at the start of each calendar month. Best for position traders and investors.
VWAP Color / Width — visual customisation for the fair value line.
Band 1 / Band 2 / Band 3
Show — toggle each band level on or off individually.
× SD — the multiplier that sets how wide each band is. Default: 1×, 2×, 3× standard deviation. The bands widen automatically as price moves become larger — they adapt to the market's volatility for that session.
Color — independent color per band level.
Visuals
Show Band Fills — shades the area inside each band pair with a light fill, making the zones easier to see at a glance.
──── Alerts ────
Cross Above Fair Value — price crossed above the fair value line
Cross Below Fair Value — price crossed below the fair value line
Above +1 SD Band — price moved into the first upper stretch zone
Below -1 SD Band — price moved into the first lower stretch zone
Above +2 SD Band — price is significantly extended above fair value
Below -2 SD Band — price is significantly extended below fair value
──── Tips ────
This indicator is most effective on intraday timeframes (1m–1h) with Session reset, and on daily charts with Week or Month reset. It is not designed for use on weekly or monthly timeframes.
On strongly trending days, price may hold above the fair value line all session without returning to it — the line rises to meet price as more volume trades higher. Do not try to fade every move away from the line on a trending day.
The highest probability mean-reversion setups occur when price reaches Band 2 or beyond and shows a clear rejection candle — a long wick, an engulfing candle, or a pin bar pointing back toward fair value.
In choppy or low-volume sessions , the bands stay tight and price oscillates around fair value. These are ideal conditions for fading extremes back to the centre line.
Combine with the Trend Alignment Ribbon : trade in the direction the trend indicator confirms, and use pullbacks to the fair value line as your entry point.
مؤشر

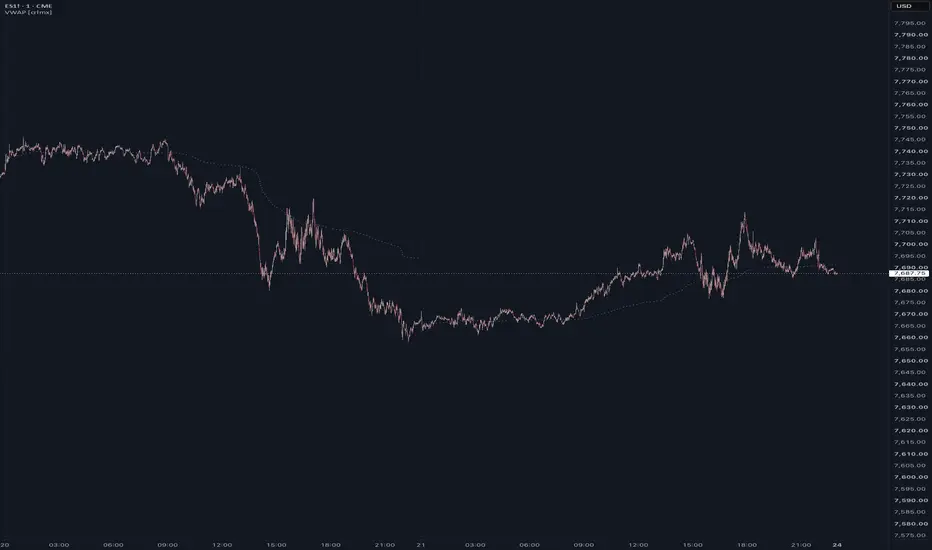
VWAP [crlmx] Flexible Volume Weighted Average Price (VWAP) for clean
volume-weighted fair value benchmark and trend direction.
Key Features
- Adjustable VWAP Anchor
- 30min, 1H, 2H, 4H, 8H, 12H, D, W, M, Q, Y
- Sessions New York, London, Asia, with adjustable time
- Clean session breaks, no skews in VWAP line
- Period limit fearure (default 3) hides older periods
- Streamlined inputs/UI brought to you by crlmx
Trading Applications
- Intraday anchors (30min-12H): scalping and day trading
- Daily anchor: traditional intraday analysis
- Weekly/Monthly/Quarterly: swing trading context
- Yearly: long-term fair value
- Configuration examples:
Scalping: 30min-1H anchor | Limit: 5-10 | Bands: On | Multiplier: 1.0-1.5
Intraday: Day anchor | Limit: 3-5 | Bands: On | Multiplier: 1.0-2.0
Swing: Week-Month | Limit: 3-5 | Bands: Off | VWAP line only
Position: Quarter-Year | Limit: 3 | Bands: Off | Fair value reference
Version History
v1.56 (Latest - 22 Feb 2026)
- VWAP display limit feature: shows set amount of periods
- Added Market Sessions
- Streamlined input panel organisation
مؤشر

VWAP Confluencia 3x (DIA, SEMANA, ANCORADA)VWAP Confluence 3x Daily · Weekly · Anchored
Purpose
A pragmatic VWAP suite for execution and risk management. It plots three institutional reference lines: Daily VWAP, Weekly VWAP, and an Anchored VWAP (AVWAP) starting from a user defined event (news, earnings, session open, swing high/low).
Why it matters
VWAP is the market’s “fair price” weighted by where volume actually traded. Confluence across timeframes and events turns noisy charts into actionable bias and clean levels.
What it does
Daily VWAP — resets each trading day; intraday “fair value.”
Weekly VWAP — resets each week; swing context and larger player defense.
Anchored VWAP — starts at a precise timestamp you set (e.g., news release).
Price source toggle — Typical Price
(𝐻+𝐿+𝐶)/3
(H+L+C)/3 or Close.
Visibility switches — enable/disable each line independently.
Anchor marker — labels the first bar of the AVWAP.
Inputs
Show Daily VWAP (on/off)
Show Weekly VWAP (on/off)
Show Anchored VWAP (on/off)
Price Source: Typical (H+L+C)/3 or Close
Anchor Time: timestamp of your event (uses the chart/exchange timezone)
How to anchor to a news event
Find the exact release time as shown in your chart’s timezone.
Open the indicator settings → set Anchor Time to that minute.
The AVWAP begins at that bar and accumulates forward.
Playbook (examples, not signals)
Strong long bias: price above Daily and Weekly VWAP; AVWAP reclaimed after news.
Strong short bias: price below Daily and Weekly; AVWAP reject after news.
Mean revert zones: price stretches far from the active VWAPs and snaps back; size around VWAP with tight risk.
Targets: opposite VWAP, prior day/week highs/lows, or liquidity pools near AVWAP.
Best used with
Session highs/lows, liquidity sweeps, volume profile, and time-of-day filters.
Notes & limitations
Works best on markets with reliable volume (equities, futures, liquid crypto). FX spot uses synthetic volume interpret accordingly.
Anchor Time respects the chart’s timezone. Convert news times before setting.
This is an indicator, not a backtestable strategy. No trade advice.
Disclaimer
For educational purposes only. Trading involves risk. Do your own research and manage risk responsibly. مؤشر

VWAP x3 [crlmx] Flexible tripple VWAP for multi-timeframe analysis with session-based
anchors for volume-weighted fair value benchmark and trend direction.
Key Features
- 3x fully adjustable VWAP anchor periods
- Off, 30min, 1H, 2H, 4H, 8H, 12H, D, W, M, Q, Y,
- New York, London, Asia Sessions with adjustable (UTC)
- Clean session breaks in VWAP line
- No skewed line continuation between anchor periods
- Lookback control for cleaner charts
- Session VWAPS exclude weekend days
- Optional VWAP labels with controls
- Streamlined inputs / UI brought to you by crlmx
Trading Applications
- VWAP 1 (Daily): intraday fair value
- VWAP 2 (Weekly): swing trade context
- VWAP 3 (Monthly): position trade reference
- Turn off unused VWAPs for cleaner charts
- Customizable to any anchor combination
- Examples;
Day Trading: VWAP1: 30min | VWAP2: 1H | VWAP3: Day
Swing Trading: VWAP1: Day | VWAP2: Week | VWAP3: Month
Session Trading: VWAP1: NY Session | VWAP2: London | VWAP3: Asia
Position Trading: VWAP1: Week | VWAP2: Month | VWAP3: Quarter
Version History
v1.43 (Latest - 19 Jan 2026)
- Three independent VWAP lines
- Session-based anchors (NY/London/Asia)
- Configurable session times (UTC)
- Lookback parameter
- Labels with size and offset options
- Clean session breaks at boundaries
مؤشر

CBC Flip with Targets and Filters [LuxAlgo]The CBC Flip with Targets and Filters indicator provides an institutional framework for identifying high-probability trend reversals based on the Candle By Candle (CBC) method.
By combining structural price action with dynamic ATR targets, stop losses, and intraday value filtering, this tool offers a straightforward strategy for managing risk and executing trades based on shifts in market bias.
🔶 USAGE
The Usage section describes how the script can be used to navigate market trends using price action confirmation and volatility-based levels.
🔹 Signal Identification
Bullish and bearish triangles indicate confirmed trend flips. A bullish flip is detected when price closes above a previous high, while a bearish flip occurs when price closes below a previous low. These signals only appear after the bar closes to ensure non-repainting execution.
🔹 Strategic Filtering
Align signals with intraday value by using the VWAP filter settings:
Confirmation mode: Ensures you only take long signals above the VWAP and short signals below it.
Contrarian mode: Used to identify potential mean-reversion opportunities when price flips against the current value area.
🔹 Risk Management
Every flip generates dynamic target and stop loss lines based on a customizable Average True Range (ATR). The 'Require candle close to stop' feature allows users to choose between a hard touch of the stop level or waiting for a candle close to invalidate the bias.
The script also includes retroactive outcome markers (circles and crosses) that appear on the signal candle to show whether the target or stop was reached first. A lack of symbol by the bullish or bearish triangles means neither the target nor stop loss criteria have been met.
🔹 Performance Verification
Refer to the real-time dashboard to monitor current trade progress and historical hit rates. The Current Target Progress metric in the dashboard tracks how far price moved in the trade direction, helping you optimize your ATR multipliers and assess trend strength.
🔶 DETAILS
🔹 Institutional CBC Logic
The Candle By Candle (CBC) methodology, popularized by maplestax, is a price action-centric approach that ignores minor fluctuations. By requiring a full candle close beyond the previous candle range, the script filters out wick rejections that often lead to false signals in volatile markets.
🔹 Non-Repainting Design
The indicator is designed to be fully non-repainting. Signals and levels are calculated based on closed bars, ensuring that what you see on the chart is consistent with historical performance and real-time execution.
🔶 SETTINGS
🔹 Indicator Settings
Bulls/Bears Color: Customizes the theme for bullish and bearish trend components.
ATR Length: Sets the lookback period for volatility calculations.
Target ATR Multiplier: Defines the distance of the profit target from the entry.
Stop ATR Multiplier: Defines the distance of the stop loss from the entry.
Require candle close to stop: When enabled, the stop loss is only triggered if a candle closes beyond the stop level.
Show Daily Anchored VWAP: Toggles the visibility of the session-anchored VWAP.
Filter Bias by VWAP: Choose between No Filter, Confirmation (Trend-following), or Contrarian (Mean-reversion).
🔹 Visuals
Show Flip Labels: Toggles the entry triangle icons.
Show Outcome Markers: Toggles the retroactive "X" and "Circle" markers on signal candles.
Label Size: Adjusts the size of the on-chart icons.
🔹 Dashboard
Dashboard: Toggles the performance metric table.
Position/Size: Adjusts the UI location and scale.
Historical Trade Count: Sets the sample size for the historical success rate calculation. مؤشر

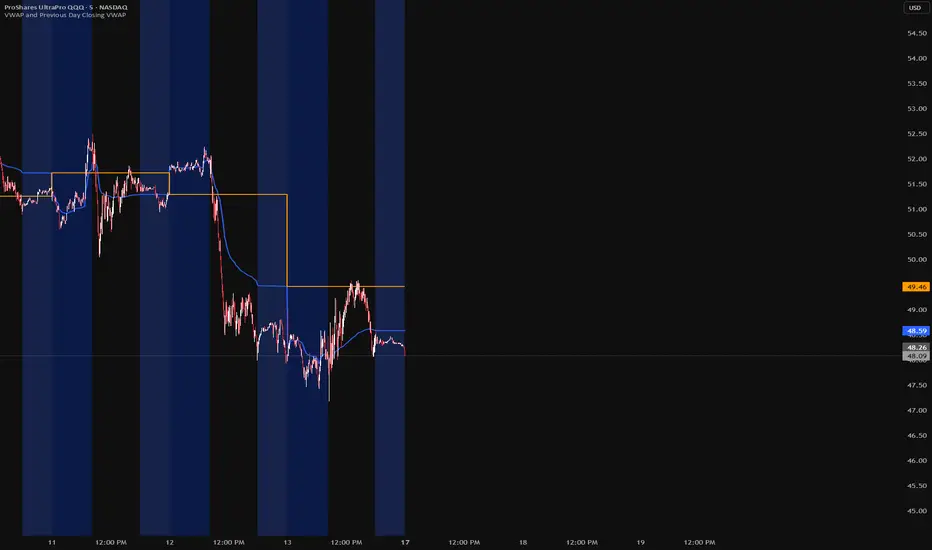
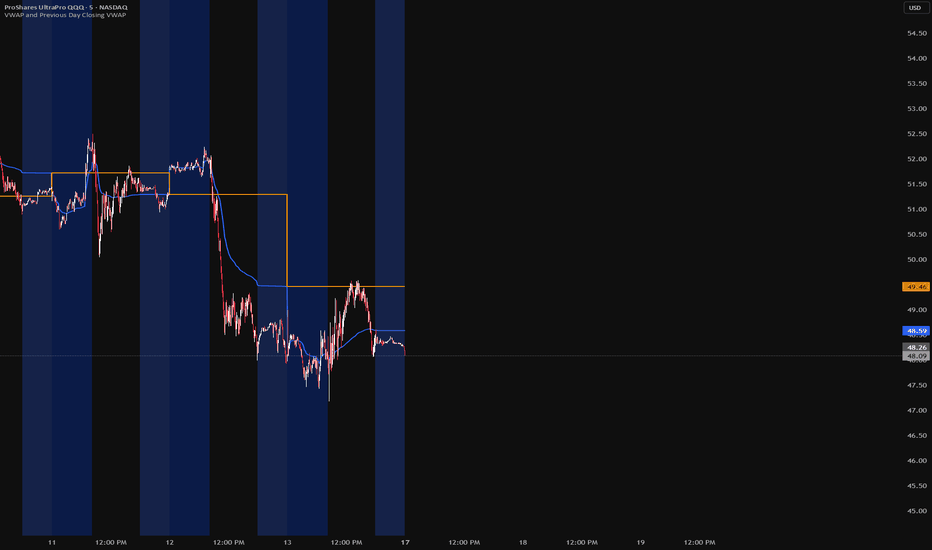
VWAP and Previous Day Closing VWAP1. Understanding the Two Lines
Current VWAP (The Dynamic Curve): This represents the average price paid throughout the current session, weighted by volume. It moves as new trades come in.
Previous Day’s Closing VWAP (The Flat Level): This is a fixed horizontal line representing where the institutional "average price" finished yesterday. It serves as a major psychological anchor point for the current day.
2. Common Trading Strategies
The Mean Reversion (The "Rubber Band")
If the price gaps up or moves significantly away from both the current VWAP and the Previous Day's VWAP early in the morning, traders often look for a "reversion to the mean."
The Logic: Large institutions rarely like to buy significantly above the day's average price.
The Trade: If the price starts losing momentum far above the VWAP lines, traders may look for a short position back down toward the Current VWAP.
The "Value" Retest
The Previous Day’s Closing VWAP often acts as a support or resistance zone.
Support: If the price opens above yesterday's VWAP, drops down to touch it, and then bounces, it confirms that buyers are defending "yesterday's value."
Resistance: If the price opens below it and fails to break above it, the market is signaling bearishness.
The Crossover Signal
When the Current VWAP crosses over or under the Previous Day’s Closing VWAP, it indicates a shift in trend strength.
Bullish: Current VWAP crosses above Previous Day's VWAP. This suggests today's buyers are more aggressive than yesterday's average.
Bearish: Current VWAP crosses below Previous Day's VWAP. This suggests today's selling pressure is heavier than yesterday's average.
3. Best Practices & Pro-Tips
Timeframes: This indicator is most effective on 1-minute, 5-minute, or 15-minute charts. On a Daily (D) chart, the lines will disappear or look like single dots because VWAP is calculated intraday.
Volume is Key: VWAP is only as strong as the volume behind it. If a bounce off the VWAP happens on low volume, it’s less reliable than a bounce on high volume.
The "No-Trade Zone": Many professional traders avoid taking long positions when the price is below the current VWAP, as they are essentially "buying at a premium" relative to the day's average sellers.
مؤشر
مؤشر

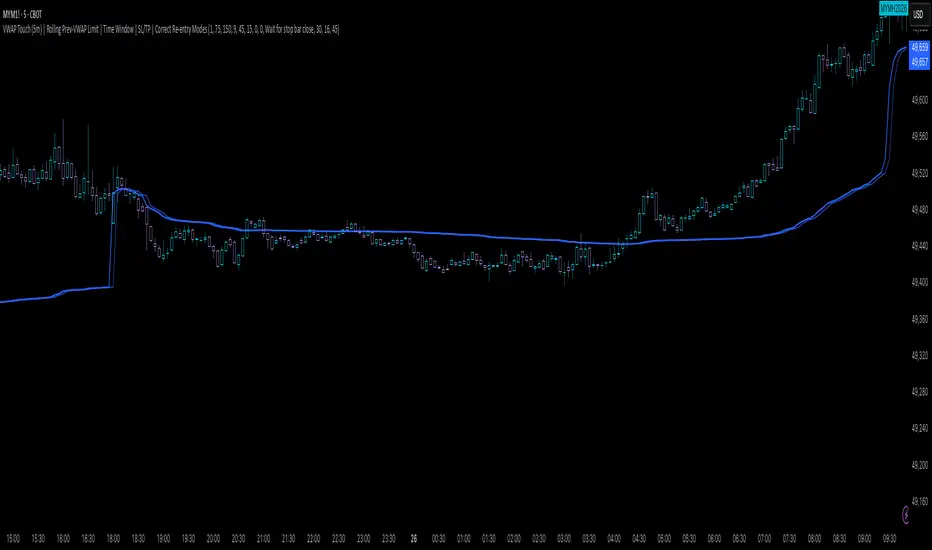
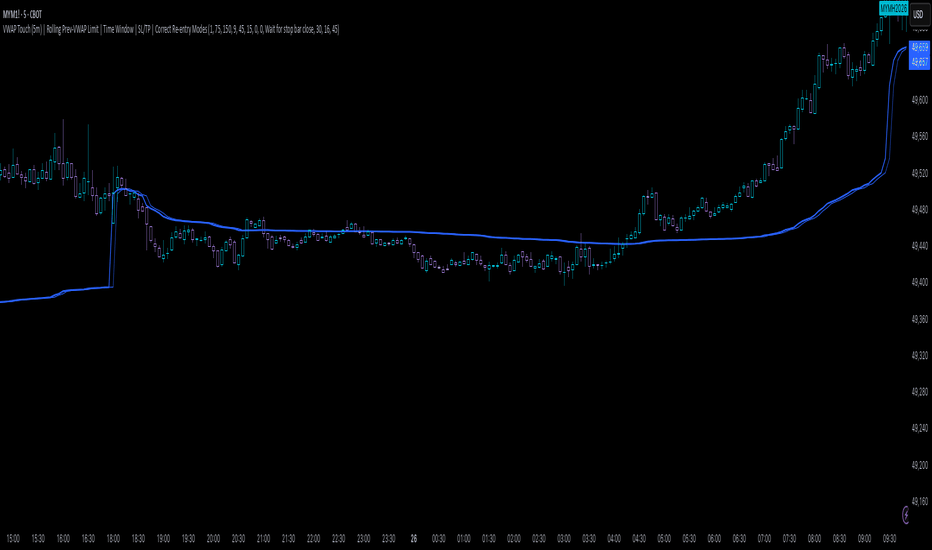
VWAP Gate (1m aligned ORB5)VWAP Gate v2.3 is a 1-minute aligned, session-aware VWAP regime filter (“gate”) designed to keep VWAP trades out of flat/choppy conditions and focus only on periods where VWAP is moving with structure. It plots a Session Anchored VWAP (RTH) with an ε touch zone, optionally plots an Overnight Anchored VWAP, and can mark VWAP retest entry signals only when the gate is active and price action confirms.
This is an overlay tool for discretionary execution and rule-based filtering. It does not manage exits, risk, or position sizing.
Core idea (what it does)
VWAP works best when the market has directional order flow and fails in mean-reverting chop. This indicator attempts to separate those regimes by requiring:
VWAP has actually moved (slope/magnitude filter)
Price is not constantly flipping around VWAP (chop filter)
Price is holding on one side of VWAP by a realistic buffer (hold/acceptance filter)
Only when these conditions persist does the Gate turn ON, enabling a “tradeable VWAP” environment.
All calculations are done on 1-minute data using request.security(..., "1", ...) so the behavior stays consistent across chart timeframes.
What is plotted
1) Session AVWAP (RTH Anchored VWAP)
A manually computed VWAP that resets at the start of the RTH session (default 09:30–16:00 New York).
It is plotted as “Session AVWAP” and changes color based on gate state and directional readiness (see “Colors” below).
2) VWAP ε Touch Zone (retest band)
Two lines around Session VWAP:
VWAP ε Upper = VWAP + ε
VWAP ε Lower = VWAP − ε
The band between them is filled. This creates a practical “touch zone” for retests and rejection closes.
ε (epsilon) is adaptive to instrument microstructure:
ε = max(minTicksEps × tickSizePts, spreadPts × epsSpreadMult)
This prevents treating tiny touches (often just spread/noise) as meaningful VWAP interactions.
3) Overnight AVWAP (optional)
If enabled, plots an Overnight anchored VWAP computed over the defined overnight session (default 00:00–09:30 New York).
Useful for mapping overnight fair value into the open.
4) ORB(5) High/Low (optional)
Plots the Opening Range Breakout (5 minutes) high/low (default 09:30–09:35 New York).
Optionally draws an ε band around ORB levels (ORB ± ε) to account for noise/spread around key levels.
5) VWAP Retest Entry Markers (optional)
When the gate is active, the tool can print:
“L” for a long retest entry
“S” for a short retest entry
These are filters + triggers, not guaranteed trades.
Gate logic (when trading is allowed)
A) VWAP Move / Slope filter
The indicator measures VWAP displacement over lookbackMin minutes:
VWAP_move = |VWAP_now − VWAP_lookback|
It must exceed thresholds tied to:
Recent price range: thrRange = kRange × (highestHigh − lowestLow over lookback)
Spread: thrSpr = kSpread × spreadPts
Threshold mode
Strict AND: VWAP_move must beat both thresholds
Loose: VWAP_move must beat max(thrRange, thrSpr)
Purpose: block low-energy sessions where VWAP drift is too small vs noise.
B) Chop filter (VWAP flips)
The indicator counts how often price flips sides of VWAP during the lookback window (with a small buffer to reduce micro-noise flips).
If flips exceed maxCrossesN, the environment is classified as chop and the gate cannot activate.
Purpose: avoid mean-reverting “ping-pong” around VWAP.
C) Gate confirmation (anti-flicker / hysteresis)
The gate requires persistence:
Gate turns ON after onConfirmBars consecutive passes
Gate turns OFF after offConfirmBars consecutive fails
Purpose: prevent rapid ON/OFF switching in borderline conditions.
Directional “Hold” readiness (LONG vs SHORT bias)
Even when the gate is ON, the indicator requires acceptance away from VWAP:
Define δ (delta buffer):
δ = max(2 ticks, spreadPts × holdDeltaMult)
Then:
HoldLong = price has stayed > (VWAP + δ) for holdBars 1-minute closes
HoldShort = price has stayed < (VWAP − δ) for holdBars 1-minute closes
Additionally, direction must agree with VWAP slope:
Long requires VWAP slope > 0
Short requires VWAP slope < 0
Purpose: avoid “false bias” when price temporarily deviates but VWAP is drifting the other way.
VWAP Retest Entry signals (L / S)
Entry markers trigger only when all are true:
Gate is active
Inside your Trade Window (default 09:40–11:00 New York)
HoldLongOk / HoldShortOk is true
Price touches the ε zone: low ≤ VWAP+ε AND high ≥ VWAP−ε
Then closes away from VWAP (“rejection close”) by a fraction of ε:
Long rejection:
close > VWAP + (ε × rejCloseFrac)
Short rejection:
close < VWAP − (ε × rejCloseFrac)
Optional: Require pullback can require the previous close to already be on the trend side (to avoid first-touch chaos).
Colors (quick regime read)
The Session VWAP line and ε zone communicate state:
Gray: gate inactive / no-trade regime
Yellow: gate active but no clean long/short hold yet (standby)
Lime: gate active + long hold confirmed (long bias)
Red: gate active + short hold confirmed (short bias)
Optional background tint can reinforce gate state, and optional shading can gray out bars outside the trade window.
Important notes / limitations
Set spreadPts and tickSizePts correctly for your instrument. ε and δ depend on them; wrong values distort the entire filter.
The indicator uses 1-minute computations across all chart timeframes for consistent behavior.
This tool is a regime filter + entry trigger, not a complete trading system (no exits, no sizing, no expectancy validation included).
If volume is missing/invalid, the script substitutes a minimal volume value for VWAP calculations.
Suggested use
Use Prop VWAP Gate to:
Avoid VWAP trading in flat/choppy opens
Focus attention when VWAP is moving and price is holding with structure
Execute VWAP retest setups inside a controlled time window
Combine with ORB(5) and overnight VWAP for key reference levels مؤشر

Institutional Value Relocation VerdictSummary in one paragraph
Value Relocation Verdict ARD is an acceptance versus rejection classifier for liquid instruments on intraday to daily timeframes. It helps you act only when multiple conditions align after price pushes beyond a boundary. It is original because it treats every break as a probe and scores whether value is relocating using a break anchored VWAP relocation metric fused with time outside, extension, outside volume share, pullback quality, and failure velocity back into value. Add it to a clean chart, read the compact decision table, and use the visuals or alerts. Shapes can move while the bar is open and settle on close. For conservative alerts select on bar close.
Scope and intent
• Markets. Major FX pairs, index futures, large cap equities, liquid crypto
• Timeframes. One minute to daily
• Default demo used in the publication. NQ1! on 15 minute
• Purpose. Prevent trading raw breakouts and raw fades before the market proves acceptance or rejection
• Limits. This is an indicator. It does not place orders and does not simulate fills
Originality and usefulness
This is not a mashup of common indicators. It is a state machine that measures what happens after a boundary is breached.
• Unique concept or fusion. Breaks are treated as probes and classified by value relocation using break anchored VWAP plus behavioral metrics outside the boundary
• What failure mode it addresses. False starts in chop, one bar breakouts that reverse, and fades taken too early when value is actually relocating
• Testability. The table shows the live decision, the two competing scores, and the driver metrics so users can verify why a suggestion appears
• Portable yardstick. All distances are normalized in ATR units so thresholds travel better across symbols
• Protected scripts. Public open source, implementation visible
Method overview in plain language
Base measures
• Range basis. True Range smoothed with ATR over ATR length
• Value basis. Session anchored VWAP defines a value center, with a configurable VWAP band as the value zone
Components
• Boundary selection. Choose prior day high and low, opening range, prior week high and low, VWAP band edges, or custom levels
• Probe state. A probe begins when price crosses a boundary. The boundary is frozen for the probe so time outside and velocity are measured consistently
• Acceptance score. A 0 to 100 score built from closes outside, max extension beyond the boundary, outside volume ratio, break anchored VWAP relocation, defense touches, expansion context, and a pullback penalty
• Rejection score. Evaluated only when price re enters the boundary. It fuses sweep size, snapback depth, fail velocity, speed of re entry, RVOL, compression context, and a value zone re entry bonus
• Context regime. A light regime classifier uses session VWAP slope and a higher timeframe EMA slope to bias acceptance slightly in trend direction and boost rejection slightly in ranges
• Session windows optional. Session follows the exchange time of the chart. Verify when changing symbol or venue
Fusion rule
• Two separate scores are maintained during a probe: Acceptance score and Rejection risk
• During the probe, the table shows a Lean decision based on the score spread: Acceptance score minus Rejection risk
• Thresholds for ACC and REJ are explicit in Inputs and the drivers are visible in the table
Signal rule
• ACC Up appears when a probe above the boundary reaches acceptance score threshold for the configured confirm bars, closes remain outside the buffer, and chase distance is not excessive
• ACC Down is symmetric for probes below the boundary
• REJ Up appears when price re enters the boundary after probing above and rejection score meets its threshold
• REJ Down is symmetric for probes below the boundary
• WAIT shows when no probe is active or when neither side has a clear edge
What you will see on the chart
• Active boundary line. Thick line at the frozen probe boundary
• Value zone. Optional VWAP band fill and optional VWAP lines for context
• Probe band. Optional thin band around the boundary equal to the outside buffer
• Break VWAP. Optional line during the probe that shows break anchored VWAP
• Markers. ACC and REJ markers on the bar where the model resolves
• Optional plan overlay. Entry, stop, and target lines for the last resolved signal, informational only
• Compact table. A decision dashboard with Lean, State, Regime, ACC score, REJ risk, and the drivers
Table fields and quick reading guide
• Decision. Lean ACC, Lean REJ, or Wait
• State. Idle, Probe Above, Probe Below, Waiting Levels, or Out of Session
• Regime. Trend Up, Trend Down, or Range
• ACC Score. 0 to 100 plus a bar gauge
• REJ Risk. 0 to 100 plus a bar gauge
• Boundary. Frozen boundary price during the probe
• Value VWAP. Session anchored VWAP price
• Outside. Closes outside count versus Accept min closes outside
• Delta. ACC Score minus REJ Risk, used to express separation
• Drivers shown by preset. Extension ATR, Reloc ATR, Out Vol, Pull ATR, RVOL, Fail Vel, Sweep ATR, Snap ATR, Expansion, Compression
Reading tip. When Session is ON and Delta shows clear separation, outcomes tend to be easier to manage than when both scores are similar.
Inputs with guidance
Setup
• Theme. Dark or Light. Matches chart background for readability
• Preset. Minimal, Standard, Pro. Minimal is the clean chart default
• Session and Require session. Typical use is ON for index futures and intraday equity sessions
• Cooldown bars. Typical range 0 to 15. Higher reduces clustered probes
• Max probe bars. Typical range 20 to 120. Lower avoids stale probes
• Decision delta. Typical range 10 to 25. Higher demands more separation before leaning
Levels
• Mode. Prev Day HL, Opening Range, Prev Week HL, VWAP Band, Custom
• Opening range minutes. Typical 15 to 60 on intraday charts
• Break trigger. Close is more conservative. Wick is earlier but noisier
• VWAP band width ATR. Typical 0.5 to 1.5
• Custom upper and Custom lower. Only active in Custom mode. Both must be greater than 0 and upper must be greater than lower
Scoring
• Outside buffer ATR. Typical 0.05 to 0.30. Higher requires stronger closes outside
• Accept min closes outside. Typical 3 to 10. Higher confirms slower relocations
• Accept min extension ATR. Typical 0.6 to 1.8. Higher demands stronger expansion
• Accept min outside volume ratio. Typical 0.45 to 0.80. Higher demands conviction
• Accept min relocation ATR. Typical 0.10 to 0.50. Higher demands value shift beyond the boundary
• Accept max pullback ATR. Typical 0.30 to 1.00. Lower penalizes weak holding
• Accept confirm bars. Typical 1 to 3. Higher reduces one bar acceptance
• Accept score threshold. Typical 60 to 85
• Accept max chase distance ATR. Typical 0.8 to 2.0. Lower avoids late entries
• Defense touches needed and defense touch distance ATR. Use 0 to disable. Typical 1 to 2 touches, 0.15 to 0.35 distance
Rejection scoring
• Reject max closes outside before re entry. Typical 2 to 6. Lower demands fast failure
• Reject min fail velocity. Typical 0.3 to 1.0. Higher demands sharper failure
• RVOL length and reject min RVOL. Typical 20 and 1.1 to 1.8
• Reject min sweep ATR and reject min snapback ATR. Typical sweep 0.25 to 0.80, snap 0.10 to 0.50
• Reject score threshold. Typical 60 to 85
Context
• Context timeframe. Typical 15, 30, or 60 minutes for intraday
• Context EMA length. Typical 34 to 100
• VWAP slope bars and trend slope threshold. Typical 4 to 12 bars, threshold 0.05 to 0.15
• Bias scores by regime. ON by default. Turn OFF if you want pure probe math only
UI
• Show signals, probe band, value fill, value lines, signal labels
• Table position and table size
Clean default. Minimal preset with value fill ON, value lines OFF, and labels OFF
Usage recipes
Intraday trend focus
• Preset Standard
• Context timeframe 30
• Bias scores by regime ON
• Accept score threshold 75
• Reject score threshold 80
• Break trigger Close
• Decision delta 20
Intraday mean reversion focus
• Preset Standard
• Mode Prev Day HL or Opening Range
• Bias scores by regime ON
• Reject max closes outside 3
• Reject min sweep 0.35 and snapback 0.20
• Reject score threshold 70
• Decision delta 15
Swing continuation
• Timeframe 60 minutes to 4 hours
• Context timeframe 1 day
• Increase Accept min closes outside and Accept confirm bars
• Increase Max probe bars
• Use Close trigger
• Raise Decision delta
Realism and responsible publication
• No performance claims. Past results never guarantee future outcomes
• No certainty about the future
• Intrabar motion reminder. Shapes can move while a bar forms and settle on close
• Standard candles are recommended. Non standard chart types change OHLC and can alter the meaning of sweeps and snapbacks
Honest limitations and failure modes
• Economic releases and thin liquidity can invalidate sweep and relocation behavior
• Gap heavy symbols can distort intrabar probe stats on small timeframes
• Very quiet regimes reduce score separation. Consider longer windows or higher thresholds
• Session windows use the exchange time of the chart
• Custom mode requires valid upper and lower values or the script will wait
Open source reuse and credits
• None
Legal
Education and research only. Not investment advice. You are responsible for your decisions. Test on historical data and in simulation before any live use. Use realistic costs. مؤشر